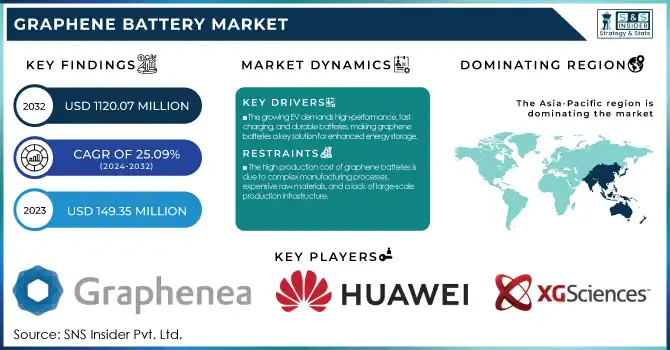
The Graphene Battery Market Size was estimated at USD 149.35 Million in 2023 and is expected to arrive at USD 1120.07 Million by 2032 with a growing CAGR of 25.09% over the forecast period 2024-2032. This report provides a unique perspective on the Graphene Battery Market by analyzing production output trends across key regions, market utilization rates, and R&D investments driving innovation. It offers insights into export/import dynamics, highlighting trade flows and regional dependencies. The study also examines supply chain efficiency and raw material availability, crucial for scaling up graphene battery production. Additionally, it explores technological advancements in energy storage, emerging strategic partnerships, and government policy impacts on commercialization. A special focus is given to pilot projects and real-world applications, offering a forward-looking view of market adoption.
To Get more information on Graphene Battery Market - Request Free Sample Report
Drivers
The growing EV demands high-performance, fast-charging, and durable batteries, making graphene batteries a key solution for enhanced energy storage.
The growing demand for electric vehicles (EVs) is a major driver for the graphene battery market, as the shift toward sustainable mobility requires advanced energy storage solutions. The widely used conventional lithium-ion batteries have drawbacks like slow charging, limited longevity, and thermal instability. Graphene batteries/ Graphene batteries have emerged as a solid alternative with greater energy density, super-fast charging, and increased longevity. These benefits lend themselves well to EV applications due to increased driving range and reduced charging times. With governments worldwide calling for stricter emissions regulations and offering incentives to adopt EVs, automakers are investing in next-generation battery technologies. At the same time, the emergence of self-sufficient and low-emission EV fleets adds to the demand for dependable and high-efficiency energy storage capabilities. By overcoming major issues related to manufacturing and energy density, and with the growing energy and research efforts from leading companies, the commercialization of graphene batteries for EVs will be accelerating the global shift towards electric mobility.
Restraint
The high production cost of graphene batteries is due to complex manufacturing processes, expensive raw materials, and a lack of large-scale production infrastructure.
The high production costs of graphene batteries stem from the complex and resource-intensive manufacturing processes required to produce high-quality graphene. Traditional production methods, such as chemical vapor deposition (CVD) and exfoliation, are costly, labour-intensive, and demand specialized machinery, posing challenges with large-scale manufacturing. Moreover, incorporation of graphene as battery electrodes requires complex processing which also adds to the cost. Sufficiently high-purity graphene with consistent structured properties must also be used, further adding to the cost of the fabrication process. Unlike conventional lithium-ion batteries, which will take advantage of established production infrastructure, graphene batteries are still too costly to be commercially viable on a large scale. Absence of mass production facilities and economies of scale exacerbates the affordability. That limits the ability of manufacturers to make a competitive market for graphene batteries in price-sensitive industries, including consumer electronics and electric vehicles. Nevertheless, with intensive research into cost-effective synthesis methods, including the reduction of graphene oxide and advanced mechanisms of electrode fabrication, prices may fall and the further advancement in commercialization could be achieved in the future.
Opportunities
Graphene batteries' lightweight, high-energy density, and thermal stability make them ideal for electric aviation, UAVs, and space applications.
The expansion of graphene batteries in electric aviation and space applications is driven by their lightweight nature, high energy density, and superior performance compared to traditional lithium-ion batteries. In aerospace, weight reduction is key to increasing fuel efficiency and extending flight range. With low mass, graphene batteries are perfect energy storage systems for electric planes, drones, and unmanned aerial vehicle (UAV) applications. Furthermore, their fast charging capabilities and thermal stability make them suitable for performance at higher altitudes, where conditions can cause adverse effects on batteries. In addition, the use of graphene batteries in space applications would provide with durability, longevity, reliable power supply for satellites and deep-space missions. Adding to their allure is their resistance to radiation and capability to function in inhospitable environments. With ongoing developments in the field of graphene battery technology, space and aerospace industries are predicted to embrace these energy storage solutions for longer flight durations, better safety measures, and enhanced operational performance.
Challenges
Limited awareness of graphene batteries' benefits and high costs hinder their widespread adoption across industries.
Limited awareness and adoption of graphene batteries remain significant challenges, as many industries and consumers are still unfamiliar with their advantages over traditional lithium-ion batteries. Graphene batteries have superior energy density, shorter charging times, lower self-heating effect, longer lifespan, better yield and recharge conditions, yet they should only be temporarily used, states the firm. Limited Education Around Graphene, As a new and advanced material, the benefits of graphene are not widely known among businesses and end-users, resulting in reluctance to invest in and utilize it. Moreover, due to the high production cost and being less available compared to the traditional vaccine, it is still slow to penetrate the market. Without significant educational outreach, marketing efforts, and demonstrable benefits for the long term, industries are likely to remain reliant on traditional battery solutions. It calls for awareness campaigns, partnerships with research institutions, and pilot projects shared with real-world examples for overcoming this. They may be adopted more quickly in electric cars, consumer electronics, and renewable energy storage as knowledge about graphene batteries increases.
By Type
The Lithium-ion Graphene Battery segment dominated with a market share of over 52% in 2023, due to its extensive use in electric vehicles (EVs), consumer electronics, and energy storage systems. High energy density, high conductivity, and fast-charging performance make these batteries suitable for the energy demands of today. Because graphene technology further improves thermal management, cycle life, and overall efficiency of lithium-ion batteries, these improved properties provide a way for higher lithium-ion battery market penetration in high-performance applications. Market growth is supported by the increasing demand for renewable energy storage solutions and electric vehicles (EVs). Also, the advancements in battery technology and reducing production skills help in maintaining the missile's share. The maintainers of the lithium-ion graphene battery market share, continue with the ongoing investments in R&D and large-scale production.
By Application
The Automotive segment dominated with a market share of over 32% in 2023, due to the growing demand for high-performance, fast-charging, and durable batteries in electric vehicles (EVs). As the world moves towards more sustainable means of transportation, EV manufacturers are looking for cutting-edge energy storage solutions that improve efficiency and range. Its additional active surface area for interaction leads to greater conductivity, higher energy density, and faster charging times, ideal for use in today's electric vehicles. Still, these batteries offer better thermal management, making them less prone to overheating and providing them a long life. Improved graphene battery technology will enable lighter, more compact power sources, further enhancing the overall performance of vehicles. With government and automakers fueling the EV race, graphene batteries are ushering in the future of electric mobility.
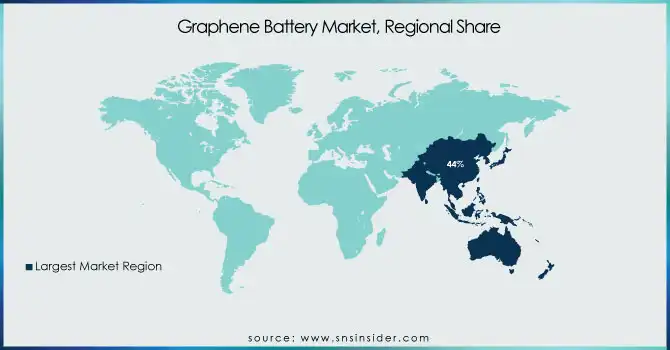
Asia-Pacific region dominated with a market share of over 44% in 2023, primarily due to the strong presence of industries such as consumer electronics, electric vehicles (EVs), and energy storage. Countries like China, Japan, and South Korea are ahead in graphene research and technological developments, as well as large-scale battery production. There are significant government initiatives in place in China for graphene-based energy solutions, in addition to extensive supply chain support, making them a strong competitor in the space. Japan and South Korea also play a role via extensive R&D and partnerships with battery makers. Its market leadership is bolstered by high demand for the company's technologies in the utility and automotive sectors, with the rapid industrialization of the region and investments in generation next energy storage technologies. Asia-Pacific leads the group in the total graphene battery industry, as its applications grow in EVs and renewable energy storage.
Europe is experiencing rapid growth in the graphene battery market due to its strong focus on sustainable energy solutions, government incentives for electric vehicles, and advancements in battery technology. Countries like Germany, the U.K., and France, which are driving research, innovation, and the widespread implementation of graphene-based energy storage systems. Supportive policies and substantial investment in renewable energy projects are also fostering market growth. Europe is already leading the way with technological breakthroughs and industrialization as the demand for efficient and environmentally-friendly batteries soars. With the proactive measures taken by the region, along with government regulations supporting their development, the integration of graphene batteries is becoming popular among electric vehicles and renewable energy systems, hence being the fastest-growing market in the segment.
Get Customized Report as per Your Business Requirement - Enquiry Now
Some of the major key players in the Graphene Battery Market
Graphenea Group (Graphene Oxide, Reduced Graphene Oxide)
Huawei Technologies Co., Ltd. (Graphene-enhanced Lithium-ion Batteries)
XG Sciences, Inc. (XG Leaf Graphene Nanoplatelets for Batteries)
Targray Group (Graphene Battery Materials, Conductive Additives)
Nanotech Energy (Graphene Supercapacitors, Graphene Batteries)
Vorbeck Materials Corp. (Vor-x Graphene Conductive Inks, Energy Storage Solutions)
Hybrid Kinetic Group Ltd. (Graphene-based EV Batteries)
Graphene NanoChem (Graphene-based Energy Storage Materials)
Log 9 Materials Scientific Private Limited (Rapid Charging Graphene Batteries, Aluminum Fuel Cells)
Cabot Corporation (Graphene-based Conductive Additives for Lithium-ion Batteries)
Samsung SDI (Next-Gen Graphene-enhanced Li-ion Batteries)
Grabat Graphenano Energy (Graphenano Grabat Batteries)
Global Graphene Group (Graphene-enhanced Li-ion Batteries, Nanocarbons)
Nanotek Instruments, Inc. (Graphene-based Supercapacitors, Hybrid Energy Storage)
ZEN Graphene Solutions Ltd. (Graphene-based Battery Anodes, Conductive Coatings)
Talga Group Ltd. (Talnode-C Graphene Battery Anode Materials)
First Graphene Ltd. (PureGRAPH Graphene Additives for Batteries)
Skeleton Technologies (Graphene-based Supercapacitors)
Real Graphene USA (Graphene Power Banks, Fast-charging Graphene Batteries)
Northern Graphite Corporation (Graphene-based Anode Materials for Lithium-ion Batteries)
Suppliers for (Graphene-assisted lithium-ion batteries with improved heat resistance and longer lifespan) on the Graphene Battery Market
Samsung SDI Co., Ltd.
Huawei Technologies Co., Ltd.
Log 9 Materials
Cabot Corporation
Grabat Graphenano Energy
Nanotech Energy
XG Sciences, Inc.
Global Graphene Group
Vorbeck Materials Corp.
Graphenea Group
RECENT DEVELOPMENT
In December 2023: Nanotech Energy announced plans to launch its 150 MW graphene battery production plant in California, U.S., by early 2024. This initiative aims to strengthen the company's market presence in the graphene battery industry.
| Report Attributes | Details |
|---|---|
| Market Size in 2023 | USD 149.35 Million |
| Market Size by 2032 | USD 1120.07 Million |
| CAGR | CAGR of 25.09% From 2024 to 2032 |
| Base Year | 2023 |
| Forecast Period | 2024-2032 |
| Historical Data | 2020-2022 |
| Report Scope & Coverage | Market Size, Segments Analysis, Competitive Landscape, Regional Analysis, DROC & SWOT Analysis, Forecast Outlook |
| Key Segments | • By Type (Lithium-ion Graphene Battery, Graphene Supercapacitor, Lithium Sulphur Graphene Battery, Others • By Application (Automotive, Consumer Electronics, Power, Industrial Robotics, Aerospace & Defense, Healthcare) |
| Regional Analysis/Coverage | North America (US, Canada, Mexico), Europe (Eastern Europe [Poland, Romania, Hungary, Turkey, Rest of Eastern Europe] Western Europe] Germany, France, UK, Italy, Spain, Netherlands, Switzerland, Austria, Rest of Western Europe]), Asia Pacific (China, India, Japan, South Korea, Vietnam, Singapore, Australia, Rest of Asia Pacific), Middle East & Africa (Middle East [UAE, Egypt, Saudi Arabia, Qatar, Rest of Middle East], Africa [Nigeria, South Africa, Rest of Africa], Latin America (Brazil, Argentina, Colombia, Rest of Latin America) |
| Company Profiles | Graphenea Group, Huawei Technologies Co., Ltd., XG Sciences, Inc., Targray Group, Nanotech Energy, Vorbeck Materials Corp., Hybrid Kinetic Group Ltd., Graphene NanoChem, Log 9 Materials Scientific Private Limited, Cabot Corporation, Samsung SDI, Grabat Graphenano Energy, Global Graphene Group, Nanotek Instruments, Inc., ZEN Graphene Solutions Ltd., Talga Group Ltd., First Graphene Ltd., Skeleton Technologies, Real Graphene USA, Northern Graphite Corporation. |
Ans: The Graphene Battery Market is expected to grow at a CAGR of 25.09% during 2024-2032.
Ans: The Graphene Battery Market was USD 149.35 Million in 2023 and is expected to reach USD 1120.07 Million by 2032.
Ans: The growing EV demands high-performance, fast-charging, and durable batteries, making graphene batteries a key solution for enhanced energy storage.
Ans: The “Lithium-ion Graphene Battery” segment dominated the Graphene Battery Market.
Ans: Asia-Pacific dominated the Graphene Battery Market in 2023
Table of Contents:
1. Introduction
1.1 Market Definition
1.2 Scope (Inclusion and Exclusions)
1.3 Research Assumptions
2. Executive Summary
2.1 Market Overview
2.2 Regional Synopsis
2.3 Competitive Summary
3. Research Methodology
3.1 Top-Down Approach
3.2 Bottom-up Approach
3.3. Data Validation
3.4 Primary Interviews
4. Market Dynamics Impact Analysis
4.1 Market Driving Factors Analysis
4.1.2 Drivers
4.1.2 Restraints
4.1.3 Opportunities
4.1.4 Challenges
4.2 PESTLE Analysis
4.3 Porter’s Five Forces Model
5. Statistical Insights and Trends Reporting
5.1 Production Output, by Region (2020-2023)
5.2 Market Utilization Rates, by Region (2020-2023)
5.3 Research & Development Investments, by Region
5.4 Export/Import Data, by Region (2023)
5.5 Supply Chain & Raw Material Availability
6. Competitive Landscape
6.1 List of Major Companies, By Region
6.2 Market Share Analysis, By Region
6.3 Product Benchmarking
6.3.1 Product specifications and features
6.3.2 Pricing
6.4 Strategic Initiatives
6.4.1 Marketing and promotional activities
6.4.2 Distribution and Supply Chain Strategies
6.4.3 Expansion plans and new product launches
6.4.4 Strategic partnerships and collaborations
6.5 Technological Advancements
6.6 Market Positioning and Branding
7. Graphene Battery Market Segmentation, By Type
7.1 Chapter Overview
7.2 Lithium-ion Graphene Battery
7.2.1 Lithium-ion Graphene Battery Market Trends Analysis (2020-2032)
7.2.2 Lithium-ion Graphene Battery Market Size Estimates and Forecasts to 2032 (USD Million)
7.3 Graphene Supercapacitor
7.3.1 Graphene Supercapacitor Market Trends Analysis (2020-2032)
7.3.2 Graphene Supercapacitor Market Size Estimates and Forecasts to 2032 (USD Million)
7.4 Lithium Sulphur Graphene Battery
7.3.1 Lithium Sulphur Graphene Battery Market Trends Analysis (2020-2032)
7.3.2 Lithium Sulphur Graphene Battery Market Size Estimates and Forecasts to 2032 (USD Million)
7.5 Others
7.3.1 Others Market Trends Analysis (2020-2032)
7.3.2 Others Market Size Estimates and Forecasts to 2032 (USD Million)
8. Graphene Battery Market Segmentation, By Application
8.1 Chapter Overview
8.2 Automotive
8.2.1 Automotive Market Trends Analysis (2020-2032)
8.2.2 Automotive Market Size Estimates and Forecasts to 2032 (USD Million)
8.3 Consumer Electronics
8.3.1 Consumer Electronics Market Trends Analysis (2020-2032)
8.3.2 Consumer Electronics Market Size Estimates and Forecasts to 2032 (USD Million)
8.4 Power
8.4.1 Power Market Trends Analysis (2020-2032)
8.4.2 Power Market Size Estimates and Forecasts to 2032 (USD Million)
8.5 Industrial Robotics
8.5.1 Industrial Robotics Market Trends Analysis (2020-2032)
8.5.2 Industrial Robotics Market Size Estimates and Forecasts to 2032 (USD Million)
8.6 Aerospace & Defense
8.6.1 Aerospace & Defense Market Trends Analysis (2020-2032)
8.6.2 Aerospace & Defense Market Size Estimates and Forecasts to 2032 (USD Million)
8.7 Healthcare
8.7.1 Healthcare Market Trends Analysis (2020-2032)
8.7.2 Healthcare Market Size Estimates and Forecasts to 2032 (USD Million)
9. Regional Analysis
9.1 Chapter Overview
9.2 North America
9.2.1 Trends Analysis
9.2.2 North America Graphene Battery Market Estimates and Forecasts, by Country (2020-2032) (USD Million)
9.2.3 North America Graphene Battery Market Estimates and Forecasts, By Type (2020-2032) (USD Million)
9.2.4 North America Graphene Battery Market Estimates and Forecasts, By Application (2020-2032) (USD Million)
9.2.5 USA
9.2.5.1 USA Graphene Battery Market Estimates and Forecasts, By Type (2020-2032) (USD Million)
9.2.5.2 USA Graphene Battery Market Estimates and Forecasts, By Application (2020-2032) (USD Million)
9.2.6 Canada
9.2.6.1 Canada Graphene Battery Market Estimates and Forecasts, By Type (2020-2032) (USD Million)
9.2.6.2 Canada Graphene Battery Market Estimates and Forecasts, By Application (2020-2032) (USD Million)
9.2.7 Mexico
9.2.7.1 Mexico Graphene Battery Market Estimates and Forecasts, By Type (2020-2032) (USD Million)
9.2.7.2 Mexico Graphene Battery Market Estimates and Forecasts, By Application (2020-2032) (USD Million)
9.3 Europe
9.3.1 Eastern Europe
9.3.1.1 Trends Analysis
9.3.1.2 Eastern Europe Graphene Battery Market Estimates and Forecasts, by Country (2020-2032) (USD Million)
9.3.1.3 Eastern Europe Graphene Battery Market Estimates and Forecasts, By Type (2020-2032) (USD Million)
9.3.1.4 Eastern Europe Graphene Battery Market Estimates and Forecasts, By Application (2020-2032) (USD Million)
9.3.1.5 Poland
9.3.1.5.1 Poland Graphene Battery Market Estimates and Forecasts, By Type (2020-2032) (USD Million)
9.3.1.5.2 Poland Graphene Battery Market Estimates and Forecasts, By Application (2020-2032) (USD Million)
9.3.1.6 Romania
9.3.1.6.1 Romania Graphene Battery Market Estimates and Forecasts, By Type (2020-2032) (USD Million)
9.3.1.6.2 Romania Graphene Battery Market Estimates and Forecasts, By Application (2020-2032) (USD Million)
9.3.1.7 Hungary
9.3.1.7.1 Hungary Graphene Battery Market Estimates and Forecasts, By Type (2020-2032) (USD Million)
9.3.1.7.2 Hungary Graphene Battery Market Estimates and Forecasts, By Application (2020-2032) (USD Million)
9.3.1.8 Turkey
9.3.1.8.1 Turkey Graphene Battery Market Estimates and Forecasts, By Type (2020-2032) (USD Million)
9.3.1.8.2 Turkey Graphene Battery Market Estimates and Forecasts, By Application (2020-2032) (USD Million)
9.3.1.9 Rest of Eastern Europe
9.3.1.9.1 Rest of Eastern Europe Graphene Battery Market Estimates and Forecasts, By Type (2020-2032) (USD Million)
9.3.1.9.2 Rest of Eastern Europe Graphene Battery Market Estimates and Forecasts, By Application (2020-2032) (USD Million)
9.3.2 Western Europe
9.3.2.1 Trends Analysis
9.3.2.2 Western Europe Graphene Battery Market Estimates and Forecasts, by Country (2020-2032) (USD Million)
9.3.2.3 Western Europe Graphene Battery Market Estimates and Forecasts, By Type (2020-2032) (USD Million)
9.3.2.4 Western Europe Graphene Battery Market Estimates and Forecasts, By Application (2020-2032) (USD Million)
9.3.2.5 Germany
9.3.2.5.1 Germany Graphene Battery Market Estimates and Forecasts, By Type (2020-2032) (USD Million)
9.3.2.5.2 Germany Graphene Battery Market Estimates and Forecasts, By Application (2020-2032) (USD Million)
9.3.2.6 France
9.3.2.6.1 France Graphene Battery Market Estimates and Forecasts, By Type (2020-2032) (USD Million)
9.3.2.6.2 France Graphene Battery Market Estimates and Forecasts, By Application (2020-2032) (USD Million)
9.3.2.7 UK
9.3.2.7.1 UK Graphene Battery Market Estimates and Forecasts, By Type (2020-2032) (USD Million)
9.3.2.7.2 UK Graphene Battery Market Estimates and Forecasts, By Application (2020-2032) (USD Million)
9.3.2.8 Italy
9.3.2.8.1 Italy Graphene Battery Market Estimates and Forecasts, By Type (2020-2032) (USD Million)
9.3.2.8.2 Italy Graphene Battery Market Estimates and Forecasts, By Application (2020-2032) (USD Million)
9.3.2.9 Spain
9.3.2.9.1 Spain Graphene Battery Market Estimates and Forecasts, By Type (2020-2032) (USD Million)
9.3.2.9.2 Spain Graphene Battery Market Estimates and Forecasts, By Application (2020-2032) (USD Million)
9.3.2.10 Netherlands
9.3.2.10.1 Netherlands Graphene Battery Market Estimates and Forecasts, By Type (2020-2032) (USD Million)
9.3.2.10.2 Netherlands Graphene Battery Market Estimates and Forecasts, By Application (2020-2032) (USD Million)
9.3.2.11 Switzerland
9.3.2.11.1 Switzerland Graphene Battery Market Estimates and Forecasts, By Type (2020-2032) (USD Million)
9.3.2.11.2 Switzerland Graphene Battery Market Estimates and Forecasts, By Application (2020-2032) (USD Million)
9.3.2.12 Austria
9.3.2.12.1 Austria Graphene Battery Market Estimates and Forecasts, By Type (2020-2032) (USD Million)
9.3.2.12.2 Austria Graphene Battery Market Estimates and Forecasts, By Application (2020-2032) (USD Million)
9.3.2.13 Rest of Western Europe
9.3.2.13.1 Rest of Western Europe Graphene Battery Market Estimates and Forecasts, By Type (2020-2032) (USD Million)
9.3.2.13.2 Rest of Western Europe Graphene Battery Market Estimates and Forecasts, By Application (2020-2032) (USD Million)
9.4 Asia Pacific
9.4.1 Trends Analysis
9.4.2 Asia Pacific Graphene Battery Market Estimates and Forecasts, by Country (2020-2032) (USD Million)
9.4.3 Asia Pacific Graphene Battery Market Estimates and Forecasts, By Type (2020-2032) (USD Million)
9.4.4 Asia Pacific Graphene Battery Market Estimates and Forecasts, By Application (2020-2032) (USD Million)
9.4.5 China
9.4.5.1 China Graphene Battery Market Estimates and Forecasts, By Type (2020-2032) (USD Million)
9.4.5.2 China Graphene Battery Market Estimates and Forecasts, By Application (2020-2032) (USD Million)
9.4.6 India
9.4.5.1 India Graphene Battery Market Estimates and Forecasts, By Type (2020-2032) (USD Million)
9.4.5.2 India Graphene Battery Market Estimates and Forecasts, By Application (2020-2032) (USD Million)
9.4.5 Japan
9.4.5.1 Japan Graphene Battery Market Estimates and Forecasts, By Type (2020-2032) (USD Million)
9.4.5.2 Japan Graphene Battery Market Estimates and Forecasts, By Application (2020-2032) (USD Million)
9.4.6 South Korea
9.4.6.1 South Korea Graphene Battery Market Estimates and Forecasts, By Type (2020-2032) (USD Million)
9.4.6.2 South Korea Graphene Battery Market Estimates and Forecasts, By Application (2020-2032) (USD Million)
9.4.7 Vietnam
9.4.7.1 Vietnam Graphene Battery Market Estimates and Forecasts, By Type (2020-2032) (USD Million)
9.2.7.2 Vietnam Graphene Battery Market Estimates and Forecasts, By Application (2020-2032) (USD Million)
9.4.8 Singapore
9.4.8.1 Singapore Graphene Battery Market Estimates and Forecasts, By Type (2020-2032) (USD Million)
9.4.8.2 Singapore Graphene Battery Market Estimates and Forecasts, By Application (2020-2032) (USD Million)
9.4.9 Australia
9.4.9.1 Australia Graphene Battery Market Estimates and Forecasts, By Type (2020-2032) (USD Million)
9.4.9.2 Australia Graphene Battery Market Estimates and Forecasts, By Application (2020-2032) (USD Million)
9.4.10 Rest of Asia Pacific
9.4.10.1 Rest of Asia Pacific Graphene Battery Market Estimates and Forecasts, By Type (2020-2032) (USD Million)
9.4.10.2 Rest of Asia Pacific Graphene Battery Market Estimates and Forecasts, By Application (2020-2032) (USD Million)
9.5 Middle East and Africa
9.5.1 Middle East
9.5.1.1 Trends Analysis
9.5.1.2 Middle East Graphene Battery Market Estimates and Forecasts, by Country (2020-2032) (USD Million)
9.5.1.3 Middle East Graphene Battery Market Estimates and Forecasts, By Type (2020-2032) (USD Million)
9.5.1.4 Middle East Graphene Battery Market Estimates and Forecasts, By Application (2020-2032) (USD Million)
9.5.1.5 UAE
9.5.1.5.1 UAE Graphene Battery Market Estimates and Forecasts, By Type (2020-2032) (USD Million)
9.5.1.5.2 UAE Graphene Battery Market Estimates and Forecasts, By Application (2020-2032) (USD Million)
9.5.1.6 Egypt
9.5.1.6.1 Egypt Graphene Battery Market Estimates and Forecasts, By Type (2020-2032) (USD Million)
9.5.1.6.2 Egypt Graphene Battery Market Estimates and Forecasts, By Application (2020-2032) (USD Million)
9.5.1.7 Saudi Arabia
9.5.1.7.1 Saudi Arabia Graphene Battery Market Estimates and Forecasts, By Type (2020-2032) (USD Million)
9.5.1.7.2 Saudi Arabia Graphene Battery Market Estimates and Forecasts, By Application (2020-2032) (USD Million)
9.5.1.8 Qatar
9.5.1.8.1 Qatar Graphene Battery Market Estimates and Forecasts, By Type (2020-2032) (USD Million)
9.5.1.8.2 Qatar Graphene Battery Market Estimates and Forecasts, By Application (2020-2032) (USD Million)
9.5.1.9 Rest of Middle East
9.5.1.9.1 Rest of Middle East Graphene Battery Market Estimates and Forecasts, By Type (2020-2032) (USD Million)
9.5.1.9.2 Rest of Middle East Graphene Battery Market Estimates and Forecasts, By Application (2020-2032) (USD Million)
9.5.2 Africa
9.5.2.1 Trends Analysis
9.5.2.2 Africa Graphene Battery Market Estimates and Forecasts, by Country (2020-2032) (USD Million)
9.5.2.3 Africa Graphene Battery Market Estimates and Forecasts, By Type (2020-2032) (USD Million)
9.5.2.4 Africa Graphene Battery Market Estimates and Forecasts, By Application (2020-2032) (USD Million)
9.5.2.5 South Africa
9.5.2.5.1 South Africa Graphene Battery Market Estimates and Forecasts, By Type (2020-2032) (USD Million)
9.5.2.5.2 South Africa Graphene Battery Market Estimates and Forecasts, By Application (2020-2032) (USD Million)
9.5.2.6 Nigeria
9.5.2.6.1 Nigeria Graphene Battery Market Estimates and Forecasts, By Type (2020-2032) (USD Million)
9.5.2.6.2 Nigeria Graphene Battery Market Estimates and Forecasts, By Application (2020-2032) (USD Million)
9.5.2.7 Rest of Africa
9.5.2.7.1 Rest of Africa Graphene Battery Market Estimates and Forecasts, By Type (2020-2032) (USD Million)
9.5.2.7.2 Rest of Africa Graphene Battery Market Estimates and Forecasts, By Application (2020-2032) (USD Million)
9.6 Latin America
9.6.1 Trends Analysis
9.6.2 Latin America Graphene Battery Market Estimates and Forecasts, by Country (2020-2032) (USD Million)
9.6.3 Latin America Graphene Battery Market Estimates and Forecasts, By Type (2020-2032) (USD Million)
9.6.4 Latin America Graphene Battery Market Estimates and Forecasts, By Application (2020-2032) (USD Million)
9.6.5 Brazil
9.6.5.1 Brazil Graphene Battery Market Estimates and Forecasts, By Type (2020-2032) (USD Million)
9.6.5.2 Brazil Graphene Battery Market Estimates and Forecasts, By Application (2020-2032) (USD Million)
9.6.6 Argentina
9.6.6.1 Argentina Graphene Battery Market Estimates and Forecasts, By Type (2020-2032) (USD Million)
9.6.6.2 Argentina Graphene Battery Market Estimates and Forecasts, By Application (2020-2032) (USD Million)
9.6.7 Colombia
9.6.7.1 Colombia Graphene Battery Market Estimates and Forecasts, By Type (2020-2032) (USD Million)
9.6.7.2 Colombia Graphene Battery Market Estimates and Forecasts, By Application (2020-2032) (USD Million)
9.6.8 Rest of Latin America
9.6.8.1 Rest of Latin America Graphene Battery Market Estimates and Forecasts, By Type (2020-2032) (USD Million)
9.6.8.2 Rest of Latin America Graphene Battery Market Estimates and Forecasts, By Application (2020-2032) (USD Million)
10. Company Profiles
10.1 Graphenea Group
10.1.1 Company Overview
10.1.2 Financial
10.1.3 Products/ Services Offered
110.1.4 SWOT Analysis
10.2 Huawei Technologies Co., Ltd.
10.2.1 Company Overview
10.2.2 Financial
10.2.3 Products/ Services Offered
10.2.4 SWOT Analysis
10.3 XG Sciences, Inc.
10.3.1 Company Overview
10.3.2 Financial
10.3.3 Products/ Services Offered
10.3.4 SWOT Analysis
10.4 Targray Group
10.4.1 Company Overview
10.4.2 Financial
10.4.3 Products/ Services Offered
10.4.4 SWOT Analysis
10.5 Nanotech Energy
10.5.1 Company Overview
10.5.2 Financial
10.5.3 Products/ Services Offered
10.5.4 SWOT Analysis
10.6 Vorbeck Materials Corp.
10.6.1 Company Overview
10.6.2 Financial
10.6.3 Products/ Services Offered
10.6.4 SWOT Analysis
10.7 Hybrid Kinetic Group Ltd.
10.7.1 Company Overview
10.7.2 Financial
10.7.3 Products/ Services Offered
10.7.4 SWOT Analysis
10.8 Graphene NanoChem
10.8.1 Company Overview
10.8.2 Financial
10.8.3 Products/ Services Offered
10.8.4 SWOT Analysis
10.9 Log 9 Materials Scientific Private Limited
10.9.1 Company Overview
10.9.2 Financial
10.9.3 Products/ Services Offered
10.9.4 SWOT Analysis
10.10 Cabot Corporation
10.9.1 Company Overview
10.9.2 Financial
10.9.3 Products/ Services Offered
10.9.4 SWOT Analysis
11. Use Cases and Best Practices
12. Conclusion
An accurate research report requires proper strategizing as well as implementation. There are multiple factors involved in the completion of good and accurate research report and selecting the best methodology to compete the research is the toughest part. Since the research reports we provide play a crucial role in any company’s decision-making process, therefore we at SNS Insider always believe that we should choose the best method which gives us results closer to reality. This allows us to reach at a stage wherein we can provide our clients best and accurate investment to output ratio.
Each report that we prepare takes a timeframe of 350-400 business hours for production. Starting from the selection of titles through a couple of in-depth brain storming session to the final QC process before uploading our titles on our website we dedicate around 350 working hours. The titles are selected based on their current market cap and the foreseen CAGR and growth.
The 5 steps process:
Step 1: Secondary Research:
Secondary Research or Desk Research is as the name suggests is a research process wherein, we collect data through the readily available information. In this process we use various paid and unpaid databases which our team has access to and gather data through the same. This includes examining of listed companies’ annual reports, Journals, SEC filling etc. Apart from this our team has access to various associations across the globe across different industries. Lastly, we have exchange relationships with various university as well as individual libraries.

Step 2: Primary Research
When we talk about primary research, it is a type of study in which the researchers collect relevant data samples directly, rather than relying on previously collected data. This type of research is focused on gaining content specific facts that can be sued to solve specific problems. Since the collected data is fresh and first hand therefore it makes the study more accurate and genuine.
We at SNS Insider have divided Primary Research into 2 parts.
Part 1 wherein we interview the KOLs of major players as well as the upcoming ones across various geographic regions. This allows us to have their view over the market scenario and acts as an important tool to come closer to the accurate market numbers. As many as 45 paid and unpaid primary interviews are taken from both the demand and supply side of the industry to make sure we land at an accurate judgement and analysis of the market.
This step involves the triangulation of data wherein our team analyses the interview transcripts, online survey responses and observation of on filed participants. The below mentioned chart should give a better understanding of the part 1 of the primary interview.

Part 2: In this part of primary research the data collected via secondary research and the part 1 of the primary research is validated with the interviews from individual consultants and subject matter experts.
Consultants are those set of people who have at least 12 years of experience and expertise within the industry whereas Subject Matter Experts are those with at least 15 years of experience behind their back within the same space. The data with the help of two main processes i.e., FGDs (Focused Group Discussions) and IDs (Individual Discussions). This gives us a 3rd party nonbiased primary view of the market scenario making it a more dependable one while collation of the data pointers.
Step 3: Data Bank Validation
Once all the information is collected via primary and secondary sources, we run that information for data validation. At our intelligence centre our research heads track a lot of information related to the market which includes the quarterly reports, the daily stock prices, and other relevant information. Our data bank server gets updated every fortnight and that is how the information which we collected using our primary and secondary information is revalidated in real time.

Step 4: QA/QC Process
After all the data collection and validation our team does a final level of quality check and quality assurance to get rid of any unwanted or undesired mistakes. This might include but not limited to getting rid of the any typos, duplication of numbers or missing of any important information. The people involved in this process include technical content writers, research heads and graphics people. Once this process is completed the title gets uploader on our platform for our clients to read it.
Step 5: Final QC/QA Process:
This is the last process and comes when the client has ordered the study. In this process a final QA/QC is done before the study is emailed to the client. Since we believe in giving our clients a good experience of our research studies, therefore, to make sure that we do not lack at our end in any way humanly possible we do a final round of quality check and then dispatch the study to the client.
Key Segments:
By Type
Lithium-ion Graphene Battery
Graphene Supercapacitor
Lithium Sulphur Graphene Battery
Others
By Application
Automotive
Consumer Electronics
Power
Industrial Robotics
Aerospace & Defense
Healthcare
Request for Segment Customization as per your Business Requirement: Segment Customization Request
Regional Coverage:
North America
US
Canada
Mexico
Europe
Eastern Europe
Poland
Romania
Hungary
Turkey
Rest of Eastern Europe
Western Europe
Germany
France
UK
Italy
Spain
Netherlands
Switzerland
Austria
Rest of Western Europe
Asia Pacific
China
India
Japan
South Korea
Vietnam
Singapore
Australia
Rest of Asia Pacific
Middle East & Africa
Middle East
UAE
Egypt
Saudi Arabia
Qatar
Rest of Middle East
Africa
Nigeria
South Africa
Rest of Africa
Latin America
Brazil
Argentina
Colombia
Rest of Latin America
Request for Country Level Research Report: Country Level Customization Request
Available Customization
With the given market data, SNS Insider offers customization as per the company’s specific needs. The following customization options are available for the report:
Detailed Volume Analysis
Criss-Cross segment analysis (e.g. Product X Application)
Competitive Product Benchmarking
Geographic Analysis
Additional countries in any of the regions
Customized Data Representation
Detailed analysis and profiling of additional market players
The Robotic Lawn Mower Market size was estimated at USD 7.76 billion in 2023 and is expected to reach USD 19.53 billion by 2032 at a CAGR of 10.8% during the forecast period of 2024-2032.
The Well Completion Equipment Market Size was estimated at USD 11.61 billion in 2023 and is expected to arrive at USD 17.84 billion by 2032 with a growing CAGR of 4.89% over the forecast period 2024-2032.
The Friction Stir Welding Equipment Market Size was valued at USD 232.50 Million in 2023 and is now anticipated to grow to USD 420.30 Million by 2032, displaying a compound annual growth rate (CAGR) of 6.8% during the forecast Period 2024-2032.
Heavy Construction Equipment Market was estimated at USD 201.92 Bn in 2023 and is expected to reach USD 313.01 Bn by 2032 at a CAGR of 4.99% from 2024-2032.
The Process Analyzer Market size was estimated at USD 6.90 billion in 2023 and is expected to reach USD 11.90 billion by 2032 at a CAGR of 5.67 % during the forecast period of 2024-2032.
The Adsorption Equipment Market Size was estimated at USD 1.05 billion in 2023 and is expected to arrive at USD 1.57 billion by 2032 with a growing CAGR of 4.57% over the forecast period 2024-2032.

Hi! Click one of our member below to chat on Phone
© 2025 All Rights Reserved by SNS Insider Pvt Ltd


