image

GPU As A Service Market Report Scope & Overview:

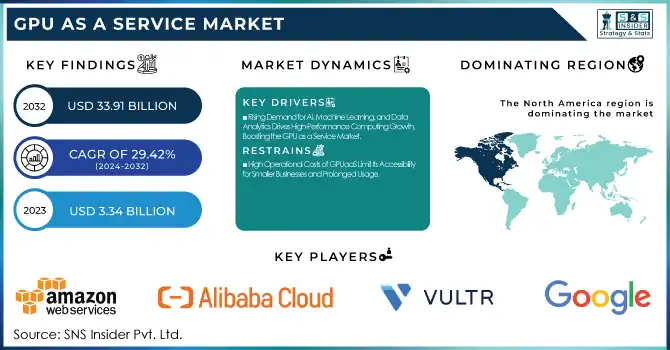
The GPU As A Service Market was valued at USD 3.34 billion in 2023 and is expected to reach USD 33.91 billion by 2032, growing at a CAGR of 29.42% from 2024-2032. This report includes key insights into adoption rates, highlighting increasing demand across industries such as AI and machine learning. It covers customer segmentation, with a focus on businesses seeking high-performance computing. Pricing trends reflect competitive models, while technological advancements in cloud infrastructure drive growth. Investment trends show a surge in funding, supporting innovation in GPU as a Service solutions, which are revolutionizing sectors like healthcare, automotive, and entertainment.

GPU As A Service Market Revenue Analysis

To get more information on GPU As A Service Market - Request Free Sample Report

GPU As A Service Market Dynamics

Drivers

  • Rising Demand for AI, Machine Learning, and Data Analytics Drives High-Performance Computing Growth, Boosting the GPU as a Service Market

The fast growth of AI, machine learning, data analytics, and scientific computing is driving the demand for stronger computational capabilities to support intricate calculations. As companies more and more depend on these technologies to extract insights and improve operations, demand for high-performance computing keeps on increasing. GPUs, which possess the capabilities of parallel processing, play a pivotal role in driving these applications, far shortening processing time and enhancing efficiency. As companies look for economical alternatives to tap into the needed computational power, GPUaaS has emerged as an important solution, allowing organizations to harness the power of GPUs on-demand, without large upfront investment in physical equipment. This increasing dependence on HPC is a major driver for the GPUaaS market.

Restraints

  • High Operational Costs of GPUaaS Limit Its Accessibility for Smaller Businesses and Prolonged Usage

Although GPU as a Service (GPUaaS) eliminates the need for businesses to invest in expensive hardware, the operational costs associated with cloud-based GPU services can still be substantial. These costs are particularly high for prolonged or intensive computational workloads, as the pricing models for GPU-powered cloud services typically depend on usage time and resource consumption. For organizations that require continuous or large-scale GPU resources, these costs can quickly accumulate, creating a financial burden. This can limit the accessibility of GPUaaS for smaller businesses or startups that have limited budgets for IT infrastructure, potentially reducing the broader adoption of this service despite its flexibility and scalability.

Opportunities

  • Increased Adoption of Edge Computing Creates Growing Demand for GPU as a Service in Real-Time Data Processing

As edge computing gains ground, the requirement for high-performance computing to carry out computations closer to the point of data creation is on the rise. The transformation creates huge demand for resources based on GPU, which will support complex computing in real time, particularly across use cases such as autonomous driving, IoT endpoints, and intelligent cities. By making available mighty GPU resources on demand, GPU as a Service presents enterprises with an agile and scalable model for utilizing edge computing. With the capability to deploy high-performance GPUs on the edge, the need for centralized data centers is eliminated, enhancing efficiency and decreasing latency. As more industries embrace edge computing to enable quicker data processing, demand for GPUaaS will increase, opening the market's full potential.

Challenges

  • High Latency and Connectivity Issues Challenge the Performance and Adoption of GPU as a Service in Time-Sensitive Applications

The dependency on internet connectivity for GPU as a Service brings the problem of high latency, which can be detrimental, especially for applications that are time-dependent like real-time gaming or artificial intelligence-based activities. Latency issues can lead to slower processing rates and less satisfying user experience, making it challenging for companies demanding instant, smooth performance. In addition, the volatility of network speeds, particularly during peak hours of usage, can slow the constant access to GPU resources. In applications such as autonomous driving simulations, financial trading, or real-time decision-making applications, even short latency impacts the system's overall effectiveness significantly, as the use of GPUaaS solutions in such mission-critical segments is de-boosted. This is an area that requires a solution for wider acceptances and long-term growth in the market.

GPU As A Service Market Segment Analysis

By Enterprise Type

Large Enterprises dominate the GPU as a Service market due to their substantial computing requirements for complex tasks like AI, machine learning, and big data analytics. These organizations can afford the high operational costs associated with GPUaaS and have the infrastructure to support large-scale, GPU-powered cloud services. Their need for robust computational power and the ability to leverage advanced technologies drives their dominant revenue share in the market.

Small and Medium-sized Enterprises (SMEs) are expected to grow at the fastest CAGR due to the increasing accessibility of cloud-based solutions. SMEs are adopting GPU as a Service to access high-performance computing resources without significant upfront costs, enabling them to scale their operations. As GPUaaS offers a cost-effective, on-demand model, SMEs can compete with larger enterprises in areas like AI, data analysis, and innovation.

By Deployment Model

The Public GPU Cloud segment dominated the GPU as a Service market due to its scalability, cost-effectiveness, and broad accessibility. Public cloud providers offer flexible pricing models, allowing businesses to pay only for the resources they use, which appeals to large enterprises and SMEs. The ability to scale computing power as needed, coupled with minimal capital investment, makes public GPU cloud services the preferred choice for organizations across various industries.

The Hybrid GPU Cloud segment is expected to grow at the fastest CAGR due to the increasing demand for a balance between public and private cloud benefits. Organizations seek hybrid models to combine the scalability of public cloud with the security and control of private cloud environments. This flexibility enables businesses to optimize costs and ensure better data management and compliance, driving the segment’s rapid growth.

By Application

The IT & Telecommunication segment dominated the GPU as a Service market due to the increasing demand for high-performance computing in networking, data centers, and telecommunications. Service providers in this sector require GPU-powered solutions for processing large datasets, supporting AI-driven applications, and managing complex network infrastructures. As telecom companies expand their 5G networks and implement AI-driven systems, GPUaaS has become an essential tool for enhancing operational efficiency.

The Healthcare segment is expected to grow at the fastest CAGR due to the increasing adoption of AI, machine learning, and big data analytics for medical research, diagnostics, and treatment planning. Healthcare organizations leverage GPU-powered cloud services for faster data processing, improved accuracy in diagnostic imaging, and the analysis of large patient datasets. As innovation in healthcare technologies expands, GPUaaS adoption accelerates, fueling rapid growth in the sector.

By Enterprise Type

Pay-per-use segment dominated the GPU as a Service market with the highest revenue share of about 69% in 2023 and is expected to grow at the fastest CAGR of about 30.20% from 2024-2032. The Pay-per-use model is popular due to its flexibility and cost-efficiency, allowing businesses to access high-performance GPU resources without significant upfront investments. This pricing structure aligns with the needs of companies that require scalable solutions for fluctuating workloads, especially small and medium-sized enterprises (SMEs) that have limited capital. The growth is driven by increasing demand for on-demand computing in AI, data analytics, and real-time processing applications. The ability to scale resources dynamically based on real-time requirements, coupled with the shift toward cloud adoption, is propelling the growth of this segment.

Regional Analysis

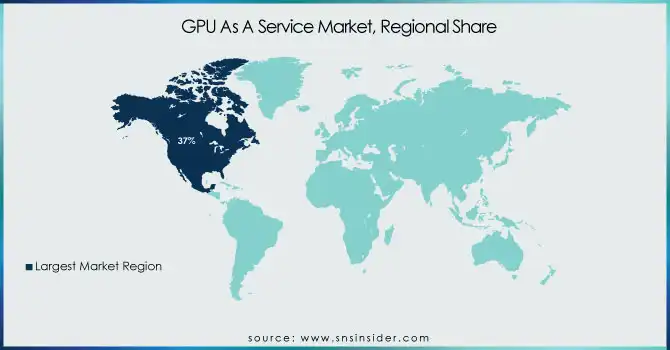
North America dominated the GPU as a Service market with a 37% revenue share in 2023 due to the region's strong presence in advanced technological sectors like AI, machine learning, and data analytics. The high adoption of cloud computing and strong infrastructure investments, especially in industries such as IT, telecommunications, and healthcare, further contributed to this dominance. Leading tech companies in the U.S. and Canada drive innovation in GPU-powered services, making North America a key market player.

Asia Pacific is expected to grow at the fastest CAGR of about 31.16% from 2024-2032 due to rapid technological advancements and increasing digital transformation in industries like healthcare, automotive, and manufacturing. The region’s growing adoption of AI, IoT, and 5G technologies, along with rising demand for high-performance computing, drives the need for GPUaaS. Additionally, government initiatives supporting technology innovation are contributing to the fast-paced growth in this region.

GPU-As-A-Service-Market-Regional-Share

Get Customized Report as per Your Business Requirement - Enquiry Now

Key Players

  • Alibaba Cloud (Elastic GPU, ECS GPU-optimized instances)

  • Vultr (GPU Compute Instances, Cloud GPU)

  • Linode LLC. (Linode GPU, GPU-Optimized Plans)

  • Amazon Web Services, Inc. (Elastic GPU, EC2 P3 Instances)

  • Google (Google Cloud GPU, Tensor Processing Units)

  • IBM Corporation (IBM Cloud GPU, Virtual Servers with GPU)

  • OVH SAS (GPU Cloud Instances, GPU Dedicated Servers)

  • Lambda Labs (Lambda GPU Cloud, Lambda GPU Workstations)

  • Hewlett Packard Enterprise Development LP (HPE GreenLake with GPU, HPE Cloud GPU Servers)

  • CoreWeave (GPU Cloud, Virtual GPUs)

  • Arm Holding PLC (Arm-based GPUs, Arm Compute Instances)

  • Fujitsu Ltd (Fujitsu Cloud GPU, Cloud Service with GPU)

  • HCL Technologies (HCL Cloud GPU, GPU-Optimized Virtual Machines)

  • Intel Corporation (Intel GPU Cloud Service, Xe Graphics Cloud Service)

  • Microsoft Corporation (Azure N-Series, GPU Virtual Machines)

  • NVIDIA Corporation (NVIDIA DGX, NVIDIA A100 GPU Cloud Instances)

  • Oracle Corporation (Oracle Cloud GPU, Virtual Machine GPU)

  • Qualcomm Technologies, Inc. (Snapdragon GPUs, Cloud AI Solutions)

  • Tencent Cloud (Tencent Cloud GPU, GPU Cloud Instances)

  • Huawei Cloud (Huawei Cloud GPU, Cloud GPU Servers)

  • Baidu AI Cloud (Baidu Cloud GPU, Cloud Computing with GPU)

  • Packet (Packet GPU, High-Performance GPU Instances)

  • DigitalOcean (DigitalOcean GPU, Cloud GPU Instances)

  • Rackspace (Rackspace GPU Cloud, GPU-Optimized Servers)

  • Scaleway (Scaleway GPU, Cloud GPU Instances)

  • Hetzner Online (Hetzner GPU Cloud, GPU Servers)

Recent Developments:

  • In October 2024, Vultr introduced its GPU Stack and Container Registry, providing easy access to NVIDIA's NGC catalog of pre-trained large language models. This launch aims to accelerate AI and GPU-driven applications.

  • In January 2025, Qualcomm's Snapdragon X Series pushed the boundaries of the PC category with enhanced GPU performance, mini desktop designs, and NPU-powered AI capabilities.

GPU As A Service Market Report Scope:

Report Attributes Details
Market Size in 2023 USD 3.34 Billion
Market Size by 2032 USD 33.91 Billion
CAGR CAGR of 29.42% From 2024 to 2032
Base Year 2023
Forecast Period 2024-2032
Historical Data 2020-2022
Report Scope & Coverage Market Size, Segments Analysis, Competitive  Landscape, Regional Analysis, DROC & SWOT Analysis, Forecast Outlook
Key Segments • By Pricing Model (Pay-per-use, Subscription-based Plans)
• By Deployment Model (Private GPU Cloud, Public GPU Cloud, Hybrid GPU Cloud)
• By Enterprise Type (Small and Medium-sized Enterprises, Large Enterprises)
• By Application (Healthcare, BFSI, Manufacturing, IT & Telecommunication, Automotive, Others)
Regional Analysis/Coverage North America (US, Canada, Mexico), Europe (Eastern Europe [Poland, Romania, Hungary, Turkey, Rest of Eastern Europe] Western Europe] Germany, France, UK, Italy, Spain, Netherlands, Switzerland, Austria, Rest of Western Europe]), Asia Pacific (China, India, Japan, South Korea, Vietnam, Singapore, Australia, Rest of Asia Pacific), Middle East & Africa (Middle East [UAE, Egypt, Saudi Arabia, Qatar, Rest of Middle East], Africa [Nigeria, South Africa, Rest of Africa], Latin America (Brazil, Argentina, Colombia, Rest of Latin America)
Company Profiles Alibaba Cloud, Vultr, Linode LLC., Amazon Web Services, Inc., Google, IBM Corporation, OVH SAS, Lambda Labs, Hewlett Packard Enterprise Development LP, CoreWeave, Arm Holding PLC, Fujitsu Ltd, HCL Technologies, Intel Corporation, Microsoft Corporation, NVIDIA Corporation, Oracle Corporation, Qualcomm Technologies, Inc., Tencent Cloud, Huawei Cloud, Baidu AI Cloud, Packet, DigitalOcean, Rackspace, Scaleway, Hetzner Online

Frequently Asked Questions

ANS: GPU As A Service Market was valued at USD 3.34 billion in 2023 and is expected to reach USD 33.91 billion by 2032, growing at a CAGR of 29.42% from 2024-2032

ANS: The Hybrid GPU Cloud segment is expected to grow at the fastest CAGR of 31.16% from 2024-2032.

ANS: The Pay-per-use model holds about 69% of the revenue share in 2023 and is expected to grow at a CAGR of 30.20%.

ANS: North America dominates the market with a 37% revenue share in 2023.

ANS: Small and Medium-sized Enterprises (SMEs) are growing at the fastest CAGR due to the increasing accessibility of cloud-based solutions.

Table of Contents

1. Introduction

1.1 Market Definition

1.2 Scope (Inclusion and Exclusions)

1.3 Research Assumptions

2. Executive Summary

2.1 Market Overview

2.2 Regional Synopsis

2.3 Competitive Summary

3. Research Methodology

3.1 Top-Down Approach

3.2 Bottom-up Approach

3.3. Data Validation

3.4 Primary Interviews

4. Market Dynamics Impact Analysis

4.1 Market Driving Factors Analysis

4.1.1 Drivers

4.1.2 Restraints

4.1.3 Opportunities

4.1.4 Challenges

4.2 PESTLE Analysis

4.3 Porter’s Five Forces Model

5. Statistical Insights and Trends Reporting

5.1 Adoption Rates

5.2 Customer Segmentation

5.3 Pricing Trends

5.4 Technological Advancements

5.5 Investment Trends

6. Competitive Landscape

6.1 List of Major Companies, By Region

6.2 Market Share Analysis, By Region

6.3 Product Benchmarking

6.3.1 Product specifications and features

6.3.2 Pricing

6.4 Strategic Initiatives

6.4.1 Marketing and promotional activities

6.4.2 Distribution and supply chain strategies

6.4.3 Expansion plans and new product launches

6.4.4 Strategic partnerships and collaborations

6.5 Technological Advancements

6.6 Market Positioning and Branding

7. GPU As A Service Market Segmentation, by Type

7.1 Chapter Overview

7.2 Pay-per-use

7.2.1 Pay-per-use Market Trends Analysis (2020-2032)

7.2.2 Pay-per-use Market Size Estimates and Forecasts to 2032 (USD Billion)

7.3 Subscription-based Plans

7.3.1 Subscription-based Plans Market Trends Analysis (2020-2032)

7.3.2 Subscription-based Plans Market Size Estimates and Forecasts to 2032 (USD Billion)

8. GPU As A Service Market Segmentation, By Application

8.1 Chapter Overview

8.2 Healthcare

8.2.1 Healthcare Market Trends Analysis (2020-2032)

8.2.2 Healthcare Market Size Estimates and Forecasts to 2032 (USD Billion)

8.3 BFSI

8.3.1 BFSI Market Trends Analysis (2020-2032)

8.3.2 BFSI Market Size Estimates and Forecasts to 2032 (USD Billion)

8.4 Manufacturing

8.4.1 Manufacturing Market Trends Analysis (2020-2032)

8.4.2 Manufacturing Market Size Estimates and Forecasts to 2032 (USD Billion)

8.5 IT & Telecommunication

8.5.1 IT & Telecommunication Market Trends Analysis (2020-2032)

8.5.2 IT & Telecommunication Market Size Estimates and Forecasts to 2032 (USD Billion)

8.6 Automotive

8.6.1 Automotive Market Trends Analysis (2020-2032)

8.6.2 Automotive Market Size Estimates and Forecasts to 2032 (USD Billion)

8.7 Others

8.7.1 Others Market Trends Analysis (2020-2032)

8.7.2 Others Market Size Estimates and Forecasts to 2032 (USD Billion)

9. GPU As A Service Market Segmentation, By Deployment Model

9.1 Chapter Overview

9.2 Private GPU Cloud

9.2.1 Private GPU Cloud Market Trends Analysis (2020-2032)

9.2.2 Private GPU Cloud Market Size Estimates and Forecasts to 2032 (USD Billion)

9.3 Public GPU Cloud

9.3.1 Public GPU Cloud Market Trends Analysis (2020-2032)

9.3.2 Public GPU Cloud Market Size Estimates and Forecasts to 2032 (USD Billion)

9.4 Hybrid GPU Cloud

               9.4.1 Hybrid GPU Cloud Market Trends Analysis (2020-2032)

9.4.2 Hybrid GPU Cloud Market Size Estimates and Forecasts to 2032 (USD Billion)

10. GPU As A Service Market Segmentation, By Enterprise Type

10.1 Chapter Overview

10.2 Small and Medium-sized Enterprises

10.2.1 Small and Medium-sized Enterprises Market Trends Analysis (2020-2032)

10.2.2 Small and Medium-sized Enterprises Market Size Estimates and Forecasts to 2032 (USD Billion)

10.3 Large Enterprises

10.3.1 Large Enterprises Market Trends Analysis (2020-2032)

10.3.2 Large Enterprises Market Size Estimates and Forecasts to 2032 (USD Billion)

11. Regional Analysis

11.1 Chapter Overview

11.2 North America

11.2.1 Trends Analysis

11.2.2 North America GPU As A Service Market Estimates and Forecasts, by Country (2020-2032) (USD Billion)

11.2.3 North America GPU As A Service Market Estimates and Forecasts, by Type (2020-2032) (USD Billion) 

11.2.4 North America GPU As A Service Market Estimates and Forecasts, By Application (2020-2032) (USD Billion)

11.2.5 North America GPU As A Service Market Estimates and Forecasts, By Deployment Model (2020-2032) (USD Billion)

11.2.6 North America GPU As A Service Market Estimates and Forecasts, By Enterprise Type (2020-2032) (USD Billion)

11.2.7 USA

11.2.7.1 USA GPU As A Service Market Estimates and Forecasts, by Type (2020-2032) (USD Billion)

11.2.7.2 USA GPU As A Service Market Estimates and Forecasts, By Application (2020-2032) (USD Billion)

11.2.7.3 USA GPU As A Service Market Estimates and Forecasts, By Deployment Model (2020-2032) (USD Billion)

11.2.7.4 USA GPU As A Service Market Estimates and Forecasts, By Enterprise Type (2020-2032) (USD Billion)

11.2.8 Canada

11.2.8.1 Canada GPU As A Service Market Estimates and Forecasts, by Type (2020-2032) (USD Billion)

11.2.8.2 Canada GPU As A Service Market Estimates and Forecasts, By Application (2020-2032) (USD Billion)

11.2.8.3 Canada GPU As A Service Market Estimates and Forecasts, By Deployment Model (2020-2032) (USD Billion)

11.2.8.4 Canada GPU As A Service Market Estimates and Forecasts, By Enterprise Type (2020-2032) (USD Billion)

11.2.9 Mexico

11.2.9.1 Mexico GPU As A Service Market Estimates and Forecasts, by Type (2020-2032) (USD Billion)

11.2.9.2 Mexico GPU As A Service Market Estimates and Forecasts, By Application (2020-2032) (USD Billion)

11.2.9.3 Mexico GPU As A Service Market Estimates and Forecasts, By Deployment Model (2020-2032) (USD Billion)

11.2.9.4 Mexico GPU As A Service Market Estimates and Forecasts, By Enterprise Type (2020-2032) (USD Billion)

11.3 Europe

11.3.1 Eastern Europe

11.3.1.1 Trends Analysis

11.3.1.2 Eastern Europe GPU As A Service Market Estimates and Forecasts, by Country (2020-2032) (USD Billion)

11.3.1.3 Eastern Europe GPU As A Service Market Estimates and Forecasts, by Type (2020-2032) (USD Billion) 

11.3.1.4 Eastern Europe GPU As A Service Market Estimates and Forecasts, By Application (2020-2032) (USD Billion)

11.3.1.5 Eastern Europe GPU As A Service Market Estimates and Forecasts, By Deployment Model (2020-2032) (USD Billion)

11.3.1.6 Eastern Europe GPU As A Service Market Estimates and Forecasts, By Enterprise Type (2020-2032) (USD Billion)

11.3.1.7 Poland

11.3.1.7.1 Poland GPU As A Service Market Estimates and Forecasts, by Type (2020-2032) (USD Billion)

11.3.1.7.2 Poland GPU As A Service Market Estimates and Forecasts, By Application (2020-2032) (USD Billion)

11.3.1.7.3 Poland GPU As A Service Market Estimates and Forecasts, By Deployment Model (2020-2032) (USD Billion)

11.3.1.7.4 Poland GPU As A Service Market Estimates and Forecasts, By Enterprise Type (2020-2032) (USD Billion)

11.3.1.8 Romania

11.3.1.8.1 Romania GPU As A Service Market Estimates and Forecasts, by Type (2020-2032) (USD Billion)

11.3.1.8.2 Romania GPU As A Service Market Estimates and Forecasts, By Application (2020-2032) (USD Billion)

11.3.1.8.3 Romania GPU As A Service Market Estimates and Forecasts, By Deployment Model (2020-2032) (USD Billion)

11.3.1.8.4 Romania GPU As A Service Market Estimates and Forecasts, By Enterprise Type (2020-2032) (USD Billion)

11.3.1.9 Hungary

11.3.1.9.1 Hungary GPU As A Service Market Estimates and Forecasts, by Type (2020-2032) (USD Billion)

11.3.1.9.2 Hungary GPU As A Service Market Estimates and Forecasts, By Application (2020-2032) (USD Billion)

11.3.1.9.3 Hungary GPU As A Service Market Estimates and Forecasts, By Deployment Model (2020-2032) (USD Billion)

11.3.1.9.4 Hungary GPU As A Service Market Estimates and Forecasts, By Enterprise Type (2020-2032) (USD Billion)

11.3.1.10 Turkey

11.3.1.10.1 Turkey GPU As A Service Market Estimates and Forecasts, by Type (2020-2032) (USD Billion)

11.3.1.10.2 Turkey GPU As A Service Market Estimates and Forecasts, By Application (2020-2032) (USD Billion)

11.3.1.10.3 Turkey GPU As A Service Market Estimates and Forecasts, By Deployment Model (2020-2032) (USD Billion)

11.3.1.10.4 Turkey GPU As A Service Market Estimates and Forecasts, By Enterprise Type (2020-2032) (USD Billion)

11.3.1.11 Rest of Eastern Europe

11.3.1.11.1 Rest of Eastern Europe GPU As A Service Market Estimates and Forecasts, by Type (2020-2032) (USD Billion)

11.3.1.11.2 Rest of Eastern Europe GPU As A Service Market Estimates and Forecasts, By Application (2020-2032) (USD Billion)

11.3.1.11.3 Rest of Eastern Europe GPU As A Service Market Estimates and Forecasts, By Deployment Model (2020-2032) (USD Billion)

11.3.1.11.4 Rest of Eastern Europe GPU As A Service Market Estimates and Forecasts, By Enterprise Type (2020-2032) (USD Billion)

11.3.2 Western Europe

11.3.2.1 Trends Analysis

11.3.2.2 Western Europe GPU As A Service Market Estimates and Forecasts, by Country (2020-2032) (USD Billion)

11.3.2.3 Western Europe GPU As A Service Market Estimates and Forecasts, by Type (2020-2032) (USD Billion) 

11.3.2.4 Western Europe GPU As A Service Market Estimates and Forecasts, By Application (2020-2032) (USD Billion)

11.3.2.5 Western Europe GPU As A Service Market Estimates and Forecasts, By Deployment Model (2020-2032) (USD Billion)

11.3.2.6 Western Europe GPU As A Service Market Estimates and Forecasts, By Enterprise Type (2020-2032) (USD Billion)

11.3.2.7 Germany

11.3.2.7.1 Germany GPU As A Service Market Estimates and Forecasts, by Type (2020-2032) (USD Billion)

11.3.2.7.2 Germany GPU As A Service Market Estimates and Forecasts, By Application (2020-2032) (USD Billion)

11.3.2.7.3 Germany GPU As A Service Market Estimates and Forecasts, By Deployment Model (2020-2032) (USD Billion)

11.3.2.7.4 Germany GPU As A Service Market Estimates and Forecasts, By Enterprise Type (2020-2032) (USD Billion)

11.3.2.8 France

11.3.2.8.1 France GPU As A Service Market Estimates and Forecasts, by Type (2020-2032) (USD Billion)

11.3.2.8.2 France GPU As A Service Market Estimates and Forecasts, By Application (2020-2032) (USD Billion)

11.3.2.8.3 France GPU As A Service Market Estimates and Forecasts, By Deployment Model (2020-2032) (USD Billion)

11.3.2.8.4 France GPU As A Service Market Estimates and Forecasts, By Enterprise Type (2020-2032) (USD Billion)

11.3.2.9 UK

11.3.2.9.1 UK GPU As A Service Market Estimates and Forecasts, by Type (2020-2032) (USD Billion)

11.3.2.9.2 UK GPU As A Service Market Estimates and Forecasts, By Application (2020-2032) (USD Billion)

11.3.2.9.3 UK GPU As A Service Market Estimates and Forecasts, By Deployment Model (2020-2032) (USD Billion)

11.3.2.9.4 UK GPU As A Service Market Estimates and Forecasts, By Enterprise Type (2020-2032) (USD Billion)

11.3.2.10 Italy

11.3.2.10.1 Italy GPU As A Service Market Estimates and Forecasts, by Type (2020-2032) (USD Billion)

11.3.2.10.2 Italy GPU As A Service Market Estimates and Forecasts, By Application (2020-2032) (USD Billion)

11.3.2.10.3 Italy GPU As A Service Market Estimates and Forecasts, By Deployment Model (2020-2032) (USD Billion)

11.3.2.10.4 Italy GPU As A Service Market Estimates and Forecasts, By Enterprise Type (2020-2032) (USD Billion)

11.3.2.11 Spain

11.3.2.11.1 Spain GPU As A Service Market Estimates and Forecasts, by Type (2020-2032) (USD Billion)

11.3.2.11.2 Spain GPU As A Service Market Estimates and Forecasts, By Application (2020-2032) (USD Billion)

11.3.2.11.3 Spain GPU As A Service Market Estimates and Forecasts, By Deployment Model (2020-2032) (USD Billion)

11.3.2.11.4 Spain GPU As A Service Market Estimates and Forecasts, By Enterprise Type (2020-2032) (USD Billion)

11.3.2.12 Netherlands

11.3.2.12.1 Netherlands GPU As A Service Market Estimates and Forecasts, by Type (2020-2032) (USD Billion)

11.3.2.12.2 Netherlands GPU As A Service Market Estimates and Forecasts, By Application (2020-2032) (USD Billion)

11.3.2.12.3 Netherlands GPU As A Service Market Estimates and Forecasts, By Deployment Model (2020-2032) (USD Billion)

11.3.2.12.4 Netherlands GPU As A Service Market Estimates and Forecasts, By Enterprise Type (2020-2032) (USD Billion)

11.3.2.13 Switzerland

11.3.2.13.1 Switzerland GPU As A Service Market Estimates and Forecasts, by Type (2020-2032) (USD Billion)

11.3.2.13.2 Switzerland GPU As A Service Market Estimates and Forecasts, By Application (2020-2032) (USD Billion)

11.3.2.13.3 Switzerland GPU As A Service Market Estimates and Forecasts, By Deployment Model (2020-2032) (USD Billion)

11.3.2.13.4 Switzerland GPU As A Service Market Estimates and Forecasts, By Enterprise Type (2020-2032) (USD Billion)

11.3.2.14 Austria

11.3.2.14.1 Austria GPU As A Service Market Estimates and Forecasts, by Type (2020-2032) (USD Billion)

11.3.2.14.2 Austria GPU As A Service Market Estimates and Forecasts, By Application (2020-2032) (USD Billion)

11.3.2.14.3 Austria GPU As A Service Market Estimates and Forecasts, By Deployment Model (2020-2032) (USD Billion)

11.3.2.14.4 Austria GPU As A Service Market Estimates and Forecasts, By Enterprise Type (2020-2032) (USD Billion)

11.3.2.15 Rest of Western Europe

11.3.2.15.1 Rest of Western Europe GPU As A Service Market Estimates and Forecasts, by Type (2020-2032) (USD Billion)

11.3.2.15.2 Rest of Western Europe GPU As A Service Market Estimates and Forecasts, By Application (2020-2032) (USD Billion)

11.3.2.15.3 Rest of Western Europe GPU As A Service Market Estimates and Forecasts, By Deployment Model (2020-2032) (USD Billion)

11.3.2.15.4 Rest of Western Europe GPU As A Service Market Estimates and Forecasts, By Enterprise Type (2020-2032) (USD Billion)

11.4 Asia Pacific

11.4.1 Trends Analysis

11.4.2 Asia Pacific GPU As A Service Market Estimates and Forecasts, by Country (2020-2032) (USD Billion)

11.4.3 Asia Pacific GPU As A Service Market Estimates and Forecasts, by Type (2020-2032) (USD Billion) 

11.4.4 Asia Pacific GPU As A Service Market Estimates and Forecasts, By Application (2020-2032) (USD Billion)

11.4.5 Asia Pacific GPU As A Service Market Estimates and Forecasts, By Deployment Model (2020-2032) (USD Billion)

11.4.6 Asia Pacific GPU As A Service Market Estimates and Forecasts, By Enterprise Type (2020-2032) (USD Billion)

11.4.7 China

11.4.7.1 China GPU As A Service Market Estimates and Forecasts, by Type (2020-2032) (USD Billion)

11.4.7.2 China GPU As A Service Market Estimates and Forecasts, By Application (2020-2032) (USD Billion)

11.4.7.3 China GPU As A Service Market Estimates and Forecasts, By Deployment Model (2020-2032) (USD Billion)

11.4.7.4 China GPU As A Service Market Estimates and Forecasts, By Enterprise Type (2020-2032) (USD Billion)

11.4.8 India

11.4.8.1 India GPU As A Service Market Estimates and Forecasts, by Type (2020-2032) (USD Billion)

11.4.8.2 India GPU As A Service Market Estimates and Forecasts, By Application (2020-2032) (USD Billion)

11.4.8.3 India GPU As A Service Market Estimates and Forecasts, By Deployment Model (2020-2032) (USD Billion)

11.4.8.4 India GPU As A Service Market Estimates and Forecasts, By Enterprise Type (2020-2032) (USD Billion)

11.4.9 Japan

11.4.9.1 Japan GPU As A Service Market Estimates and Forecasts, by Type (2020-2032) (USD Billion)

11.4.9.2 Japan GPU As A Service Market Estimates and Forecasts, By Application (2020-2032) (USD Billion)

11.4.9.3 Japan GPU As A Service Market Estimates and Forecasts, By Deployment Model (2020-2032) (USD Billion)

11.4.9.4 Japan GPU As A Service Market Estimates and Forecasts, By Enterprise Type (2020-2032) (USD Billion)

11.4.10 South Korea

11.4.10.1 South Korea GPU As A Service Market Estimates and Forecasts, by Type (2020-2032) (USD Billion)

11.4.10.2 South Korea GPU As A Service Market Estimates and Forecasts, By Application (2020-2032) (USD Billion)

11.4.10.3 South Korea GPU As A Service Market Estimates and Forecasts, By Deployment Model (2020-2032) (USD Billion)

11.4.10.4 South Korea GPU As A Service Market Estimates and Forecasts, By Enterprise Type (2020-2032) (USD Billion)

11.4.11 Vietnam

11.4.11.1 Vietnam GPU As A Service Market Estimates and Forecasts, by Type (2020-2032) (USD Billion)

11.4.11.2 Vietnam GPU As A Service Market Estimates and Forecasts, By Application (2020-2032) (USD Billion)

11.4.11.3 Vietnam GPU As A Service Market Estimates and Forecasts, By Deployment Model (2020-2032) (USD Billion)

11.4.11.4 Vietnam GPU As A Service Market Estimates and Forecasts, By Enterprise Type (2020-2032) (USD Billion)

11.4.12 Singapore

11.4.12.1 Singapore GPU As A Service Market Estimates and Forecasts, by Type (2020-2032) (USD Billion)

11.4.12.2 Singapore GPU As A Service Market Estimates and Forecasts, By Application (2020-2032) (USD Billion)

11.4.12.3 Singapore GPU As A Service Market Estimates and Forecasts, By Deployment Model (2020-2032) (USD Billion)

11.4.12.4 Singapore GPU As A Service Market Estimates and Forecasts, By Enterprise Type (2020-2032) (USD Billion)

11.4.13 Australia

11.4.13.1 Australia GPU As A Service Market Estimates and Forecasts, by Type (2020-2032) (USD Billion)

11.4.13.2 Australia GPU As A Service Market Estimates and Forecasts, By Application (2020-2032) (USD Billion)

11.4.13.3 Australia GPU As A Service Market Estimates and Forecasts, By Deployment Model (2020-2032) (USD Billion)

11.4.13.4 Australia GPU As A Service Market Estimates and Forecasts, By Enterprise Type (2020-2032) (USD Billion)

11.4.14 Rest of Asia Pacific

11.4.14.1 Rest of Asia Pacific GPU As A Service Market Estimates and Forecasts, by Type (2020-2032) (USD Billion)

11.4.14.2 Rest of Asia Pacific GPU As A Service Market Estimates and Forecasts, By Application (2020-2032) (USD Billion)

11.4.14.3 Rest of Asia Pacific GPU As A Service Market Estimates and Forecasts, By Deployment Model (2020-2032) (USD Billion)

11.4.14.4 Rest of Asia Pacific GPU As A Service Market Estimates and Forecasts, By Enterprise Type (2020-2032) (USD Billion)

11.5 Middle East and Africa

11.5.1 Middle East

11.5.1.1 Trends Analysis

11.5.1.2 Middle East GPU As A Service Market Estimates and Forecasts, by Country (2020-2032) (USD Billion)

11.5.1.3 Middle East GPU As A Service Market Estimates and Forecasts, by Type (2020-2032) (USD Billion) 

11.5.1.4 Middle East GPU As A Service Market Estimates and Forecasts, By Application (2020-2032) (USD Billion)

11.5.1.5 Middle East GPU As A Service Market Estimates and Forecasts, By Deployment Model (2020-2032) (USD Billion)

11.5.1.6 Middle East GPU As A Service Market Estimates and Forecasts, By Enterprise Type (2020-2032) (USD Billion)

11.5.1.7 UAE

11.5.1.7.1 UAE GPU As A Service Market Estimates and Forecasts, by Type (2020-2032) (USD Billion)

11.5.1.7.2 UAE GPU As A Service Market Estimates and Forecasts, By Application (2020-2032) (USD Billion)

11.5.1.7.3 UAE GPU As A Service Market Estimates and Forecasts, By Deployment Model (2020-2032) (USD Billion)

11.5.1.7.4 UAE GPU As A Service Market Estimates and Forecasts, By Enterprise Type  (2020-2032) (USD Billion)

11.5.1.8 Egypt

11.5.1.8.1 Egypt GPU As A Service Market Estimates and Forecasts, by Type (2020-2032) (USD Billion)

11.5.1.8.2 Egypt GPU As A Service Market Estimates and Forecasts, By Application (2020-2032) (USD Billion)

11.5.1.8.3 Egypt GPU As A Service Market Estimates and Forecasts, By Deployment Model (2020-2032) (USD Billion)

11.5.1.8.4 Egypt GPU As A Service Market Estimates and Forecasts, By Enterprise Type (2020-2032) (USD Billion)

11.5.1.9 Saudi Arabia

11.5.1.9.1 Saudi Arabia GPU As A Service Market Estimates and Forecasts, by Type (2020-2032) (USD Billion)

11.5.1.9.2 Saudi Arabia GPU As A Service Market Estimates and Forecasts, By Application (2020-2032) (USD Billion)

11.5.1.9.3 Saudi Arabia GPU As A Service Market Estimates and Forecasts, By Deployment Model (2020-2032) (USD Billion)

11.5.1.9.4 Saudi Arabia GPU As A Service Market Estimates and Forecasts, By Enterprise Type (2020-2032) (USD Billion)

11.5.1.10 Qatar

11.5.1.10.1 Qatar GPU As A Service Market Estimates and Forecasts, by Type (2020-2032) (USD Billion)

11.5.1.10.2 Qatar GPU As A Service Market Estimates and Forecasts, By Application (2020-2032) (USD Billion)

11.5.1.10.3 Qatar GPU As A Service Market Estimates and Forecasts, By Deployment Model (2020-2032) (USD Billion)

11.5.1.10.4 Qatar GPU As A Service Market Estimates and Forecasts, By Enterprise Type (2020-2032) (USD Billion)

11.5.1.11 Rest of Middle East

11.5.1.11.1 Rest of Middle East GPU As A Service Market Estimates and Forecasts, by Type (2020-2032) (USD Billion)

11.5.1.11.2 Rest of Middle East GPU As A Service Market Estimates and Forecasts, By Application (2020-2032) (USD Billion)

11.5.1.11.3 Rest of Middle East GPU As A Service Market Estimates and Forecasts, By Deployment Model (2020-2032) (USD Billion)

11.5.1.11.4 Rest of Middle East GPU As A Service Market Estimates and Forecasts, By Enterprise Type (2020-2032) (USD Billion)

11.5.2 Africa

11.5.2.1 Trends Analysis

11.5.2.2 Africa GPU As A Service Market Estimates and Forecasts, by Country (2020-2032) (USD Billion)

11.5.2.3 Africa GPU As A Service Market Estimates and Forecasts, by Type (2020-2032) (USD Billion) 

11.5.2.4 Africa GPU As A Service Market Estimates and Forecasts, By Application (2020-2032) (USD Billion)

11.5.2.5 Africa GPU As A Service Market Estimates and Forecasts, By Deployment Model (2020-2032) (USD Billion)

11.5.2.6 Africa GPU As A Service Market Estimates and Forecasts, By Enterprise Type (2020-2032) (USD Billion)

11.5.2.7 South Africa

11.5.2.7.1 South Africa GPU As A Service Market Estimates and Forecasts, by Type (2020-2032) (USD Billion)

11.5.2.7.2 South Africa GPU As A Service Market Estimates and Forecasts, By Application (2020-2032) (USD Billion)

11.5.2.7.3 South Africa GPU As A Service Market Estimates and Forecasts, By Deployment Model (2020-2032) (USD Billion)

11.5.2.7.4 South Africa GPU As A Service Market Estimates and Forecasts, By Enterprise Type (2020-2032) (USD Billion)

11.5.2.8 Nigeria

11.5.2.8.1 Nigeria GPU As A Service Market Estimates and Forecasts, by Type (2020-2032) (USD Billion)

11.5.2.8.2 Nigeria GPU As A Service Market Estimates and Forecasts, By Application (2020-2032) (USD Billion)

11.5.2.8.3 Nigeria GPU As A Service Market Estimates and Forecasts, By Deployment Model (2020-2032) (USD Billion)

11.5.2.8.4 Nigeria GPU As A Service Market Estimates and Forecasts, By Enterprise Type (2020-2032) (USD Billion)

11.5.2.9 Rest of Africa

11.5.2.9.1 Rest of Africa GPU As A Service Market Estimates and Forecasts, by Type (2020-2032) (USD Billion)

11.5.2.9.2 Rest of Africa GPU As A Service Market Estimates and Forecasts, By Application (2020-2032) (USD Billion)

11.5.2.9.3 Rest of Africa GPU As A Service Market Estimates and Forecasts, By Deployment Model (2020-2032) (USD Billion)

11.5.2.9.4 Rest of Africa GPU As A Service Market Estimates and Forecasts, By Enterprise Type (2020-2032) (USD Billion)

11.6 Latin America

11.6.1 Trends Analysis

11.6.2 Latin America GPU As A Service Market Estimates and Forecasts, by Country (2020-2032) (USD Billion)

11.6.3 Latin America GPU As A Service Market Estimates and Forecasts, by Type (2020-2032) (USD Billion) 

11.6.4 Latin America GPU As A Service Market Estimates and Forecasts, By Application (2020-2032) (USD Billion)

11.6.5 Latin America GPU As A Service Market Estimates and Forecasts, By Deployment Model (2020-2032) (USD Billion)

11.6.6 Latin America GPU As A Service Market Estimates and Forecasts, By Enterprise Type (2020-2032) (USD Billion)

11.6.7 Brazil

11.6.7.1 Brazil GPU As A Service Market Estimates and Forecasts, by Type (2020-2032) (USD Billion)

11.6.7.2 Brazil GPU As A Service Market Estimates and Forecasts, By Application (2020-2032) (USD Billion)

11.6.7.3 Brazil GPU As A Service Market Estimates and Forecasts, By Deployment Model (2020-2032) (USD Billion)

11.6.7.4 Brazil GPU As A Service Market Estimates and Forecasts, By Enterprise Type (2020-2032) (USD Billion)

11.6.8 Argentina

11.6.8.1 Argentina GPU As A Service Market Estimates and Forecasts, by Type (2020-2032) (USD Billion)

11.6.8.2 Argentina GPU As A Service Market Estimates and Forecasts, By Application (2020-2032) (USD Billion)

11.6.8.3 Argentina GPU As A Service Market Estimates and Forecasts, By Deployment Model (2020-2032) (USD Billion)

11.6.8.4 Argentina GPU As A Service Market Estimates and Forecasts, By Enterprise Type (2020-2032) (USD Billion)

11.6.9 Colombia

11.6.9.1 Colombia GPU As A Service Market Estimates and Forecasts, by Type (2020-2032) (USD Billion)

11.6.9.2 Colombia GPU As A Service Market Estimates and Forecasts, By Application (2020-2032) (USD Billion)

11.6.9.3 Colombia GPU As A Service Market Estimates and Forecasts, By Deployment Model (2020-2032) (USD Billion)

11.6.9.4 Colombia GPU As A Service Market Estimates and Forecasts, By Enterprise Type (2020-2032) (USD Billion)

11.6.10 Rest of Latin America

11.6.10.1 Rest of Latin America GPU As A Service Market Estimates and Forecasts, by Type (2020-2032) (USD Billion)

11.6.10.2 Rest of Latin America GPU As A Service Market Estimates and Forecasts, By Application (2020-2032) (USD Billion)

11.6.10.3 Rest of Latin America GPU As A Service Market Estimates and Forecasts, By Deployment Model (2020-2032) (USD Billion)

11.6.10.4 Rest of Latin America GPU As A Service Market Estimates and Forecasts, By Enterprise Type (2020-2032) (USD Billion)

12. Company Profiles

12.1 Alibaba Cloud

12.1.1 Company Overview

12.1.2 Financial

12.1.3 Products/ Services Offered

12.1.4 SWOT Analysis

12.2 Vultr

12.2.1 Company Overview

12.2.2 Financial

12.2.3 Products/ Services Offered

12.2.4 SWOT Analysis

12.3 Linode LLC.

12.3.1 Company Overview

12.3.2 Financial

12.3.3 Products/ Services Offered

12.3.4 SWOT Analysis

12.4 Amazon Web Services, Inc.

12.4.1 Company Overview

12.4.2 Financial

12.4.3 Products/ Services Offered

12.4.4 SWOT Analysis

12.5 Google

12.5.1 Company Overview

12.5.2 Financial

12.5.3 Products/ Services Offered

12.5.4 SWOT Analysis

12.6 IBM Corporation

12.6.1 Company Overview

12.6.2 Financial

12.6.3 Products/ Services Offered

12.6.4 SWOT Analysis

12.7 OVH SAS

12.7.1 Company Overview

12.7.2 Financial

12.7.3 Products/ Services Offered

12.7.4 SWOT Analysis

12.8 Lambda Labs

12.8.1 Company Overview

12.8.2 Financial

12.8.3 Products/ Services Offered

12.8.4 SWOT Analysis

12.9 Hewlett Packard Enterprise Development LP

12.9.1 Company Overview

12.9.2 Financial

12.9.3 Products/ Services Offered

12.9.4 SWOT Analysis

12.10 CoreWeave

12.10.1 Company Overview

12.10.2 Financial

12.10.3 Products/ Services Offered

12.10.4 SWOT Analysis

13. Use Cases and Best Practices

14. Conclusion

An accurate research report requires proper strategizing as well as implementation. There are multiple factors involved in the completion of good and accurate research report and selecting the best methodology to compete the research is the toughest part. Since the research reports we provide play a crucial role in any company’s decision-making process, therefore we at SNS Insider always believe that we should choose the best method which gives us results closer to reality. This allows us to reach at a stage wherein we can provide our clients best and accurate investment to output ratio.

Each report that we prepare takes a timeframe of 350-400 business hours for production. Starting from the selection of titles through a couple of in-depth brain storming session to the final QC process before uploading our titles on our website we dedicate around 350 working hours. The titles are selected based on their current market cap and the foreseen CAGR and growth.


The 5 steps process:

Step 1: Secondary Research:

Secondary Research or Desk Research is as the name suggests is a research process wherein, we collect data through the readily available information. In this process we use various paid and unpaid databases which our team has access to and gather data through the same. This includes examining of listed companies’ annual reports, Journals, SEC filling etc. Apart from this our team has access to various associations across the globe across different industries. Lastly, we have exchange relationships with various university as well as individual libraries.

Secondary Research

Step 2: Primary Research

When we talk about primary research, it is a type of study in which the researchers collect relevant data samples directly, rather than relying on previously collected data.  This type of research is focused on gaining content specific facts that can be sued to solve specific problems. Since the collected data is fresh and first hand therefore it makes the study more accurate and genuine.

We at SNS Insider have divided Primary Research into 2 parts.

Part 1 wherein we interview the KOLs of major players as well as the upcoming ones across various geographic regions. This allows us to have their view over the market scenario and acts as an important tool to come closer to the accurate market numbers. As many as 45 paid and unpaid primary interviews are taken from both the demand and supply side of the industry to make sure we land at an accurate judgement and analysis of the market.

This step involves the triangulation of data wherein our team analyses the interview transcripts, online survey responses and observation of on filed participants. The below mentioned chart should give a better understanding of the part 1 of the primary interview.

Primary Research

Part 2: In this part of primary research the data collected via secondary research and the part 1 of the primary research is validated with the interviews from individual consultants and subject matter experts.

Consultants are those set of people who have at least 12 years of experience and expertise within the industry whereas Subject Matter Experts are those with at least 15 years of experience behind their back within the same space. The data with the help of two main processes i.e., FGDs (Focused Group Discussions) and IDs (Individual Discussions). This gives us a 3rd party nonbiased primary view of the market scenario making it a more dependable one while collation of the data pointers.

Step 3: Data Bank Validation

Once all the information is collected via primary and secondary sources, we run that information for data validation. At our intelligence centre our research heads track a lot of information related to the market which includes the quarterly reports, the daily stock prices, and other relevant information. Our data bank server gets updated every fortnight and that is how the information which we collected using our primary and secondary information is revalidated in real time.

Data Bank Validation

Step 4: QA/QC Process

After all the data collection and validation our team does a final level of quality check and quality assurance to get rid of any unwanted or undesired mistakes. This might include but not limited to getting rid of the any typos, duplication of numbers or missing of any important information. The people involved in this process include technical content writers, research heads and graphics people. Once this process is completed the title gets uploader on our platform for our clients to read it.

Step 5: Final QC/QA Process:

This is the last process and comes when the client has ordered the study. In this process a final QA/QC is done before the study is emailed to the client. Since we believe in giving our clients a good experience of our research studies, therefore, to make sure that we do not lack at our end in any way humanly possible we do a final round of quality check and then dispatch the study to the client.

Key Segments:

By Pricing Model

    • Pay-per-use

    • Subscription-based Plans

By Deployment Model

  • Private GPU Cloud

  • Public GPU Cloud

  • Hybrid GPU Cloud

By Enterprise Type

  • Small and Medium-sized Enterprises

  • Large Enterprises

By Application

  • Healthcare

  • BFSI

  • Manufacturing

  • IT & Telecommunication

  • Automotive

  • Others

Request for Segment Customization as per your Business Requirement: Segment Customization Request

Regional Coverage:

North America

  • US

  • Canada

  • Mexico

Europe

  • Eastern Europe

    • Poland

    • Romania

    • Hungary

    • Turkey

    • Rest of Eastern Europe

  • Western Europe

    • Germany

    • France

    • UK

    • Italy

    • Spain

    • Netherlands

    • Switzerland

    • Austria

    • Rest of Western Europe

Asia Pacific

  • China

  • India

  • Japan

  • South Korea

  • Vietnam

  • Singapore

  • Australia

  • Rest of Asia Pacific

Middle East & Africa

  • Middle East

    • UAE

    • Egypt

    • Saudi Arabia

    • Qatar

    • Rest of Middle East

  • Africa

    • Nigeria

    • South Africa

    • Rest of Africa

Latin America

  • Brazil

  • Argentina

  • Colombia

  • Rest of Latin America

Request for Country Level Research Report: Country Level Customization Request

Available Customization

With the given market data, SNS Insider offers customization as per the company’s specific needs. The following customization options are available for the report:

  • Detailed Volume Analysis

  • Criss-Cross segment analysis (e.g. Product X Application)

  • Competitive Product Benchmarking

  • Geographic Analysis

  • Additional countries in any of the regions

  • Customized Data Representation

  • Detailed analysis and profiling of additional market players


  •            5000 (33% Discount)


  •            8950 (40% Discount)


  •            3050 (23% Discount)

Start a Conversation

Hi! Click one of our member below to chat on Phone