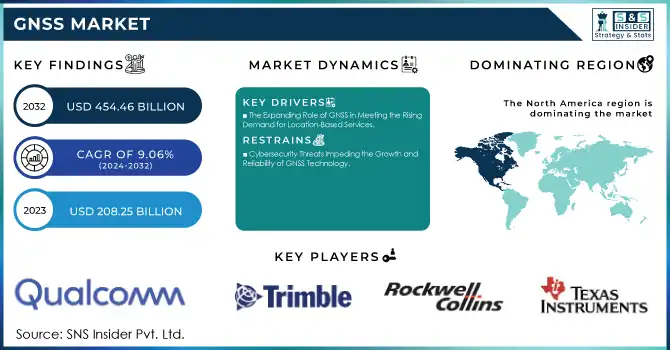
The GNSS Market Size was valued at USD 208.25 billion in 2023 and is expected to reach USD 454.46 billion by 2032, and grow at a CAGR of 9.06% over the forecast period 2024-2032.
The GNSS market is experiencing rapid growth, primarily fueled by the increasing reliance on GNSS technology in autonomous vehicles. A prime example is Tier IV’s Minibus 2.0, which adheres to Japan's Level 4 autonomous driving standards, highlighting the importance of accurate GNSS-based positioning for self-driving cars.
Get more information on GNSS Market - Request Sample Report
By integrating GNSS with sensors such as LiDAR, radars, cameras, and IMUs, autonomous systems benefit from enhanced safety, precision, and performance. Modern GNSS solutions now use multiple global satellite constellations to provide lane-level accuracy and 99.99999% integrity, allowing for precise navigation essential for Level 4 autonomous vehicles. The fusion of GNSS with LiDAR-based systems further improves robustness, ensuring reliable fallback systems while supporting V2X communication, which is vital for autonomous vehicle interactions with their environment. Additionally, the introduction of advanced methods such as dual-input interval type-2 fuzzy inference systems, which help adjust measurement noise and improve accuracy by over 63%, solidifies GNSS’s critical role in positioning technology. The availability of automotive-grade GNSS chipsets, now cost-effective and compact, has accelerated its adoption across the automotive sector, with more accurate and reliable systems becoming essential for the development of autonomous driving. As Level 2 vehicles, which can perform basic maneuvers under human supervision, move toward mainstream adoption, and Level 4 driverless vehicles take to public roads, GNSS continues to be an indispensable tool in ensuring the safe and efficient operation of these vehicles. This expansion of GNSS capabilities is not only enhancing autonomous driving but is also fueling the growth of the GNSS market as a cornerstone technology in the future of mobility.
Drivers
The Expanding Role of GNSS in Meeting the Rising Demand for Location-Based Services
LBS, which enables the provision of services based on the geographic location of users, is now integral to numerous industries, from transportation to emergency services, and even retail. The evolution of GNSS technology has allowed for precise location tracking, facilitating real-time navigation, accurate mapping, and seamless integration with mobile apps. According to multiple sources, including EUSPA and GNSS.asia, the use of GNSS in LBS applications is expanding globally, with applications in sectors such as automotive, logistics, personal tracking, and disaster management. For instance, the integration of GNSS into smartphones has allowed for location-based apps to flourish, improving convenience and accessibility for users worldwide. Additionally, advancements in GNSS, such as the enhanced capabilities of multi-constellation systems, are helping LBS providers offer even greater accuracy and reliability, which is crucial for applications requiring high-precision tracking. The growing importance of 5G networks is further accelerating the adoption of LBS, as it enables faster, more efficient positioning services that are vital for modern applications such as smart cities, autonomous vehicles, and IoT. Demonstrating how GNSS technology can deliver real-time location data for a wide range of devices and services. The rising adoption of LBS across various industries, combined with technological advancements, is set to continue driving the growth of the GNSS market, making it an essential component of the global digital ecosystem.
Restraints
Cybersecurity Threats Impeding the Growth and Reliability of GNSS Technology
The growing prevalence of cyberattacks targeting GNSS systems, including hacking, spoofing, and jamming, presents significant risks to the safety and reliability of these systems. For example, malicious actors can spoof GNSS signals, misleading autonomous vehicles or aircraft, resulting in safety concerns and operational disruptions. Additionally, the threat of jamming GNSS signals can disrupt navigation and timing systems, especially in high-precision-dependent environments like military operations and critical infrastructure. This vulnerability extends beyond traditional GNSS use cases and encompasses satellite-based applications and space infrastructure, which are increasingly becoming targets for cybercriminals. Reports from organizations like MSN and AFCEA underline the evolving sophistication of cyberattacks that exploit weaknesses in satellite and GNSS systems, stressing the urgent need for improved cybersecurity measures. Although efforts to mitigate these risks include the development of more robust security protocols and AI-powered defense strategies, the rapid pace of cyber threats demands ongoing innovation to stay ahead of malicious actors. To ensure the continued growth of the GNSS market, it is critical to focus on enhancing cybersecurity frameworks, preserving data integrity, and safeguarding vital systems from emerging threats.
By Type
The Global Constellations segment is dominating the GNSS market with a substantial share of around 44% in 2023. This dominance is driven by the extensive deployment of global satellite systems such as GPS (USA), GLONASS (Russia), Galileo (EU), and BeiDou (China). These constellations provide essential global coverage for navigation, timing, and geolocation, making them crucial for a wide range of applications, including autonomous vehicles, aviation, and maritime navigation. Their ability to deliver accurate and reliable signals worldwide is key to their leadership in the market. As satellite technologies advance, the global constellations segment is poised to continue dominating and expanding, contributing significantly to the growth and innovation in the GNSS market.
The Satellite-based Augmentation System (SBAS) segment is the fastest growing in the GNSS market over the forecast period from 2024 to 2032. SBAS enhances the accuracy, integrity, and reliability of GNSS signals by providing correction data from ground-based stations to improve satellite navigation. This system is increasingly crucial in sectors such as aviation, transportation, and precision agriculture, where high accuracy is required. The growing adoption of SBAS to support critical applications, including safety-critical operations and autonomous systems, is driving its rapid growth. Moreover, the integration of advanced technologies like AI and machine learning to further enhance the reliability and performance of SBAS solutions is expected to fuel its expansion in the coming years.
By Application
The Location-Based Services (LBS) segment is dominating the GNSS market, accounting for approximately 25% of the total market share in 2023. LBS leverages GNSS technology to provide users with accurate location information, enabling a wide range of applications such as navigation, real-time tracking, mapping, and geolocation services. The increasing reliance on smartphones, wearables, and IoT devices has significantly driven the growth of the LBS segment, as consumers demand real-time location data for personal, commercial, and logistical purposes. Furthermore, the rise of on-demand services, such as ride-hailing and food delivery, has also contributed to the expansion of LBS. LBS has become an integral part of industries like transportation, logistics, and tourism, offering businesses tools to improve operational efficiency, enhance customer experiences, and optimize routes. As advancements in GNSS technology continue, including the integration of multi-constellation GNSS systems and hybrid solutions that combine GPS, GLONASS, Galileo, and BeiDou signals, the accuracy and reliability of LBS are improving. The adoption of 5G networks further boosts LBS applications by offering faster data transfer speeds, enabling more precise location tracking, and enhancing user experiences in various sectors. With ongoing technological advancements and the growing need for efficient location services, the LBS segment is expected to maintain its dominance and continue expanding in the GNSS market over the forecast period.
The Agriculture segment is expected to be the fastest-growing segment in the GNSS market during the forecast period from 2024 to 2032. The increasing adoption of precision agriculture techniques is driving this growth, as GNSS technology plays a pivotal role in enhancing farming efficiency and productivity. By using GNSS-enabled equipment, farmers can accurately map fields, monitor crops, and optimize field operations such as planting, irrigation, and fertilization. This technology allows for real-time tracking of agricultural machinery, enabling automated processes and reducing labor costs. Moreover, GNSS technology helps in soil management, crop health monitoring, and yield prediction, offering farmers valuable insights to make data-driven decisions. The integration of GNSS with other technologies like drones, sensors, and IoT devices further improves the precision and effectiveness of farming practices. As the demand for sustainable farming and food security rises, the need for efficient resource management and high-yield farming solutions is accelerating, making the Agriculture segment one of the most promising areas for GNSS adoption.
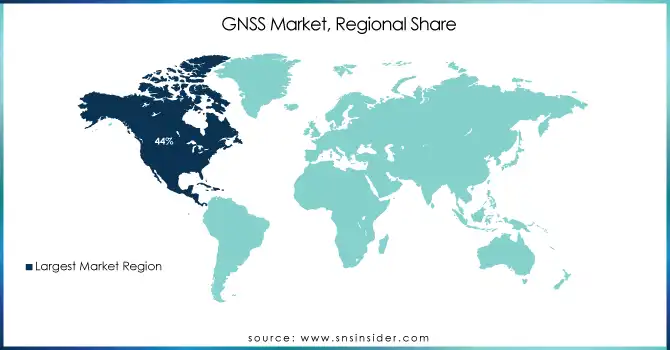
In 2023, North America holds a dominant share of approximately 44% in the GNSS market, largely driven by its advanced technological infrastructure and high demand for GNSS applications across various industries. The United States and Canada lead the region, benefiting from significant investments in autonomous vehicles, aerospace, telecommunications, and defense sectors, all of which rely heavily on GNSS technology for precision navigation and positioning. The U.S. military's adoption of GNSS for defense and security purposes further boosts demand, while the growing interest in smart cities and IoT applications in the private sector propels innovation. The region is also a key player in satellite-based augmentation systems, enhancing GNSS accuracy. With the ongoing research and development efforts in both public and private sectors, North America continues to dominate the global GNSS market. Strong government support, such as funding for the modernization of GPS infrastructure and incentives for autonomous and connected vehicle advancements, ensures that North America maintains its leadership position in the GNSS market throughout the forecast period.
Asia-Pacific region is to be the fastest-growing region in the GNSS market over the forecast period from 2024 to 2032. This growth can be attributed to the region's rapid advancements in sectors like automotive technology, where autonomous vehicles are gaining traction, driving the need for high-precision GNSS systems. Additionally, the agricultural sector's increasing reliance on GNSS for precision farming further fuels market expansion. Infrastructure development in emerging economies is also a key factor, with governments investing in satellite systems and positioning services to improve logistics, navigation, and urban planning. Moreover, the adoption of GNSS technology in consumer electronics and mobile applications is expanding, especially in countries like China, India, and Japan. With these factors combined, Asia-Pacific is set to dominate the global GNSS market in the coming years.
Need any customization research on GNNS Market - Enquiry Now
Some of the Major Players in GNSS Market along with their Product:
Qualcomm Inc. (U.S.) – GNSS chipsets, GPS receivers
Texas Instruments Inc. (U.S.) – GNSS receivers, signal processors
Trimble Inc. (U.S.) – GNSS receivers, software for surveying and mapping
Rockwell Collins (U.S.) – GNSS receivers for aviation, military-grade GNSS products
Broadcom Inc. (U.S.) – GNSS chipsets, GPS and GNSS receivers
Hexagon AB (Sweden) – GNSS solutions for surveying, precision farming
Furuno Electric Co. Ltd. (Japan) – Marine GNSS navigation systems, GPS receivers
Laird Plc. (U.K.) – GNSS antennas, positioning solutions
Cobham Plc. (U.K.) – GNSS products for defense, aviation applications
L3Harris Corporation (U.S.) – Military GNSS receivers, tactical navigation systems
Topcon Corporation (Japan) – GNSS receivers for construction and agriculture
Garmin Ltd. (U.S.) – GNSS navigation systems for automotive and marine
Septentrio (Belgium) – High-precision GNSS receivers, industrial solutions
NavCom Technology, Inc. (U.S.) – GNSS receivers for agriculture and mapping
Syntony GNSS (France) – GNSS simulation and testing equipment
List of Suppliers who provide that provide raw materials and components for the GNSS market:
Murata Manufacturing Co., Ltd. (Japan)
TDK Corporation (Japan)
Broadcom Inc. (U.S.)
Qualcomm Inc. (U.S.)
Skyworks Solutions, Inc. (U.S.)
STMicroelectronics (Switzerland)
Analog Devices, Inc. (U.S.)
NXP Semiconductors (Netherlands)
Rohm Semiconductor (Japan)
InvenSense Inc. (TDK) (U.S.)
January 2025, Trimble, Qualcomm Partner to Deliver Precise Positioning for Automated VehiclesTrimble has extended its collaboration with Qualcomm Technologies to provide precise positioning solutions for automated vehicles. The integration of Trimble's ProPoint Go engine with Qualcomm’s Snapdragon Auto 5G Modem-RF Gen 2 aims for positioning accuracy within 10 cm, supporting Level.
On November 2024, GNSS and Correction Services Add to Big Wins for Oil Companies Topographic Land Surveyors, Inc., based in Texas, relies heavily on GNSS services, such as Trimble R10 GNSS Receivers and CenterPoint RTX correction service, to support oil and gas industries across multiple states. Today, 95% of their work is GNSS-based, enhancing accuracy and efficiency in land surveying for tasks like staking wells and laying pipelines.
| Report Attributes | Details |
| Market Size in 2023 | USD 208.25 Billion |
| Market Size by 2032 | USD 454.46 Billion |
| CAGR | CAGR of 9.06% From 2024 to 2032 |
| Base Year | 2023 |
| Forecast Period | 2024-2032 |
| Historical Data | 2020-2022 |
| Report Scope & Coverage | Market Size, Segments Analysis, Competitive Landscape, Regional Analysis, DROC & SWOT Analysis, Forecast Outlook |
| Key Segments | • By Type (Global Constellations, Regional Constellations, Satellite-based Augmentation) • By Application (Rail, Aviation, Maritime, Surveying, Time Synch, Agriculture, LBS, Road, Others) |
| Regional Analysis/Coverage | North America (US, Canada, Mexico), Europe (Eastern Europe [Poland, Romania, Hungary, Turkey, Rest of Eastern Europe] Western Europe] Germany, France, UK, Italy, Spain, Netherlands, Switzerland, Austria, Rest of Western Europe]), Asia Pacific (China, India, Japan, South Korea, Vietnam, Singapore, Australia, Rest of Asia Pacific), Middle East & Africa (Middle East [UAE, Egypt, Saudi Arabia, Qatar, Rest of Middle East], Africa [Nigeria, South Africa, Rest of Africa], Latin America (Brazil, Argentina, Colombia, Rest of Latin America) |
| Company Profiles | Qualcomm Inc. (U.S.); Texas Instruments Inc. (U.S.); Trimble Inc. (U.S.); Rockwell Collins (U.S.); Broadcom Inc. (U.S.); Hexagon AB (Sweden); Furuno Electric Co. Ltd. (Japan); Laird Plc. (U.K.); Cobham Plc. (U.K.); L3Harris Corporation (U.S.); Topcon Corporation (Japan); Garmin Ltd. (U.S.); Septentrio (Belgium); NavCom Technology, Inc. (U.S.); Syntony GNSS (France). |
| Key Drivers | • The Expanding Role of GNSS in Meeting the Rising Demand for Location-Based Services. |
| Restraints | • Cybersecurity Threats Impeding the Growth and Reliability of GNSS Technology. |
The GNSS market size was valued at 208.25 billion in 2023 at a CAGR of 9.06%.
Ans: High cost, Lack of awareness and Signal connectivity are limiting the GNSS Market's expansion.
Ans: The key market driver for the GNSS market is the increasing demand for accurate positioning in sectors like autonomous vehicles, agriculture, and construction.
Ans: North America is dominating in GNSS Market
Ans: USD 454.46 Billion by 2032 in GNSS Market.
Table of Content
1. Introduction
1.1 Market Definition
1.2 Scope (Inclusion and Exclusions)
1.3 Research Assumptions
2. Executive Summary
2.1 Market Overview
2.2 Regional Synopsis
2.3 Competitive Summary
3. Research Methodology
3.1 Top-Down Approach
3.2 Bottom-up Approach
3.3. Data Validation
3.4 Primary Interviews
4. Market Dynamics Impact Analysis
4.1 Market Driving Factors Analysis
4.1.2 Drivers
4.1.2 Restraints
4.2 PESTLE Analysis
4.3 Porter’s Five Forces Model
5. Statistical Insights and Trends Reporting
5.1 Technology Adoption by Region
5.2 Usage and Demand, by Region
5.3 Regulatory and Policy Data
5.4 Customer Demographics
6. Competitive Landscape
6.1 List of Major Companies, By Region
6.2 Market Share Analysis, By Region
6.3 Product Benchmarking
6.3.1 Product specifications and features
6.3.2 Pricing
6.4 Strategic Initiatives
6.4.1 Marketing and promotional activities
6.4.2 Distribution and supply chain strategies
6.4.3 Expansion plans and new product launches
6.4.4 Strategic partnerships and collaborations
6.5 Technological Advancements
6.6 Market Positioning and Branding
7. GNSS Market Segmentation, by Type
7.1 Chapter Overview
7.2 Global Constellations
7.2.1 Global Constellations Market Trends Analysis (2020-2032)
7.2.2 Global Constellations Market Size Estimates and Forecasts to 2032 (USD Billion)
7.3 Regional Constellations
7.3.1 Regional Constellations Market Trends Analysis (2020-2032)
7.3.2 Regional Constellations Market Size Estimates and Forecasts to 2032 (USD Billion)
7.4 Satellite-based Augmentation
7.4.1 Satellite-based Augmentation Market Trends Analysis (2020-2032)
7.4.2 Satellite-based Augmentation Market Size Estimates and Forecasts to 2032 (USD Billion)
8. GNSS Market Segmentation, by Application
8.1 Chapter Overview
8.2 Rail
8.2.1 Rail Market Trends Analysis (2020-2032)
8.2.2 Rail Market Size Estimates and Forecasts to 2032 (USD Billion)
8.3 Aviation
8.3.1 Aviation Market Trends Analysis (2020-2032)
8.3.2 Aviation Market Size Estimates and Forecasts to 2032 (USD Billion)
8.4 Maritime
8.4.1 Maritime Market Trends Analysis (2020-2032)
8.4.2 Maritime Market Size Estimates and Forecasts to 2032 (USD Billion)
8.5 Surveying
8.5.1 Surveying Market Trends Analysis (2020-2032)
8.5.2 Surveying Market Size Estimates and Forecasts to 2032 (USD Billion)
8.6 Time Synch
8.6.1 Time Synch Market Trends Analysis (2020-2032)
8.6.2 Time Synch Market Size Estimates and Forecasts to 2032 (USD Billion)
8.7 Agriculture
8.7.1 Agriculture Market Trends Analysis (2020-2032)
8.7.2 Agriculture Market Size Estimates and Forecasts to 2032 (USD Billion)
8.8 LBS
8.8.1 LBS Market Trends Analysis (2020-2032)
8.8.2 LBS Market Size Estimates and Forecasts to 2032 (USD Billion)
8.9Road
8.9.1 Road Market Trends Analysis (2020-2032)
8.9.2 Road Market Size Estimates and Forecasts to 2032 (USD Billion)
8.10 Others
8.10.1 Others Market Trends Analysis (2020-2032)
8.10.2 Others Market Size Estimates and Forecasts to 2032 (USD Billion)
9. Regional Analysis
9.1 Chapter Overview
9.2 North America
9.2.1 Trends Analysis
9.2.2 North America GNSS Market Estimates and Forecasts, by Country (2020-2032) (USD Billion)
9.2.3 North America GNSS Market Estimates and Forecasts, by Type (2020-2032) (USD Billion)
9.2.4 North America GNSS Market Estimates and Forecasts, by Application (2020-2032) (USD Billion)
9.2.5 USA
9.2.5.1 USA GNSS Market Estimates and Forecasts, by Type (2020-2032) (USD Billion)
9.2.5.2 USA GNSS Market Estimates and Forecasts, by Application (2020-2032) (USD Billion)
9.2.6 Canada
9.2.6.1 Canada GNSS Market Estimates and Forecasts, by Type (2020-2032) (USD Billion)
9.2.6.2 Canada GNSS Market Estimates and Forecasts, by
Key Segments:
By Type
By Application
Request for Segment Customization as per your Business Requirement: Segment Customization Request
REGIONAL COVERAGE:
North America
Europe
Asia-Pacific
Middle East & Africa
Latin America
Request for Country Level Research Report: Country Level Customization Request
Available Customization
With the given market data, SNS Insider offers customization as per the company’s specific needs. The following customization options are available for the report:
Application (2020-2032) (USD Billion)
9.2.7 Mexico
9.2.7.1 Mexico GNSS Market Estimates and Forecasts, by Type (2020-2032) (USD Billion)
9.2.7.2 Mexico GNSS Market Estimates and Forecasts, by Application (2020-2032) (USD Billion)
9.3 Europe
9.3.1 Eastern Europe
9.3.1.1 Trends Analysis
9.3.1.2 Eastern Europe GNSS Market Estimates and Forecasts, by Country (2020-2032) (USD Billion)
9.3.1.3 Eastern Europe GNSS Market Estimates and Forecasts, by Type (2020-2032) (USD Billion)
9.3.1.4 Eastern Europe GNSS Market Estimates and Forecasts, by Application (2020-2032) (USD Billion)
9.3.1.5 Poland
9.3.1.5.1 Poland GNSS Market Estimates and Forecasts, by Type (2020-2032) (USD Billion)
9.3.1.5.2 Poland GNSS Market Estimates and Forecasts, by Application (2020-2032) (USD Billion)
9.3.1.6 Romania
9.3.1.6.1 Romania GNSS Market Estimates and Forecasts, by Type (2020-2032) (USD Billion)
9.3.1.6.2 Romania GNSS Market Estimates and Forecasts, by Application (2020-2032) (USD Billion)
9.3.1.7 Hungary
9.3.1.7.1 Hungary GNSS Market Estimates and Forecasts, by Type (2020-2032) (USD Billion)
9.3.1.7.2 Hungary GNSS Market Estimates and Forecasts, by Application (2020-2032) (USD Billion)
9.3.1.8 Turkey
9.3.1.8.1 Turkey GNSS Market Estimates and Forecasts, by Type (2020-2032) (USD Billion)
9.3.1.8.2 Turkey GNSS Market Estimates and Forecasts, by Application (2020-2032) (USD Billion)
9.3.1.9 Rest of Eastern Europe
9.3.1.9.1 Rest of Eastern Europe GNSS Market Estimates and Forecasts, by Type (2020-2032) (USD Billion)
9.3.1.9.2 Rest of Eastern Europe GNSS Market Estimates and Forecasts, by Application (2020-2032) (USD Billion)
9.3.2 Western Europe
9.3.2.1 Trends Analysis
9.3.2.2 Western Europe GNSS Market Estimates and Forecasts, by Country (2020-2032) (USD Billion)
9.3.2.3 Western Europe GNSS Market Estimates and Forecasts, by Type (2020-2032) (USD Billion)
9.3.2.4 Western Europe GNSS Market Estimates and Forecasts, by Application (2020-2032) (USD Billion)
9.3.2.5 Germany
9.3.2.5.1 Germany GNSS Market Estimates and Forecasts, by Type (2020-2032) (USD Billion)
9.3.2.5.2 Germany GNSS Market Estimates and Forecasts, by Application (2020-2032) (USD Billion)
9.3.2.6 France
9.3.2.6.1 France GNSS Market Estimates and Forecasts, by Type (2020-2032) (USD Billion)
9.3.2.6.2 France GNSS Market Estimates and Forecasts, by Application (2020-2032) (USD Billion)
9.3.2.7 UK
9.3.2.7.1 UK GNSS Market Estimates and Forecasts, by Type (2020-2032) (USD Billion)
9.3.2.7.2 UK GNSS Market Estimates and Forecasts, by Application (2020-2032) (USD Billion)
9.3.2.8 Italy
9.3.2.8.1 Italy GNSS Market Estimates and Forecasts, by Type (2020-2032) (USD Billion)
9.3.2.8.2 Italy GNSS Market Estimates and Forecasts, by Application (2020-2032) (USD Billion)
9.3.2.9 Spain
9.3.2.9.1 Spain GNSS Market Estimates and Forecasts, by Type (2020-2032) (USD Billion)
9.3.2.9.2 Spain GNSS Market Estimates and Forecasts, by Application (2020-2032) (USD Billion)
9.3.2.10 Netherlands
9.3.2.10.1 Netherlands GNSS Market Estimates and Forecasts, by Type (2020-2032) (USD Billion)
9.3.2.10.2 Netherlands GNSS Market Estimates and Forecasts, by Application (2020-2032) (USD Billion)
9.3.2.11 Switzerland
9.3.2.11.1 Switzerland GNSS Market Estimates and Forecasts, by Type (2020-2032) (USD Billion)
9.3.2.11.2 Switzerland GNSS Market Estimates and Forecasts, by Application (2020-2032) (USD Billion)
9.3.2.12 Austria
9.3.2.12.1 Austria GNSS Market Estimates and Forecasts, by Type (2020-2032) (USD Billion)
9.3.2.12.2 Austria GNSS Market Estimates and Forecasts, by Application (2020-2032) (USD Billion)
9.3.2.13 Rest of Western Europe
9.3.2.13.1 Rest of Western Europe GNSS Market Estimates and Forecasts, by Type (2020-2032) (USD Billion)
9.3.2.13.2 Rest of Western Europe GNSS Market Estimates and Forecasts, by Application (2020-2032) (USD Billion)
9.4 Asia-Pacific
9.4.1 Trends Analysis
9.4.2 Asia-Pacific GNSS Market Estimates and Forecasts, by Country (2020-2032) (USD Billion)
9.4.3 Asia-Pacific GNSS Market Estimates and Forecasts, by Type (2020-2032) (USD Billion)
9.4.4 Asia-Pacific GNSS Market Estimates and Forecasts, by Application (2020-2032) (USD Billion)
9.4.5 China
9.4.5.1 China GNSS Market Estimates and Forecasts, by Type (2020-2032) (USD Billion)
9.4.5.2 China GNSS Market Estimates and Forecasts, by Application (2020-2032) (USD Billion)
9.4.6 India
9.4.5.1 India GNSS Market Estimates and Forecasts, by Type (2020-2032) (USD Billion)
9.4.5.2 India GNSS Market Estimates and Forecasts, by Application (2020-2032) (USD Billion)
9.4.5 Japan
9.4.5.1 Japan GNSS Market Estimates and Forecasts, by Type (2020-2032) (USD Billion)
9.4.5.2 Japan GNSS Market Estimates and Forecasts, by Application (2020-2032) (USD Billion)
9.4.6 South Korea
9.4.6.1 South Korea GNSS Market Estimates and Forecasts, by Type (2020-2032) (USD Billion)
9.4.6.2 South Korea GNSS Market Estimates and Forecasts, by Application (2020-2032) (USD Billion)
9.4.7 Vietnam
9.4.7.1 Vietnam GNSS Market Estimates and Forecasts, by Type (2020-2032) (USD Billion)
9.2.7.2 Vietnam GNSS Market Estimates and Forecasts, by Application (2020-2032) (USD Billion)
9.4.8 Singapore
9.4.8.1 Singapore GNSS Market Estimates and Forecasts, by Type (2020-2032) (USD Billion)
9.4.8.2 Singapore GNSS Market Estimates and Forecasts, by Application (2020-2032) (USD Billion)
9.4.9 Australia
9.4.9.1 Australia GNSS Market Estimates and Forecasts, by Type (2020-2032) (USD Billion)
9.4.9.2 Australia GNSS Market Estimates and Forecasts, by Application (2020-2032) (USD Billion)
9.4.10 Rest of Asia-Pacific
9.4.10.1 Rest of Asia-Pacific GNSS Market Estimates and Forecasts, by Type (2020-2032) (USD Billion)
9.4.10.2 Rest of Asia-Pacific GNSS Market Estimates and Forecasts, by Application (2020-2032) (USD Billion)
9.5 Middle East and Africa
9.5.1 Middle East
9.5.1.1 Trends Analysis
9.5.1.2 Middle East GNSS Market Estimates and Forecasts, by Country (2020-2032) (USD Billion)
9.5.1.3 Middle East GNSS Market Estimates and Forecasts, by Type (2020-2032) (USD Billion)
9.5.1.4 Middle East GNSS Market Estimates and Forecasts, by Application (2020-2032) (USD Billion)
9.5.1.5 UAE
9.5.1.5.1 UAE GNSS Market Estimates and Forecasts, by Type (2020-2032) (USD Billion)
9.5.1.5.2 UAE GNSS Market Estimates and Forecasts, by Application (2020-2032) (USD Billion)
9.5.1.6 Egypt
9.5.1.6.1 Egypt GNSS Market Estimates and Forecasts, by Type (2020-2032) (USD Billion)
9.5.1.6.2 Egypt GNSS Market Estimates and Forecasts, by Application (2020-2032) (USD Billion)
9.5.1.7 Saudi Arabia
9.5.1.7.1 Saudi Arabia GNSS Market Estimates and Forecasts, by Type (2020-2032) (USD Billion)
9.5.1.7.2 Saudi Arabia GNSS Market Estimates and Forecasts, by Application (2020-2032) (USD Billion)
9.5.1.8 Qatar
9.5.1.8.1 Qatar GNSS Market Estimates and Forecasts, by Type (2020-2032) (USD Billion)
9.5.1.8.2 Qatar GNSS Market Estimates and Forecasts, by Application (2020-2032) (USD Billion)
9.5.1.9 Rest of Middle East
9.5.1.9.1 Rest of Middle East GNSS Market Estimates and Forecasts, by Type (2020-2032) (USD Billion)
9.5.1.9.2 Rest of Middle East GNSS Market Estimates and Forecasts, by Application (2020-2032) (USD Billion)
9.5.2 Africa
9.5.2.1 Trends Analysis
9.5.2.2 Africa GNSS Market Estimates and Forecasts, by Country (2020-2032) (USD Billion)
9.5.2.3 Africa GNSS Market Estimates and Forecasts, by Type (2020-2032) (USD Billion)
9.5.2.4 Africa GNSS Market Estimates and Forecasts, by Application (2020-2032) (USD Billion)
9.5.2.5 South Africa
9.5.2.5.1 South Africa GNSS Market Estimates and Forecasts, by Type (2020-2032) (USD Billion)
9.5.2.5.2 South Africa GNSS Market Estimates and Forecasts, by Application (2020-2032) (USD Billion)
9.5.2.6 Nigeria
9.5.2.6.1 Nigeria GNSS Market Estimates and Forecasts, by Type (2020-2032) (USD Billion)
9.5.2.6.2 Nigeria GNSS Market Estimates and Forecasts, by Application (2020-2032) (USD Billion)
9.5.2.7 Rest of Africa
9.5.2.7.1 Rest of Africa GNSS Market Estimates and Forecasts, by Type (2020-2032) (USD Billion)
9.5.2.7.2 Rest of Africa GNSS Market Estimates and Forecasts, by Application (2020-2032) (USD Billion)
9.6 Latin America
9.6.1 Trends Analysis
9.6.2 Latin America GNSS Market Estimates and Forecasts, by Country (2020-2032) (USD Billion)
9.6.3 Latin America GNSS Market Estimates and Forecasts, by Type (2020-2032) (USD Billion)
9.6.4 Latin America GNSS Market Estimates and Forecasts, by Application (2020-2032) (USD Billion)
9.6.5 Brazil
9.6.5.1 Brazil GNSS Market Estimates and Forecasts, by Type (2020-2032) (USD Billion)
9.6.5.2 Brazil GNSS Market Estimates and Forecasts, by Application (2020-2032) (USD Billion)
9.6.6 Argentina
9.6.6.1 Argentina GNSS Market Estimates and Forecasts, by Type (2020-2032) (USD Billion)
9.6.6.2 Argentina GNSS Market Estimates and Forecasts, by Application (2020-2032) (USD Billion)
9.6.7 Colombia
9.6.7.1 Colombia GNSS Market Estimates and Forecasts, by Type (2020-2032) (USD Billion)
9.6.7.2 Colombia GNSS Market Estimates and Forecasts, by Application (2020-2032) (USD Billion)
9.6.8 Rest of Latin America
9.6.8.1 Rest of Latin America GNSS Market Estimates and Forecasts, by Type (2020-2032) (USD Billion)
9.6.8.2 Rest of Latin America GNSS Market Estimates and Forecasts, by Application (2020-2032) (USD Billion)
10. Company Profiles
10.1 Qualcomm Inc.
10.1.1 Company Overview
10.1.2 Financial
10.1.3 Products/ Services Offered
10.1.4 SWOT Analysis
10.2 Texas Instruments Inc.
10.2.1 Company Overview
10.2.2 Financial
10.2.3 Products/ Services Offered
10.2.4 SWOT Analysis
10.3 Trimble Inc.
10.3.1 Company Overview
10.3.2 Financial
10.3.3 Products/ Services Offered
10.3.4 SWOT Analysis
10.4 Rockwell Collins
10.4.1 Company Overview
10.4.2 Financial
10.4.3 Products/ Services Offered
10.4.4 SWOT Analysis
10.5 Broadcom Inc.
10.5.1 Company Overview
10.5.2 Financial
10.5.3 Products/ Services Offered
10.5.4 SWOT Analysis
10.6 Hexagon AB
10.6.1 Company Overview
10.6.2 Financial
10.6.3 Products/ Services Offered
10.6.4 SWOT Analysis
10.7Furuno Electric Co. Ltd.
10.7.1 Company Overview
10.7.2 Financial
10.7.3 Products/ Services Offered
10.7.4 SWOT Analysis
10.8 Laird Plc.
10.8.1 Company Overview
10.8.2 Financial
10.8.3 Products/ Services Offered
10.8.4 SWOT Analysis
10.9 Cobham Plc.
10.9.1 Company Overview
10.9.2 Financial
10.9.3 Products/ Services Offered
10.9.4 SWOT Analysis
10.10 L3Harris Corporation
10.10.1 Company Overview
10.10.2 Financial
10.10.3 Products/ Services Offered
10.10.4 SWOT Analysis
11. Use Cases and Best Practices
12. Conclusion
An accurate research report requires proper strategizing as well as implementation. There are multiple factors involved in the completion of good and accurate research report and selecting the best methodology to compete the research is the toughest part. Since the research reports we provide play a crucial role in any company’s decision-making process, therefore we at SNS Insider always believe that we should choose the best method which gives us results closer to reality. This allows us to reach at a stage wherein we can provide our clients best and accurate investment to output ratio.
Each report that we prepare takes a timeframe of 350-400 business hours for production. Starting from the selection of titles through a couple of in-depth brain storming session to the final QC process before uploading our titles on our website we dedicate around 350 working hours. The titles are selected based on their current market cap and the foreseen CAGR and growth.
The 5 steps process:
Step 1: Secondary Research:
Secondary Research or Desk Research is as the name suggests is a research process wherein, we collect data through the readily available information. In this process we use various paid and unpaid databases which our team has access to and gather data through the same. This includes examining of listed companies’ annual reports, Journals, SEC filling etc. Apart from this our team has access to various associations across the globe across different industries. Lastly, we have exchange relationships with various university as well as individual libraries.

Step 2: Primary Research
When we talk about primary research, it is a type of study in which the researchers collect relevant data samples directly, rather than relying on previously collected data. This type of research is focused on gaining content specific facts that can be sued to solve specific problems. Since the collected data is fresh and first hand therefore it makes the study more accurate and genuine.
We at SNS Insider have divided Primary Research into 2 parts.
Part 1 wherein we interview the KOLs of major players as well as the upcoming ones across various geographic regions. This allows us to have their view over the market scenario and acts as an important tool to come closer to the accurate market numbers. As many as 45 paid and unpaid primary interviews are taken from both the demand and supply side of the industry to make sure we land at an accurate judgement and analysis of the market.
This step involves the triangulation of data wherein our team analyses the interview transcripts, online survey responses and observation of on filed participants. The below mentioned chart should give a better understanding of the part 1 of the primary interview.

Part 2: In this part of primary research the data collected via secondary research and the part 1 of the primary research is validated with the interviews from individual consultants and subject matter experts.
Consultants are those set of people who have at least 12 years of experience and expertise within the industry whereas Subject Matter Experts are those with at least 15 years of experience behind their back within the same space. The data with the help of two main processes i.e., FGDs (Focused Group Discussions) and IDs (Individual Discussions). This gives us a 3rd party nonbiased primary view of the market scenario making it a more dependable one while collation of the data pointers.
Step 3: Data Bank Validation
Once all the information is collected via primary and secondary sources, we run that information for data validation. At our intelligence centre our research heads track a lot of information related to the market which includes the quarterly reports, the daily stock prices, and other relevant information. Our data bank server gets updated every fortnight and that is how the information which we collected using our primary and secondary information is revalidated in real time.

Step 4: QA/QC Process
After all the data collection and validation our team does a final level of quality check and quality assurance to get rid of any unwanted or undesired mistakes. This might include but not limited to getting rid of the any typos, duplication of numbers or missing of any important information. The people involved in this process include technical content writers, research heads and graphics people. Once this process is completed the title gets uploader on our platform for our clients to read it.
Step 5: Final QC/QA Process:
This is the last process and comes when the client has ordered the study. In this process a final QA/QC is done before the study is emailed to the client. Since we believe in giving our clients a good experience of our research studies, therefore, to make sure that we do not lack at our end in any way humanly possible we do a final round of quality check and then dispatch the study to the client.
By Type
Global Constellations
Regional Constellations
Satellite-based Augmentation
By Application
Rail
Aviation
Maritime
Surveying
Time Synch
Agriculture
LBS
Road
Others
Request for Segment Customization as per your Business Requirement: Segment Customization Request
REGIONAL COVERAGE:
North America
US
Canada
Mexico
Europe
Eastern Europe
Poland
Romania
Hungary
Turkey
Rest of Eastern Europe
Western Europe
Germany
France
UK
Italy
Spain
Netherlands
Switzerland
Austria
Rest of Western Europe
Asia-Pacific
China
India
Japan
South Korea
Vietnam
Singapore
Australia
Rest of Asia Pacific
Middle East & Africa
Middle East
UAE
Egypt
Saudi Arabia
Qatar
Rest of the Middle East
Africa
Nigeria
South Africa
Rest of Africa
Latin America
Brazil
Argentina
Colombia
Rest of Latin America
Request for Country Level Research Report: Country Level Customization Request
Available Customization
With the given market data, SNS Insider offers customization as per the company’s specific needs. The following customization options are available for the report:
Product Analysis
Criss-Cross segment analysis (e.g. Product X Application)
Product Matrix which gives a detailed comparison of the product portfolio of each company
Geographic Analysis
Additional countries in any of the regions
Company Information
Detailed analysis and profiling of additional market players (Up to five)
The Power Management System Market Size was valued at USD 5.18 Billion in 2023 and is expected to reach USD 8.96 Billion by 2032 and grow at a CAGR of 6.3% over the forecast period 2024-2032.
The Water Quality Monitoring Systems Market Size was valued at USD 5.54 billion in 2023 and it is expected to grow at a CAGR of 7.22% by Forecast 2032.
The Body Area Network Market was valued at USD 13.9 Billion in 2023 and is expected to reach USD 39.2 Billion by 2032, growing at a CAGR of 12.24% from 2024-2032.
The Access Control as a Service (ACaaS) Market was valued at USD 1.65 billion in 2023 and is expected to reach USD 10.29 billion by 2032, growing at a CAGR of 22.59% over the forecast period 2024-2032.
The Livestock Monitoring Market Size was valued at USD 2.78 billion in 2023 and is expected to grow at a CAGR of 9.75% to reach USD 6.40 billion by 2032.
The Smart Grid Technology Market Size was valued at USD 45.28 Billion in 2023 and is expected to grow at 18.97% CAGR to reach USD 216.04 Billion by 2032.

Hi! Click one of our member below to chat on Phone
© 2025 All Rights Reserved by SNS Insider Pvt Ltd


