image

Glufosinate Ammonium Market Report Scope & Overview:
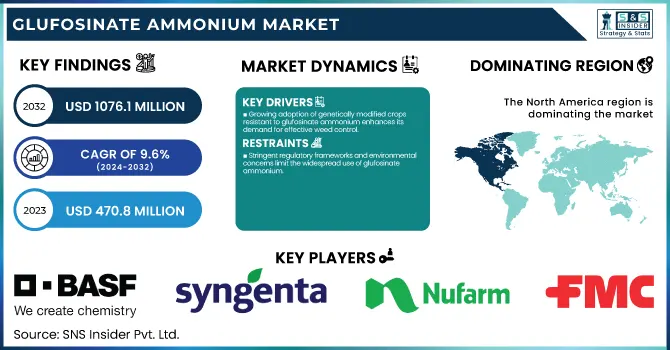
Glufosinate Ammonium Market Size was valued at USD 470.8 Million in 2023 and is expected to reach USD 1076.1 Million by 2032, growing at a CAGR of 9.6% over the forecast period 2024-2032.

The Glufosinate Ammonium Market Report provides key statistical trends and insights, including global production and consumption volumes to market pricing trends, analysing fluctuation dynamics based on supply chain and regulatory factors. It explores adoption rates for agriculture, including the share of farmland by crop type, and it analyses the regulatory framework, including changing bans and maximum residues limits (MRLs). It also analyzes the competitive landscape, detailing leading manufacturer's market share, and environmental and health hazard studies, evaluation of toxicity levels, and ecological effects. The global glufosinate ammonium market is set to be driven by increasing application of genetically modified crops and growing need for efficient weed management solutions.

Glufosinate Ammonium Market Dynamics:

Drivers

  • Growing adoption of genetically modified crops resistant to glufosinate ammonium enhances its demand for effective weed control.

Growing adoption of genetically modified (GM) crops that are glufosinate ammonium-resistant is contributing to the herbicide market expansion. These GM crops are genetically modified to be tolerant to applications of glufosinate ammonium herbicides, which allows farmers to control a wide range of weeds without damaging the crop of interest. This compatibility also streamlines weed control, lowers labor costs, and increase crop yields. The growing acceptance of herbicide-resistant crops and increasing agricultural labour costs. China has a 45% share of the market and India is at 20% while Australia is at 15%. Soybean planting represented 30% of total glufosinate ammonium consumption in 2023, followed by corn (25%) and fruit orchards (20%). The cotton sector also experienced a 15% increase in demand due to the expansion of herbicide-tolerant varieties.  With the rise of green formulations & precision agriculture techniques, significant growth is expected in glufosinate ammonium market in the coming years. Crop types genetically modified for resistance to glufosinate ammonium are one of the other factors driving the growth of the pesticide market.  Data analytics, GPS and IoT devices used in precision farming have allowed farmers to deploy far more targeted applications of herbicides. This technique of targeted application reduces both the amount of chemical used and the impact on the environment, and it reflects the global trend of sustainable agriculture. This integration is likely to improve the efficacy of glufosinate ammonium, making it a popular choice of modern farmers.

Restraint:

  • Stringent regulatory frameworks and environmental concerns limit the widespread use of glufosinate ammonium.

In addition, strict regulatory framework and environmental concern are expected to be the key restrain for the growth of glufosinate ammonium market. . In India, the Directorate General of Foreign Trade (DGFT) issued Notification No. 54/2024-25 on January 24, 2025, amending the import policy for glufosinate technical under HS Code 38089390. This amendment extends the Minimum Import Price (MIP) condition for glufosinate and its salts (with a purity of at least 95% w/w) for one year, from January 24, 2025, to January 23, 2026. Imports having a Cost, Insurance, and Freight (CIF) value below ₹1,289 per kilo are categorized as "Restricted," and those at or above this point stay "Free" under this policy. As a result, the agency is taking regulatory action to balance the quality of products on the market and the prices of raw materials and finished products while creating conditions for domestic producers in this segment and compliance with environmental standards. These strict regulations can reduce the availability of lower-cost glufosinate products in the market, which can increase costs for end-users and impact the overall market dynamics. The regulatory scrutiny is increasing, owing to environmental concerns regarding the use of chemical herbicides such as glufosinate ammonium, which has hindered the growth of the market.

Opportunity:

  • Development of eco-friendly formulations and integration with precision farming technologies present growth prospects in the glufosinate ammonium market.

The glufosinate ammonium market is poised for significant growth, driven by the development of eco-friendly formulations and the integration of precision farming technologies. The adoption of transgenic crops that are tolerant to the herbicide glufosinate ammonium has significantly supported this expansion. The cultivation area for herbicide-resistant biotech crops, including glufosinate-resistant varieties, reached approximately 98.9 million hectares globally, accounting for about 28% of the total biotech crop area.

There is also a trend toward bio-based herbicides as well as pressure from environmental regulations. This change coincides with a worldwide shift towards sustainable farming, creating a market for products including L-glufosinate ammonium that are seen as less damaging to the environment than classic chemical herbicides. Moreover, the availability of precision farming technologies can help optimize the application of herbicides, which improves overall usage of herbicides in the market and leads to a lesser environmental impact. These innovations are anticipated to create a market for glufosinate ammonium as farmers search for effective and sustainable weed management solutions.

Challenge:

  • Emergence of glufosinate-resistant weed species poses a threat to its long-term efficacy and market sustainability.

The development of weeds resistant to glufosinate represents a substantial threat to sustainable agriculture. Palmer amaranth (Amaranthus palmeri) populations resistant to glufosinate were discovered in Arkansas, with some exhibiting resistance up to 15 times the standard application rate. This development highlights the versatility of weeds and the possibility of resistance to herbicides such as glufosinate. The number of these resistant species is exploding, and they’re threatening crop yields and making weed control more complex. To combat this, experts advocate for integrated weed management practices, including crop rotation, use of multiple herbicide modes of action, and non-chemical control methods. Proactive measures are essential to preserve the efficacy of existing herbicides and ensure long-term agricultural productivity.

Glufosinate Ammonium Market Segmentation:

By Crop

In 2023, the Genetically Modified (GM) Crops segment held the largest share, accounting for 72%, of the glufosinate ammonium market. This significant market share can be attributed to several factors, numerous regulatory approvals, yield improvements, weed resistance management, and mounting global food security concerns. According to the USDA, adoption rates of GM crops have steadily risen over the last two decades, and in 2023 GM crops occupied 94%, 96%, and 92% of soybean, cotton, and corn acreage, respectively, in the United States. This widespread adoption has directly contributed to the increased demand for glufosinate ammonium, as many GM crops are engineered to be resistant to this herbicide. Moreover, the global adoption of glufosinate-resistant GM crops led to expanded approval for glufosinate production in agriculture by government agencies around the world.

By Form

In 2023, the liquid segment accounted for a major share of the glufosinate ammonium market. Ease of Application, Superior Absorption & Efficacy, Compatibility with Precision Agriculture, Storage & Transportation Advantages, and Customization Potential. Liquid herbicides comprise more than 70% of all herbicide applications in the U.S. according to the U.S. Environmental Protection Agency (EPA), indicating their popularity. Liquid formulations of glufosinate ammonium are more preferable among farmers because they are easier to handle and apply compared to non-liquid forms, along with providing better coverage and absorption by essential plant foliage for better weed control. Liquid formulations have also benefited from the upsurge of precision agriculture technologies in line with the European Commission's Farm to Fork Strategy, which includes reducing overall pesticide usage by 50% by 2030.

By Application

The agricultural segment held the largest revenue share of 65% of the glufosinate ammonium market in 2023. Some of the key factors contributing to this significant market share include the rising global agricultural production, the increasing adoption of conservation agriculture, the emphasis on sustainable agriculture as demonstrated by governments supporting it with incentives, growing weed resistance, and labor shortages in agriculture. Global cereal production was 2,790 million tonnes in 2022, up 0.9% from 2021, according to the Food and Agriculture Organization (FAO). The increase in agricultural production is directly linked with the rising demand for effective herbicides like glufosinate-ammonium. According to the FAO, more than 180 million hectares in the world are cultivated using conservation agriculture, in which the crucial no-tillage or reduced tillage system is a cornerstone of this type of agriculture, where glufosinate ammonium plays an essential role.

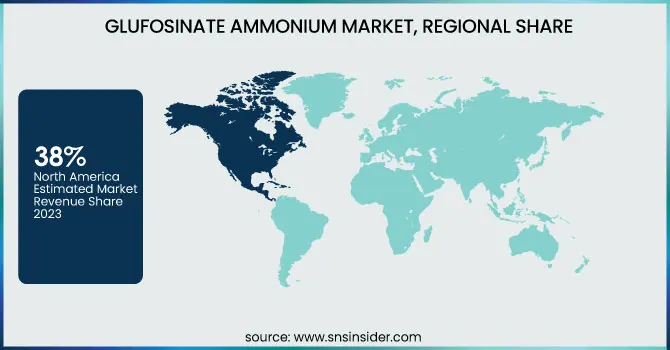
Glufosinate Ammonium Market Regional Outlook:

North America held the highest market share of 38% in the global glufosinate ammonium market in 2023. This dominance can be attributed to the region's high adoption rate of genetically modified crops and advanced agricultural practices. In 2023, more than 90% of corn, soybeans, and cotton acres in the United States were planted with GM crops, according to the USDA. The regional market is also benefiting as in 2021, the U.S. Environmental Protection Agency (EPA) approved the release of certain varieties of glufosinate-resistant crops.

Asia-Pacific is expected to register the highest CAGR during the forecast period. It is being fueled by growing agricultural activities, increasing food demand, and government initiatives to enhance agricultural productivity. China’s 14th Five-Year Plan (2021–2025) highlights agricultural modernization and securing food, indirectly supporting the glufosinate ammonium market. The government of India (GoI), as an example, has introduced a programme on, "Per Drop More Crop", which is intended to boost crop intensity by 7% with efficient water use in the agricultural sector, thereby potentially stimulating the demand for herbicides.

Key Players:

Key Service Providers/Manufacturers

  • Bayer AG

  • BASF SE

  • Syngenta AG

  • Nufarm Limited

  • FMC Corporation

  • Adama Agricultural Solutions Ltd.

  • UPL Limited

  • Zhejiang YongNong BioSciences Co., Ltd.

  • Jiangsu Huangma Agrochemicals Co., Ltd.

  • Lier Chemical Co., Ltd.

  • Jiangsu Sevencontinent Green Chemical Co., Ltd.

  • Zhejiang Xinan Chemical Industrial Group Co., Ltd.

  • Shandong Weifang Rainbow Chemical Co., Ltd.

  • Jiangsu Good Harvest-Weien Agrochemical Co., Ltd.

  • Jiangsu Huifeng Agrochemical Co., Ltd.

  • Jiangsu Yangnong Chemical Co., Ltd.

  • Shandong Cynda Chemical Co., Ltd.

  • Jiangsu Changqing Agrochemical Co., Ltd.

  • Zhejiang Wynca Chemical Industry Group Co., Ltd.

  • Dow AgroSciences LLC

Recent Developments:

  • In March 2024, Bayer CropScience launched a superior performing liquid soluble formulation of glufosinate ammonium with beneficial environmental characteristics. According to the company, this new formulation supports the sustainability ambitions of the European Union through the European Green Deal.

  • in January 2024, The approval of three new glufosinate-resistant soybean varieties by The Chinese Ministry of Agriculture and Rural Affairs could lead to higher demand of glufosinate ammonium in the country.

    Glufosinate Ammonium Market Report Scope:

    Report Attributes Details

    Market Size in 2023

    USD 470.8  Million

    Market Size by 2032

    USD 1076.1    Million

    CAGR

    CAGR of9.6%  From 2024 to 2032

    Base Year

    2023

    Forecast Period

    2024-2032

    Historical Data

    2020-2022

    Report Scope & Coverage

    Market Size, Segments Analysis, Competitive  Landscape, Regional Analysis, DROC & SWOT Analysis, Forecast Outlook

    Key Segments

    •  By Crop (Non-GM Crops, Genetically Modified (GM) Crops)
    • By Form (Liqid, Dry)
    • By Application (Non-Agricultural, Agricultural)

    Regional Analysis/Coverage

    North America (US, Canada, Mexico), Europe (Eastern Europe [Poland, Romania, Hungary, Turkey, Rest of Eastern Europe] Western Europe] Germany, France, UK, Italy, Spain, Netherlands, Switzerland, Austria, Rest of Western Europe]), Asia Pacific (China, India, Japan, South Korea, Vietnam, Singapore, Australia, Rest of Asia Pacific), Middle East & Africa (Middle East [UAE, Egypt, Saudi Arabia, Qatar, Rest of Middle East], Africa [Nigeria, South Africa, Rest of Africa], Latin America (Brazil, Argentina, Colombia, Rest of Latin America)

    Company Profiles

    UPL Limited, Zhejiang YongNong BioSciences Co., Ltd., Jiangsu Huangma Agrochemicals Co., Ltd., Lier Chemical Co., Ltd., Jiangsu Sevencontinent Green Chemical Co., Ltd., Zhejiang Xinan Chemical Industrial Group Co., Ltd., Shandong Weifang Rainbow Chemical Co., Ltd., Jiangsu Good Harvest-Weien Agrochemical Co., Ltd., Jiangsu Huifeng Agrochemical Co., Ltd., Jiangsu Yangnong Chemical Co., Ltd., Shandong Cynda Chemical Co., Ltd., Jiangsu Changqing Agrochemical Co., Ltd., Zhejiang Wynca Chemical Industry Group Co., Ltd., Dow AgroSciences LLC..


Frequently Asked Questions

Ans. The projected market size for the Glufosinate Ammonium Market is USD 1076.5 Million by 2032.

Ans: The North American region dominated the Glufosinate Ammonium Market in 2023.

Ans. The CAGR of the Glufosinate Ammonium Market is 9.6% During the forecast period of 2024-2032.

Ans: Genetically Modified (GM) Crops dominated the Glufosinate Ammonium Market with 72% revenue share in 2023.

Ans: Growing adoption of genetically modified crops resistant to glufosinate ammonium enhances its demand for effective weed control.

Table Of Contents:

1. Introduction

1.1 Market Definition

1.2 Scope (Inclusion and Exclusions)

1.3 Research Assumptions

2. Executive Summary

2.1 Market Overview

2.2 Regional Synopsis

2.3 Competitive Summary

3. Research Methodology

3.1 Top-Down Approach

3.2 Bottom-up Approach

3.3. Data Validation

3.4 Primary Interviews

4. Market Dynamics Impact Analysis

4.1 Market Driving Factors Analysis

4.1.1 Drivers

4.1.2 Restraints

4.1.3 Opportunities

4.1.4 Challenges

4.2 PESTLE Analysis

4.3 Porter’s Five Forces Model

5. Statistical Insights and Trends Reporting

5.1 Global Production & Consumption Volume (2020-2032)

5.2 Agricultural Adoption Rates (2023)

5.3 Regulatory Landscape & Compliance (2023-2032)

5.4 Environmental & Health Impact Studies (2023-2032)

6. Competitive Landscape

6.1 List of Major Companies, By Region

6.2 Market Share Analysis, By Region

6.3 Product Benchmarking

6.3.1 Product specifications and features

6.3.2 Pricing

6.4 Strategic Initiatives

6.4.1 Marketing and promotional activities

6.4.2 Distribution and Supply Chain Strategies

6.4.3 Expansion plans and new Product launches

6.4.4 Strategic partnerships and collaborations

6.5 Technological Advancements

6.6 Market Positioning and Branding

7. Glufosinate Ammonium Market Segmentation, by Crop

7.1 Chapter Overview

7.2 Non-GM Crops

7.2.1 Non-GM Crops Market Trends Analysis (2020-2032)

7.2.2 Non-GM Crops Market Size Estimates and Forecasts to 2032 (USD Million)

7.3 Genetically Modified (GM) Crops

     7.3.1 Genetically Modified (GM) Crops Market Trends Analysis (2020-2032)

           7.3.2 Genetically Modified (GM) Crops Market Size Estimates and Forecasts to 2032 (USD Million)

8. Glufosinate Ammonium Market Segmentation, by Form

8.1 Chapter Overview

8.2 Dry

     8.2.1 Dry Market Trends Analysis (2020-2032)

           8.2.2 Dry Market Size Estimates and Forecasts to 2032 (USD Million)

8.3 Liquid

      8.3.1 Liquid Market Trends Analysis (2020-2032)

           8.3.2 Liquid Market Size Estimates and Forecasts to 2032 (USD Million)

9. Glufosinate Ammonium Market Segmentation, by Application

9.1 Chapter Overview

9.2 Non-Agricultural

        9.2.1 Non-Agricultural Market Trends Analysis (2020-2032)

9.2.2 Non-Agricultural Market Size Estimates and Forecasts to 2032 (USD Million)

9.3 Agricultural

        9.3.1 Agricultural Market Trends Analysis (2020-2032)

9.3.2 Agricultural Market Size Estimates and Forecasts to 2032 (USD Million)

    10. Regional Analysis

10.1 Chapter Overview

10.2 North America

10.2.1 Trends Analysis

10.2.2 North America Glufosinate Ammonium Market Estimates and Forecasts, by Country (2020-2032) (USD Million)

10.2.3 North America Glufosinate Ammonium Market Estimates and Forecasts, by Crop (2020-2032) (USD Million)  

10.2.4 North America Glufosinate Ammonium Market Estimates and Forecasts, by Form (2020-2032) (USD Million)

10.2.5 North America Glufosinate Ammonium Market Estimates and Forecasts, by Application (2020-2032) (USD Million)

10.2.6 USA

10.2.6.1 USA Glufosinate Ammonium Market Estimates and Forecasts, by Crop (2020-2032) (USD Million)

10.2.6.2 USA Glufosinate Ammonium Market Estimates and Forecasts, by Form (2020-2032) (USD Million)

10.2.6.3 USA Glufosinate Ammonium Market Estimates and Forecasts, by Application (2020-2032) (USD Million)

10.2.7 Canada

10.2.7.1 Canada Glufosinate Ammonium Market Estimates and Forecasts, by Crop (2020-2032) (USD Million)

10.2.7.2 Canada Glufosinate Ammonium Market Estimates and Forecasts, by Form (2020-2032) (USD Million)

10.2.7.3 Canada Glufosinate Ammonium Market Estimates and Forecasts, by Application (2020-2032) (USD Million)

10.2.8 Mexico

10.2.8.1 Mexico Glufosinate Ammonium Market Estimates and Forecasts, by Crop (2020-2032) (USD Million)

10.2.8.2 Mexico Glufosinate Ammonium Market Estimates and Forecasts, by Form (2020-2032) (USD Million)

10.2.8.3 Mexico Glufosinate Ammonium Market Estimates and Forecasts, by Application (2020-2032) (USD Million)

10.3 Europe

10.3.1 Eastern Europe

10.3.1.1 Trends Analysis

10.3.1.2 Eastern Europe Glufosinate Ammonium Market Estimates and Forecasts, by Country (2020-2032) (USD Million)

10.3.1.3 Eastern Europe Glufosinate Ammonium Market Estimates and Forecasts, by Crop (2020-2032) (USD Million)  

10.3.1.4 Eastern Europe Glufosinate Ammonium Market Estimates and Forecasts, by Form (2020-2032) (USD Million)

10.3.1.5 Eastern Europe Glufosinate Ammonium Market Estimates and Forecasts, by Application (2020-2032) (USD Million)

10.3.1.6 Poland

10.3.1.6.1 Poland Glufosinate Ammonium Market Estimates and Forecasts, by Crop (2020-2032) (USD Million)

10.3.1.6.2 Poland Glufosinate Ammonium Market Estimates and Forecasts, by Form (2020-2032) (USD Million)

10.3.1.6.3 Poland Glufosinate Ammonium Market Estimates and Forecasts, by Application (2020-2032) (USD Million)

10.3.1.7 Romania

10.3.1.7.1 Romania Glufosinate Ammonium Market Estimates and Forecasts, by Crop (2020-2032) (USD Million)

10.3.1.7.2 Romania Glufosinate Ammonium Market Estimates and Forecasts, by Form (2020-2032) (USD Million)

10.3.1.7.3 Romania Glufosinate Ammonium Market Estimates and Forecasts, by Application (2020-2032) (USD Million)

10.3.1.8 Hungary

10.3.1.8.1 Hungary Glufosinate Ammonium Market Estimates and Forecasts, by Crop (2020-2032) (USD Million)

10.3.1.8.2 Hungary Glufosinate Ammonium Market Estimates and Forecasts, by Form (2020-2032) (USD Million)

10.3.1.8.3 Hungary Glufosinate Ammonium Market Estimates and Forecasts, by Application (2020-2032) (USD Million)

10.3.1.9 Turkey

10.3.1.9.1 Turkey Glufosinate Ammonium Market Estimates and Forecasts, by Crop (2020-2032) (USD Million)

10.3.1.9.2 Turkey Glufosinate Ammonium Market Estimates and Forecasts, by Form (2020-2032) (USD Million)

10.3.1.9.3 Turkey Glufosinate Ammonium Market Estimates and Forecasts, by Application (2020-2032) (USD Million)

10.3.1.10 Rest of Eastern Europe

10.3.1.10.1 Rest of Eastern Europe Glufosinate Ammonium Market Estimates and Forecasts, by Crop (2020-2032) (USD Million)

10.3.1.10.2 Rest of Eastern Europe Glufosinate Ammonium Market Estimates and Forecasts, by Form (2020-2032) (USD Million)

10.3.1.10.3 Rest of Eastern Europe Glufosinate Ammonium Market Estimates and Forecasts, by Application (2020-2032) (USD Million)

10.3.2 Western Europe

10.3.2.1 Trends Analysis

10.3.2.2 Western Europe Glufosinate Ammonium Market Estimates and Forecasts, by Country (2020-2032) (USD Million)

10.3.2.3 Western Europe Glufosinate Ammonium Market Estimates and Forecasts, by Crop (2020-2032) (USD Million)  

10.3.2.4 Western Europe Glufosinate Ammonium Market Estimates and Forecasts, by Form (2020-2032) (USD Million)

10.3.2.5 Western Europe Glufosinate Ammonium Market Estimates and Forecasts, by Application (2020-2032) (USD Million)

10.3.2.6 Germany

10.3.2.6.1 Germany Glufosinate Ammonium Market Estimates and Forecasts, by Crop (2020-2032) (USD Million)

10.3.2.6.2 Germany Glufosinate Ammonium Market Estimates and Forecasts, by Form (2020-2032) (USD Million)

10.3.2.6.3 Germany Glufosinate Ammonium Market Estimates and Forecasts, by Application (2020-2032) (USD Million)

10.3.2.7 France

10.3.2.7.1 France Glufosinate Ammonium Market Estimates and Forecasts, by Crop (2020-2032) (USD Million)

10.3.2.7.2 France Glufosinate Ammonium Market Estimates and Forecasts, by Form (2020-2032) (USD Million)

10.3.2.7.3 France Glufosinate Ammonium Market Estimates and Forecasts, by Application (2020-2032) (USD Million)

10.3.2.8 UK

10.3.2.8.1 UK Glufosinate Ammonium Market Estimates and Forecasts, by Crop (2020-2032) (USD Million)

10.3.2.8.2 UK Glufosinate Ammonium Market Estimates and Forecasts, by Form (2020-2032) (USD Million)

10.3.2.8.3 UK Glufosinate Ammonium Market Estimates and Forecasts, by Application (2020-2032) (USD Million)

10.3.2.9 Italy

10.3.2.9.1 Italy Glufosinate Ammonium Market Estimates and Forecasts, by Crop (2020-2032) (USD Million)

10.3.2.9.2 Italy Glufosinate Ammonium Market Estimates and Forecasts, by Form (2020-2032) (USD Million)

10.3.2.9.3 Italy Glufosinate Ammonium Market Estimates and Forecasts, by Application (2020-2032) (USD Million)

10.3.2.10 Spain

10.3.2.10.1 Spain Glufosinate Ammonium Market Estimates and Forecasts, by Crop (2020-2032) (USD Million)

10.3.2.10.2 Spain Glufosinate Ammonium Market Estimates and Forecasts, by Form (2020-2032) (USD Million)

10.3.2.10.3 Spain Glufosinate Ammonium Market Estimates and Forecasts, by Application (2020-2032) (USD Million)

10.3.2.11 Netherlands

10.3.2.11.1 Netherlands Glufosinate Ammonium Market Estimates and Forecasts, by Crop (2020-2032) (USD Million)

10.3.2.11.2 Netherlands Glufosinate Ammonium Market Estimates and Forecasts, by Form (2020-2032) (USD Million)

10.3.2.11.3 Netherlands Glufosinate Ammonium Market Estimates and Forecasts, by Application (2020-2032) (USD Million)

10.3.2.12 Switzerland

10.3.2.12.1 Switzerland Glufosinate Ammonium Market Estimates and Forecasts, by Crop (2020-2032) (USD Million)

10.3.2.12.2 Switzerland Glufosinate Ammonium Market Estimates and Forecasts, by Form (2020-2032) (USD Million)

10.3.2.12.3 Switzerland Glufosinate Ammonium Market Estimates and Forecasts, by Application (2020-2032) (USD Million)

10.3.2.13 Austria

10.3.2.13.1 Austria Glufosinate Ammonium Market Estimates and Forecasts, by Crop (2020-2032) (USD Million)

10.3.2.13.2 Austria Glufosinate Ammonium Market Estimates and Forecasts, by Form (2020-2032) (USD Million)

10.3.2.13.3 Austria Glufosinate Ammonium Market Estimates and Forecasts, by Application (2020-2032) (USD Million)

10.3.2.14 Rest of Western Europe

10.3.2.14.1 Rest of Western Europe Glufosinate Ammonium Market Estimates and Forecasts, by Crop (2020-2032) (USD Million)

10.3.2.14.2 Rest of Western Europe Glufosinate Ammonium Market Estimates and Forecasts, by Form (2020-2032) (USD Million)

10.3.2.14.3 Rest of Western Europe Glufosinate Ammonium Market Estimates and Forecasts, by Application (2020-2032) (USD Million)

10.4 Asia Pacific

10.4.1 Trends Analysis

10.4.2 Asia Pacific Glufosinate Ammonium Market Estimates and Forecasts, by Country (2020-2032) (USD Million)

10.4.3 Asia Pacific Glufosinate Ammonium Market Estimates and Forecasts, by Crop (2020-2032) (USD Million)  

10.4.4 Asia Pacific Glufosinate Ammonium Market Estimates and Forecasts, by Form (2020-2032) (USD Million)

10.4.5 Asia Pacific Glufosinate Ammonium Market Estimates and Forecasts, by Application (2020-2032) (USD Million)

10.4.6 China

10.4.6.1 China Glufosinate Ammonium Market Estimates and Forecasts, by Crop (2020-2032) (USD Million)

10.4.6.2 China Glufosinate Ammonium Market Estimates and Forecasts, by Form (2020-2032) (USD Million)

10.4.6.3 China Glufosinate Ammonium Market Estimates and Forecasts, by Application (2020-2032) (USD Million)

10.4.7 India

10.4.7.1 India Glufosinate Ammonium Market Estimates and Forecasts, by Crop (2020-2032) (USD Million)

10.4.7.2 India Glufosinate Ammonium Market Estimates and Forecasts, by Form (2020-2032) (USD Million)

10.4.7.3 India Glufosinate Ammonium Market Estimates and Forecasts, by Application (2020-2032) (USD Million)

10.4.8 Japan

10.4.8.1 Japan Glufosinate Ammonium Market Estimates and Forecasts, by Crop (2020-2032) (USD Million)

10.4.8.2 Japan Glufosinate Ammonium Market Estimates and Forecasts, by Form (2020-2032) (USD Million)

10.4.8.3 Japan Glufosinate Ammonium Market Estimates and Forecasts, by Application (2020-2032) (USD Million)

10.4.9 South Korea

10.4.9.1 South Korea Glufosinate Ammonium Market Estimates and Forecasts, by Crop (2020-2032) (USD Million)

10.4.9.2 South Korea Glufosinate Ammonium Market Estimates and Forecasts, by Form (2020-2032) (USD Million)

10.4.9.3 South Korea Glufosinate Ammonium Market Estimates and Forecasts, by Application (2020-2032) (USD Million)

10.4.10 Vietnam

10.4.10.1 Vietnam Glufosinate Ammonium Market Estimates and Forecasts, by Crop (2020-2032) (USD Million)

10.4.10.2 Vietnam Glufosinate Ammonium Market Estimates and Forecasts, by Form (2020-2032) (USD Million)

10.4.10.3 Vietnam Glufosinate Ammonium Market Estimates and Forecasts, by Application (2020-2032) (USD Million)

10.4.11 Singapore

10.4.11.1 Singapore Glufosinate Ammonium Market Estimates and Forecasts, by Crop (2020-2032) (USD Million)

10.4.11.2 Singapore Glufosinate Ammonium Market Estimates and Forecasts, by Form (2020-2032) (USD Million)

10.4.11.3 Singapore Glufosinate Ammonium Market Estimates and Forecasts, by Application (2020-2032) (USD Million)

10.4.12 Australia

10.4.12.1 Australia Glufosinate Ammonium Market Estimates and Forecasts, by Crop (2020-2032) (USD Million)

10.4.12.2 Australia Glufosinate Ammonium Market Estimates and Forecasts, by Form (2020-2032) (USD Million)

10.4.12.3 Australia Glufosinate Ammonium Market Estimates and Forecasts, by Application (2020-2032) (USD Million)

10.4.13 Rest of Asia Pacific

10.4.13.1 Rest of Asia Pacific Glufosinate Ammonium Market Estimates and Forecasts, by Crop (2020-2032) (USD Million)

10.4.13.2 Rest of Asia Pacific Glufosinate Ammonium Market Estimates and Forecasts, by Form (2020-2032) (USD Million)

10.4.13.3 Rest of Asia Pacific Glufosinate Ammonium Market Estimates and Forecasts, by Application (2020-2032) (USD Million)

10.5 Middle East and Africa

10.5.1 Middle East

10.5.1.1 Trends Analysis

10.5.1.2 Middle East Glufosinate Ammonium Market Estimates and Forecasts, by Country (2020-2032) (USD Million)

10.5.1.3 Middle East Glufosinate Ammonium Market Estimates and Forecasts, by Crop (2020-2032) (USD Million)  

10.5.1.4 Middle East Glufosinate Ammonium Market Estimates and Forecasts, by Form (2020-2032) (USD Million)

10.5.1.5 Middle East Glufosinate Ammonium Market Estimates and Forecasts, by Application (2020-2032) (USD Million)

10.5.1.6 UAE

10.5.1.6.1 UAE Glufosinate Ammonium Market Estimates and Forecasts, by Crop (2020-2032) (USD Million)

10.5.1.6.2 UAE Glufosinate Ammonium Market Estimates and Forecasts, by Form (2020-2032) (USD Million)

10.5.1.6.3 UAE Glufosinate Ammonium Market Estimates and Forecasts, by Application (2020-2032) (USD Million)

10.5.1.7 Egypt

10.5.1.7.1 Egypt Glufosinate Ammonium Market Estimates and Forecasts, by Crop (2020-2032) (USD Million)

10.5.1.7.2 Egypt Glufosinate Ammonium Market Estimates and Forecasts, by Form (2020-2032) (USD Million)

10.5.1.7.3 Egypt Glufosinate Ammonium Market Estimates and Forecasts, by Application (2020-2032) (USD Million)

10.5.1.8 Saudi Arabia

10.5.1.8.1 Saudi Arabia Glufosinate Ammonium Market Estimates and Forecasts, by Crop (2020-2032) (USD Million)

10.5.1.8.2 Saudi Arabia Glufosinate Ammonium Market Estimates and Forecasts, by Form (2020-2032) (USD Million)

10.5.1.8.3 Saudi Arabia Glufosinate Ammonium Market Estimates and Forecasts, by Application (2020-2032) (USD Million)

10.5.1.9 Qatar

10.5.1.9.1 Qatar Glufosinate Ammonium Market Estimates and Forecasts, by Crop (2020-2032) (USD Million)

10.5.1.9.2 Qatar Glufosinate Ammonium Market Estimates and Forecasts, by Form (2020-2032) (USD Million)

10.5.1.9.3 Qatar Glufosinate Ammonium Market Estimates and Forecasts, by Application (2020-2032) (USD Million)

10.5.1.10 Rest of Middle East

10.5.1.10.1 Rest of Middle East Glufosinate Ammonium Market Estimates and Forecasts, by Crop (2020-2032) (USD Million)

10.5.1.10.2 Rest of Middle East Glufosinate Ammonium Market Estimates and Forecasts, by Form (2020-2032) (USD Million)

10.5.1.10.3 Rest of Middle East Glufosinate Ammonium Market Estimates and Forecasts, by Application (2020-2032) (USD Million)

10.5.2 Africa

10.5.2.1 Trends Analysis

10.5.2.2 Africa Glufosinate Ammonium Market Estimates and Forecasts, by Country (2020-2032) (USD Million)

10.5.2.3 Africa Glufosinate Ammonium Market Estimates and Forecasts, by Crop (2020-2032) (USD Million)  

10.5.2.4 Africa Glufosinate Ammonium Market Estimates and Forecasts, by Form (2020-2032) (USD Million)

10.5.2.5 Africa Glufosinate Ammonium Market Estimates and Forecasts, by Application (2020-2032) (USD Million)

10.5.2.6 South Africa

10.5.2.6.1 South Africa Glufosinate Ammonium Market Estimates and Forecasts, by Crop (2020-2032) (USD Million)

10.5.2.6.2 South Africa Glufosinate Ammonium Market Estimates and Forecasts, by Form (2020-2032) (USD Million)

10.5.2.6.3 South Africa Glufosinate Ammonium Market Estimates and Forecasts, by Application (2020-2032) (USD Million)

10.5.2.7 Nigeria

10.5.2.7.1 Nigeria Glufosinate Ammonium Market Estimates and Forecasts, by Crop (2020-2032) (USD Million)

10.5.2.7.2 Nigeria Glufosinate Ammonium Market Estimates and Forecasts, by Form (2020-2032) (USD Million)

10.5.2.7.3 Nigeria Glufosinate Ammonium Market Estimates and Forecasts, by Application (2020-2032) (USD Million)

10.5.2.8 Rest of Africa

10.5.2.8.1 Rest of Africa Glufosinate Ammonium Market Estimates and Forecasts, by Crop (2020-2032) (USD Million)

10.5.2.8.2 Rest of Africa Glufosinate Ammonium Market Estimates and Forecasts, by Form (2020-2032) (USD Million)

10.5.2.8.3 Rest of Africa Glufosinate Ammonium Market Estimates and Forecasts, by Application (2020-2032) (USD Million)

10.6 Latin America

10.6.1 Trends Analysis

10.6.2 Latin America Glufosinate Ammonium Market Estimates and Forecasts, by Country (2020-2032) (USD Million)

10.6.3 Latin America Glufosinate Ammonium Market Estimates and Forecasts, by Crop (2020-2032) (USD Million)  

10.6.4 Latin America Glufosinate Ammonium Market Estimates and Forecasts, by Form (2020-2032) (USD Million)

10.6.5 Latin America Glufosinate Ammonium Market Estimates and Forecasts, by Application (2020-2032) (USD Million)

10.6.6 Brazil

10.6.6.1 Brazil Glufosinate Ammonium Market Estimates and Forecasts, by Crop (2020-2032) (USD Million)

10.6.6.2 Brazil Glufosinate Ammonium Market Estimates and Forecasts, by Form (2020-2032) (USD Million)

10.6.6.3 Brazil Glufosinate Ammonium Market Estimates and Forecasts, by Application (2020-2032) (USD Million)

10.6.7 Argentina

10.6.7.1 Argentina Glufosinate Ammonium Market Estimates and Forecasts, by Crop (2020-2032) (USD Million)

10.6.7.2 Argentina Glufosinate Ammonium Market Estimates and Forecasts, by Form (2020-2032) (USD Million)

10.6.7.3 Argentina Glufosinate Ammonium Market Estimates and Forecasts, by Application (2020-2032) (USD Million)

10.6.8 Colombia

10.6.8.1 Colombia Glufosinate Ammonium Market Estimates and Forecasts, by Crop (2020-2032) (USD Million)

10.6.8.2 Colombia Glufosinate Ammonium Market Estimates and Forecasts, by Form (2020-2032) (USD Million)

10.6.8.3 Colombia Glufosinate Ammonium Market Estimates and Forecasts, by Application (2020-2032) (USD Million)

10.6.9 Rest of Latin America

10.6.9.1 Rest of Latin America Glufosinate Ammonium Market Estimates and Forecasts, by Crop (2020-2032) (USD Million)

10.6.9.2 Rest of Latin America Glufosinate Ammonium Market Estimates and Forecasts, by Form (2020-2032) (USD Million)

10.6.9.3 Rest of Latin America Glufosinate Ammonium Market Estimates and Forecasts, by Application (2020-2032) (USD Million)

11. Company Profiles

11.1 Bayer AG

              11.1.1 Company Overview

11.1.2 Financial

11.1.3 Product/ Services Offered

11.1.4 SWOT Analysis

11.2 BASF SE

             11.2.1 Company Overview

11.2.2 Financial

11.2.3 Product/ Services Offered

11.2.4 SWOT Analysis

11.3 Syngenta AG

             11.3.1 Company Overview

11.3.2 Financial

11.3.3 Product/ Services Offered

11.3.4 SWOT Analysis

11.4 Nufarm Limited

            11.4.1 Company Overview

11.4.2 Financial

11.4.3 Product/ Services Offered

11.4.4 SWOT Analysis

11.5 FMC Corporation

11.5.1 Company Overview

11.5.2 Financial

11.5.3 Product/ Services Offered

11.5.4 SWOT Analysis

11.6 Adama Agricultural Solutions Ltd.

             11.6.1 Company Overview

11.6.2 Financial

11.6.3 Product/ Services Offered

11.6.4 SWOT Analysis

11.7 UPL Limited

             11.7.1 Company Overview

11.7.2 Financial

11.7.3 Product/ Services Offered

11.7.4 SWOT Analysis

11.8 Zhejiang YongNong BioSciences Co., Ltd.

             11.8.1 Company Overview

11.8.2 Financial

11.8.3 Product/ Services Offered

11.8.4 SWOT Analysis

11.9 Jiangsu Huangma Agrochemicals Co., Ltd.

             11.9.1 Company Overview

11.9.2 Financial

11.9.3 Product/ Services Offered

11.9.4 SWOT Analysis

11.10 Lier Chemical Co., Ltd.

             11.10.1 Company Overview

11.10.2 Financial

11.10.3 Product/ Services Offered

11.10.4 SWOT Analysis

12. Use Cases and Best Practices

13. Conclusion

An accurate research report requires proper strategizing as well as implementation. There are multiple factors involved in the completion of good and accurate research report and selecting the best methodology to compete the research is the toughest part. Since the research reports we provide play a crucial role in any company’s decision-making process, therefore we at SNS Insider always believe that we should choose the best method which gives us results closer to reality. This allows us to reach at a stage wherein we can provide our clients best and accurate investment to output ratio.

Each report that we prepare takes a timeframe of 350-400 business hours for production. Starting from the selection of titles through a couple of in-depth brain storming session to the final QC process before uploading our titles on our website we dedicate around 350 working hours. The titles are selected based on their current market cap and the foreseen CAGR and growth.


The 5 steps process:

Step 1: Secondary Research:

Secondary Research or Desk Research is as the name suggests is a research process wherein, we collect data through the readily available information. In this process we use various paid and unpaid databases which our team has access to and gather data through the same. This includes examining of listed companies’ annual reports, Journals, SEC filling etc. Apart from this our team has access to various associations across the globe across different industries. Lastly, we have exchange relationships with various university as well as individual libraries.

Secondary Research

Step 2: Primary Research

When we talk about primary research, it is a type of study in which the researchers collect relevant data samples directly, rather than relying on previously collected data.  This type of research is focused on gaining content specific facts that can be sued to solve specific problems. Since the collected data is fresh and first hand therefore it makes the study more accurate and genuine.

We at SNS Insider have divided Primary Research into 2 parts.

Part 1 wherein we interview the KOLs of major players as well as the upcoming ones across various geographic regions. This allows us to have their view over the market scenario and acts as an important tool to come closer to the accurate market numbers. As many as 45 paid and unpaid primary interviews are taken from both the demand and supply side of the industry to make sure we land at an accurate judgement and analysis of the market.

This step involves the triangulation of data wherein our team analyses the interview transcripts, online survey responses and observation of on filed participants. The below mentioned chart should give a better understanding of the part 1 of the primary interview.

Primary Research

Part 2: In this part of primary research the data collected via secondary research and the part 1 of the primary research is validated with the interviews from individual consultants and subject matter experts.

Consultants are those set of people who have at least 12 years of experience and expertise within the industry whereas Subject Matter Experts are those with at least 15 years of experience behind their back within the same space. The data with the help of two main processes i.e., FGDs (Focused Group Discussions) and IDs (Individual Discussions). This gives us a 3rd party nonbiased primary view of the market scenario making it a more dependable one while collation of the data pointers.

Step 3: Data Bank Validation

Once all the information is collected via primary and secondary sources, we run that information for data validation. At our intelligence centre our research heads track a lot of information related to the market which includes the quarterly reports, the daily stock prices, and other relevant information. Our data bank server gets updated every fortnight and that is how the information which we collected using our primary and secondary information is revalidated in real time.

Data Bank Validation

Step 4: QA/QC Process

After all the data collection and validation our team does a final level of quality check and quality assurance to get rid of any unwanted or undesired mistakes. This might include but not limited to getting rid of the any typos, duplication of numbers or missing of any important information. The people involved in this process include technical content writers, research heads and graphics people. Once this process is completed the title gets uploader on our platform for our clients to read it.

Step 5: Final QC/QA Process:

This is the last process and comes when the client has ordered the study. In this process a final QA/QC is done before the study is emailed to the client. Since we believe in giving our clients a good experience of our research studies, therefore, to make sure that we do not lack at our end in any way humanly possible we do a final round of quality check and then dispatch the study to the client.

Key Segments:

 By Crop

  • Non-GM Crops

  • Genetically Modified (GM) Crops

By Form

  • Dry

  • Liquid

By Application

  • Non-Agricultural

  • Agricultural

Request for Segment Customization as per your Business Requirement: Segment Customization Request

Regional Coverage:

North America

  • US

  • Canada

  • Mexico

Europe

  • Eastern Europe

    • Poland

    • Romania

    • Hungary

    • Turkey

    • Rest of Eastern Europe

  • Western Europe

    • Germany

    • France

    • UK

    • Italy

    • Spain

    • Netherlands

    • Switzerland

    • Austria

    • Rest of Western Europe

Asia Pacific

  • China

  • India

  • Japan

  • South Korea

  • Vietnam

  • Singapore

  • Australia

  • Rest of Asia Pacific

Middle East & Africa

  • Middle East

    • UAE

    • Egypt

    • Saudi Arabia

    • Qatar

    • Rest of Middle East

  • Africa

    • Nigeria

    • South Africa

    • Rest of Africa

  • Latin America

  • Brazil

  • Argentina

  • Colombia

  • Rest of Latin America 

Request for Country Level Research Report: Country Level Customization Request

Available Customization


With the given market data, SNS Insider offers customization as per the company’s specific needs. The following customization options are available for the report:

  • Product Analysis

  • Criss-Cross segment analysis (e.g. Product X Application)

  • Product Matrix which gives a detailed comparison of the product portfolio of each company

  • Geographic Analysis

  • Additional countries in any of the regions

  • Company Information

  • Detailed analysis and profiling of additional market players (Up to five)


  •            5000 (33% Discount)


  •            8950 (40% Discount)


  •            3050 (23% Discount)

Start a Conversation

Hi! Click one of our member below to chat on Phone