image

GCC in the Retail and Consumer Goods Market Report Scope & Overview:

Global Capabilities Centre in the Retail and Consumer Goods Market Revenue Analysis

Get More Information on Global Capabilities Centre in the Retail and Consumer Goods Market - Request Sample Report

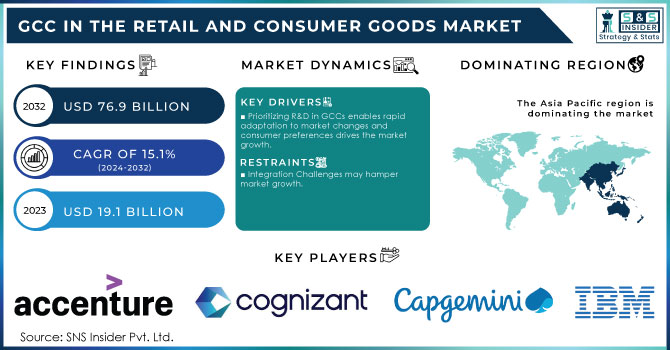
The Global Capabilities Centre in the Retail and Consumer Goods Market Size was valued at USD 19.1 Billion in 2023. It is expected to grow to USD 76.9 Billion by 2032 and grow at a CAGR of 15.1% over the forecast period of 2024-2032.

Automation and AI technologies are revolutionizing operations in various segments and retail and consumer goods are one of the sectors that significantly enhance the efficiency and accuracy of various processes. AI-driven algorithms in inventory management forecast customer demand patterns, optimize stock levels, and eliminate excess inventory to ensure that retail companies can address consumers’ needs promptly and at the lowest possible costs. In customer service, chatbots offer immediate and round-the-clock support, support to all clients, answer inquiries, and complete transactions with no human involvement. This ensures that no client’s needs are left unaddressed, and frees human resources to perform more high-priority jobs. In addition, robotic process automation is employed for quick and effortless processing of orders, maintaining, and handling invoices. This results in reduced turnaround times and lower error rates. Thus, employing these technologies can help RCG companies attain an agile and flexible operational framework while ensuring that overall customer satisfaction continues to be the topmost priority in a demanding and rapidly changing market.

For instance, in October 2024, Accenture acquired Joshua Tree Group to enhance its distribution center performance. It will help Accenture to enhance productivity and efficiency for its retail, consumer goods, and other product-based industry clients' distribution centers. It also enhances Accenture's ability to design and create increasingly autonomous supply chains in which AI-powered systems drive greater labor productivity, inventory optimization, and customer order fulfillment.

GCC in the Retail and Consumer Goods (RCG) sector is sitting at the point of a pattern shift, with data-driven decision-making as one of their cornerstones, consumer insights being significant, and supply chain optimization an imperative. Utilizing advanced data analytics, GCCs can have in-depth insights into consumer behavior and preferences and design marketing campaigns directed toward specific audience segments. This data-driven model allows companies to maximize their product portfolio in terms of real consumer demand and provide consumers with an improved experience, leading to the improvement of satisfaction & brand loyalty. Such proactive management helps organizations to sidestep stock out and excess inventory opportunities, ultimately reducing costs, and resulting in operational efficiencies. Real-time supply chain data analytics also allow businesses to better prepare themselves against disruption or changes in consumer demand, furthering resilience and contributing to sustained growth and competitiveness in an ever-changing market.

According to the U.S. Census Bureau, e-commerce sales in the United States grew by 14.2% in 2021, highlighting the importance of understanding consumer preferences in a digital-first environment.

GCC in the Retail and Consumer Goods Market Dynamics

Drivers

  • Prioritizing R&D in GCCs enables rapid adaptation to market changes and consumer preferences drives the market growth.

  • GCCs implement digital solutions that facilitate seamless omnichannel integration driving market growth.

Global Capability Centers (GCCs) for digital solutions are positioned to react and enable seamless omnichannel integration. 2. GCCs utilize AI, data analytics, and the cloud to provide consistent customer experiences across online, mobile, and in-store channels. This allows businesses to provide consistent and personalized on-message interactions that improve customer satisfaction and loyalty. GCCs can be better equipped to react to customer needs and preferences instantaneously, by streamlining operations as well as communications between different touchpoints. Along with that, the tracking of data across channels enables organizations to identify areas for effective inventory and service delivery optimization, enhancing decision-making capabilities, improving productivity, and increasing revenue. The adaptability of GCCs and the ease of digital solutions have become an essential part of coping with these demands, thereby facilitating overall market growth along with increasing consumer expectations for a seamless shopping experience.

A recent report from NASSCOM of Global Capability Centers (GCCs) in India, showcased their shift from traditional back-office functions to advanced roles in innovation and technology adoption. As of 2022, India is home to over 1,300 GCCs, employing more than 1.3 million professionals and contributing approximately 1% of the country's GDP​. These centers are pivotal in driving customer-centricity by leveraging technology to enhance product development, customer insights, and overall user experience.

Table: How GCCs implement digital solutions to facilitate seamless omnichannel integration and drive market growth

Digital Solution Functionality Impact on Market Growth
Customer Relationship Management (CRM) Centralizes customer data, enabling personalized marketing and sales efforts. Increases customer retention and satisfaction, leading to higher sales.
Data Analytics Platforms Analyzes customer behavior and preferences across channels. Provides actionable insights, enabling businesses to tailor offerings effectively.
Enterprise Resource Planning (ERP) Integrates all business processes, providing a unified view of operations. Enhances efficiency, reduces costs, and improves inventory management.
Supply Chain Management (SCM) Systems Streamlines logistics and inventory management across channels. Improves responsiveness to demand fluctuations, reducing stockouts and overstock situations.
E-commerce Platforms Facilitates online sales and integrates with physical store operations. Expands market reach and increases sales opportunities through online channels.
Mobile Applications Offers personalized shopping experiences and services via mobile devices. Enhances customer engagement and convenience, driving higher sales conversions.
Artificial Intelligence (AI) Tools Enables personalized recommendations and customer service automation. Improves customer experience, leading to increased loyalty and repeat purchases.
Content Management Systems (CMS) Manages digital content across various channels. Ensures consistent messaging and branding, enhancing customer trust and recognition.
Social Media Integration Tools Connects various social media platforms for cohesive marketing campaigns. Expands brand visibility and drives traffic to e-commerce platforms, boosting sales.
Chatbots and Virtual Assistants Provides instant customer support and product recommendations. Increases customer satisfaction and engagement, leading to higher conversion rates.

Restraint

  • Integration Challenges may hamper market growth.

One of the bigger pain points for Global Capability Centers (GCCs) is integration challenges; to integrate the new operations with existing business processes and systems. Not only does there need to be technology compatibility, but the corporate cultures as well as the corporate strategy also need to come together for a smooth transition. If GCCs fail to harmonize their functions with the overall objectives of the enterprise, this can result in workflow inefficiencies and communication dissonances between teams. But that seldom leads to an increased speed of reactiveness to changes in the market, which is by definition a huge negative in the converging and technologically driven retail and consumer goods space. However, if a GCC develops some cutting-edge solutions or insights and these are not communicated with other departments or stakeholders or integrated into their decision-making frameworks, then prime opportunities are lost to improve customer experience and drive operational efficiency. To sum up, GCCs that are not integrated into the organization will end as islands where they do not ensure optimal performance and competitiveness for the company.


Market Opportunity

Trend Opportunity
E-commerce Growth Building robust e-commerce platforms, digital marketing expertise, and omnichannel strategies.
Supply Chain Disruptions Implementing resilient supply chain management, risk mitigation strategies, and advanced analytics.
Sustainability and Ethical Sourcing Developing sustainable sourcing practices, carbon footprint reduction initiatives, and ethical supply chain management.
Data-Driven Insights Leveraging data analytics and AI to optimize inventory management, personalize customer experiences, and improve demand forecasting.
Emerging Technologies Exploring opportunities in areas like blockchain, IoT, and augmented reality to enhance customer experiences and operational efficiency.
Customer Experience Focusing on customer-centric initiatives, personalization, and seamless omnichannel experiences.
Talent Acquisition and Development Building a skilled workforce with expertise in digital technologies, data analytics, and supply chain management.

GCC in the Retail and Consumer Goods Market Segmentation Overview

By Industry Verticals

Food & Beverage held the largest market share around 48 % in 2023. The reason is the sheer size and palpitating demand in the food and beverage industry. Emerging domains like this, which require continuous supply chain management, customer service operations, digital marketing, and analytics drive the demand for GCC services in such sectors. Food and Beverage companies are also keen on achieving operational efficiencies and the entire digital transformation journey, so they have been early adopters of Global Capabilities Centres.

Fashion & Apparel and Home Goods are also strongly represented but typically command smaller market shares in the GCC landscape, more design-driven supply chain logistics, and consumer engagement strategies.

By Customer Segment

Large Enterprises held the largest market share around 32% in 2023. The Global Capabilities Centre (GCC) segment in Retail and Consumer Goods is largely led by large enterprises with a wide range of operations, a worldwide presence covering diverse geography, and a complicated supply chain. Multinational retailer’s consumer goods companies and even local enterprises need to have a rigorous support system that can handle a whole spectrum of processes including customer service, supply chain management, IT services, data analytics, and digital marketing. Their operation scale requires advanced capabilities and resources that GCCs provide at scale through more efficient processes, cost efficiencies, and skilled specialized labor across various regions of the globe. Large enterprises are also known to lead the digital transformation journey, leveraging GCCs for innovation, and customer experience and remaining competitive in the changing market. Due to their high budgets and the requirement for resetting optimization, they are trendsetter users of GCC support in way in the retail and consumer goods domain.

By Service

Supply Chain Management held the largest market share 38% in 2023. This is due to this most critical component of ensuring products are moved seamlessly between manufacturers and consumers. Given that the entire automotive industry is built around squeezing more juice from higher inventory turnover, lower cost of ownership, and faster door-to-door delivery, supply chain management will be crucial to retaining competitiveness. GCCs facilitate greater control over the end-to-end supply chain, with real-time tracking, demand forecasting, procurement; inventory management, and distribution on a global basis.

Retail and consumer goods organizations have a complex supply network and often run across countries' markets that require coordination in multiple regions. For such companies, GCCs promise greater operating efficiencies, cost savings, and agility to address a world with rapidly fluctuating consumer demand and evolving market conditions. There has been an increased usage of digital technologies like artificial intelligence (AI), machine learning (ML), and data analytics in supply chain processes linked with the demand for specialized GCC services.

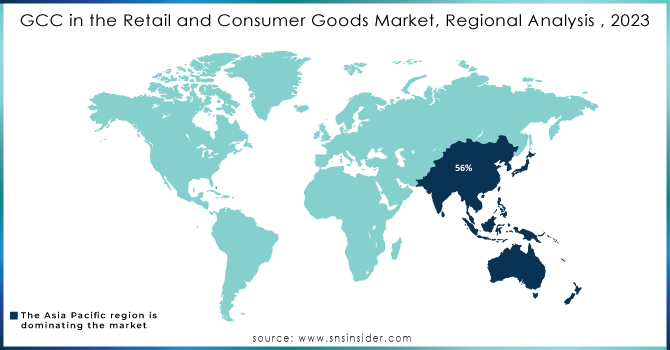
GCC in the Retail and Consumer Goods Market Regional Analysis

Asia Pacific held the largest market share around 56% in 2023. The GCC market in Retail and Consumer Goods is the highest share of the global market active in the Asia-Pacific region, as it consistently offers cost advantages along with a skilled workforce and strong infrastructure. Due to a significant chunk of the English-speaking workforce and the comparatively lower operational costs, GCCs are primarily located in nations such as India and the Philippines. As per the report by the Ministry of Electronics & Information Technology (2023), India has more than 1400 GCCs which contribute over USD 35 billion to the economy and growing at 11% YoY. Furthermore, rapid digitalization in the Asia-Pacific region improves operational efficiencies for global enterprises. The incentivization provided by the governments like the GCC 2.0 initiative of India focused on high-value services, and by the Philippines in the form of tax during setting-up centers make their dominance. Its scalability and cost-effectiveness have made the region the location of choice for multinationals to set up or grow their GCC.

GCC-in-the-Retail-and-Consumer-Goods-Market-Regional-Analysis--2023

Need Any Customization Research On GCC in the Retail and Consumer Goods Market- Inquiry Now

Key Players in GCC in the Retail and Consumer Goods Market

  • Accenture

  • Tata Consultancy Services (TCS) 

  • Wipro

  • Infosys

  • IBM

  • Capgemini

  • Deloitte

  • Cognizant

  • HCL Technologies

  • Genpact

  • Tech Mahindra

  • Oracle

  • SAP

  • DXC Technology

  • Atos

  • Cognizant Softvision

  • NTT Data

  • EPAM Systems

  • L&T Infotech (LTI)

  • KPMG

Key Users

  • Amazon (Amazon Prime, Amazon Fresh)

  • Walmart (Walmart Marketplace, Walmart Grocery)

  • Procter & Gamble (P&G Everyday)

  • Unilever (Unilever Sustainable Living Plan)

  • Coca-Cola (Coca-Cola Freestyle)

  • PepsiCo (PepsiCo Foods, Gatorade)

  • Nestlé (Nestlé Health Science)

  • Target (Target App, Target Circle)

  • L'Oréal (L'Oréal Professional Products)

  • Johnson & Johnson (Johnson's Baby, Neutrogena)

  • IKEA (IKEA Place App, IKEA Family)

  • Adidas (Adidas App, Confirmed)

  • Nike (Nike App, Nike Training Club)

  • Zara (Zara Online, Zara App)

  • H&M (H&M Online Store, H&M App)

  • Costco (Costco Online, Costco App)

GCC in the Retail and Consumer Goods Market Report Scope

Report Attributes Details
Market Size in 2023 US$ 19.1 Billion
Market Size by 2032 US$ 76.9 Billion
CAGR CAGR of 15.1% From 2024 to 2032
Base Year 2023
Forecast Period 2024-2032
Historical Data 2020-2022
Report Scope & Coverage Market Size, Segments Analysis, Competitive  Landscape, Regional Analysis, DROC & SWOT Analysis, Forecast Outlook
Key Segments • By Industry Verticals (Food and Beverage, Fashion and Apparel, Home Goods)
• By Customer segment (Large Enterprises, Small and Medium Enterprises)
• By Service (R&D Supply Chain Management, IT Service, Customer Support Services, Finance and Accounting, Marketing and Sales)
Regional Analysis/Coverage North America (US, Canada, Mexico), Europe (Eastern Europe [Poland, Romania, Hungary, Turkey, Rest of Eastern Europe] Western Europe [Germany, France, UK, Italy, Spain, Netherlands, Switzerland, Austria, Rest of Western Europe]), Asia Pacific (China, India, Japan, South Korea, Vietnam, Singapore, Australia, Rest of Asia Pacific), Middle East & Africa (Middle East [UAE, Egypt, Saudi Arabia, Qatar, Rest of Middle East], Africa [Nigeria, South Africa, Rest of Africa], Latin America (Brazil, Argentina, Colombia, Rest of Latin America)
Company Profiles
Accenture, Tata Consultancy Services (TCS), Wipro, Infosys, IBM, Capgemini, Deloitte, Cognizant, HCL Technologies, Genpact, Tech Mahindra, Oracle, SAP, DXC Technology, Atos, Cognizant Softvision, NTT Data, EPAM Systems, L&T Infotech (LTI), KPMG, and Others
Key Drivers • GCCs implement digital solutions that facilitate seamless omnichannel integration driving market growth    
RESTRAINTS • Integration Challenges may hamper market growth. 

Frequently Asked Questions

Ans: The Global Capabilities Centre in the Retail and Consumer Goods Market was valued at USD 19.1 Billion in 2023.

Ans: The expected CAGR of the Global Capabilities Centre in the Retail and Consumer Goods Market during the forecast period is 15.1%

Ans: The Food & Beverage segment product will grow rapidly in the Global Capabilities Centre in the Retail and Consumer Goods Market Market from 2024-2032.

Ans: GCCs implement digital solutions that facilitate seamless omnichannel integration driving market growth.

Ans: The India led the Global Capabilities Centre in the Retail and Consumer Goods Market in the Asia Pacific region with the highest revenue share in 2023.

Table of Contents

1. Introduction

1.1 Market Definition

1.2 Scope (Inclusion and Exclusions)

1.3 Research Assumptions

2. Executive Summary

2.1 Market Overview

2.2 Regional Synopsis

2.3 Competitive Summary

3. Research Methodology

3.1 Top-Down Approach

3.2 Bottom-up Approach

3.3. Data Validation

3.4 Primary Interviews

4. Market Dynamics Impact Analysis

4.1 Market Driving Factors Analysis

4.1.1 Drivers

4.1.2 Restraints

4.1.3 Opportunities

4.1.4 Challenges

4.2 PESTLE Analysis

4.3 Porter’s Five Forces Model

5. Statistical Insights and Trends Reporting

   5.1 Adoption Rates of Emerging Technologies

   5.2 Network Infrastructure Expansion, by Region

   5.3 Cybersecurity Incidents, by Region (2020-2023)

   5.4 Cloud Services Usage, by Region

6. Competitive Landscape

6.1 List of Major Companies, By Region

6.2 Market Share Analysis, By Region

6.3 Product Benchmarking

6.3.1 Product specifications and features

6.3.2 Pricing

6.4 Strategic Initiatives

6.4.1 Marketing and promotional activities

6.4.2 Distribution and supply chain strategies

6.4.3 Expansion plans and new product launches

6.4.4 Strategic partnerships and collaborations

6.5 Technological Advancements

6.6 Market Positioning and Branding

7. Global Capabilities Centre in the Retail and Consumer Goods Market Segmentation, by Industry Verticals

7.1 Chapter Overview

7.2 Food and Beverage

7.2.1 Food and Beverage Market Trends Analysis (2020-2032)

7.2.2 Food and Beverage Market Size Estimates and Forecasts to 2032 (USD Billion)

7.3 Fashion and Apparel

        7.3.1 Fashion and Apparel Market Trends Analysis (2020-2032)

7.3.2 Fashion and Apparel Market Size Estimates and Forecasts to 2032 (USD Billion)

7.4 Home Goods

7.4.1 Home Goods Market Trends Analysis (2020-2032)

7.4.2 Home Goods Market Size Estimates and Forecasts to 2032 (USD Billion)

8. Global Capabilities Centre in the Retail and Consumer Goods Market Segmentation, by Customer

8.1 Chapter Overview

8.2 Large Enterprises

8.2.1 Large Enterprises Market Trends Analysis (2020-2032)

8.2.2 Large Enterprises Market Size Estimates and Forecasts to 2032 (USD Billion)

8.3 Small and Medium Enterprises (SMEs)

        8.3.1 Small and Medium Enterprises (SMEs) Market Trends Analysis (2020-2032)

8.3.2 Small and Medium Enterprises (SMEs) Market Size Estimates and Forecasts to 2032 (USD Billion)

9. Global Capabilities Centre in the Retail and Consumer Goods Market Segmentation, by Service

9.1 Chapter Overview

9.2 Research and Development (R&D)

9.2.1 Research and Development (R&D) Market Trends Analysis (2020-2032)

9.2.2 Research and Development (R&D) Market Size Estimates and Forecasts to 2032 (USD Billion)

9.3 Supply Chain Management

9.3.1 Supply Chain Management Market Trends Analysis (2020-2032)

9.3.2 Supply Chain Management Market Size Estimates and Forecasts to 2032 (USD Billion)

9.4 IT Service

               9.4.1 IT Service Market Trends Analysis (2020-2032)

9.4.2 IT Service Market Size Estimates and Forecasts to 2032 (USD Billion)

9.5 Customer Support Services

9.5.1 Customer Support Services Market Trends Analysis (2020-2032)

9.5.2 Customer Support Services Market Size Estimates and Forecasts to 2032 (USD Billion)

9.6 Finance and Accounting

        9.6.1 Finance and Accounting Market Trends Analysis (2020-2032)

9.6.2 Finance and Accounting Market Size Estimates and Forecasts to 2032 (USD Billion)

9.7 Marketing and Sales

        9.7.1 Marketing and Sales Market Trends Analysis (2020-2032)

9.7.2 Marketing and Sales Market Size Estimates and Forecasts to 2032 (USD Billion)

10. Regional Analysis

10.1 Chapter Overview

10.2 North America

10.2.1 Trends Analysis

10.2.2 North America Global Capabilities Centre in the Retail and Consumer Goods Market Estimates and Forecasts, by Country (2020-2032) (USD Billion)

10.2.3 North America Global Capabilities Centre in the Retail and Consumer Goods Market Estimates and Forecasts, by Industry Verticals (2020-2032) (USD Billion)  

10.2.4 North America Global Capabilities Centre in the Retail and Consumer Goods Market Estimates and Forecasts, by Customer (2020-2032) (USD Billion)

10.2.5 North America Global Capabilities Centre in the Retail and Consumer Goods Market Estimates and Forecasts, by Service (2020-2032) (USD Billion)

10.2.6 USA

10.2.6.1 USA Global Capabilities Centre in the Retail and Consumer Goods Market Estimates and Forecasts, by Industry Verticals (2020-2032) (USD Billion)

10.2.6.2 USA Global Capabilities Centre in the Retail and Consumer Goods Market Estimates and Forecasts, by Customer (2020-2032) (USD Billion)

10.2.6.3 USA Global Capabilities Centre in the Retail and Consumer Goods Market Estimates and Forecasts, by Service (2020-2032) (USD Billion)

10.2.7 Canada

10.2.7.1 Canada Global Capabilities Centre in the Retail and Consumer Goods Market Estimates and Forecasts, by Industry Verticals (2020-2032) (USD Billion)

10.2.7.2 Canada Global Capabilities Centre in the Retail and Consumer Goods Market Estimates and Forecasts, by Customer (2020-2032) (USD Billion)

10.2.7.3 Canada Global Capabilities Centre in the Retail and Consumer Goods Market Estimates and Forecasts, by Service (2020-2032) (USD Billion)

10.2.8 Mexico

10.2.8.1 Mexico Global Capabilities Centre in the Retail and Consumer Goods Market Estimates and Forecasts, by Industry Verticals (2020-2032) (USD Billion)

10.2.8.2 Mexico Global Capabilities Centre in the Retail and Consumer Goods Market Estimates and Forecasts, by Customer (2020-2032) (USD Billion)

10.2.8.3 Mexico Global Capabilities Centre in the Retail and Consumer Goods Market Estimates and Forecasts, by Service (2020-2032) (USD Billion)

10.3 Europe

10.3.1 Eastern Europe

10.3.1.1 Trends Analysis

10.3.1.2 Eastern Europe Global Capabilities Centre in the Retail and Consumer Goods Market Estimates and Forecasts, by Country (2020-2032) (USD Billion)

10.3.1.3 Eastern Europe Global Capabilities Centre in the Retail and Consumer Goods Market Estimates and Forecasts, by Industry Verticals (2020-2032) (USD Billion)  

10.3.1.4 Eastern Europe Global Capabilities Centre in the Retail and Consumer Goods Market Estimates and Forecasts, by Customer (2020-2032) (USD Billion)

10.3.1.5 Eastern Europe Global Capabilities Centre in the Retail and Consumer Goods Market Estimates and Forecasts, by Service (2020-2032) (USD Billion)

10.3.1.6 Poland

10.3.1.6.1 Poland Global Capabilities Centre in the Retail and Consumer Goods Market Estimates and Forecasts, by Industry Verticals (2020-2032) (USD Billion)

10.3.1.6.2 Poland Global Capabilities Centre in the Retail and Consumer Goods Market Estimates and Forecasts, by Customer (2020-2032) (USD Billion)

10.3.1.6.3 Poland Global Capabilities Centre in the Retail and Consumer Goods Market Estimates and Forecasts, by Service (2020-2032) (USD Billion)

10.3.1.7 Romania

10.3.1.7.1 Romania Global Capabilities Centre in the Retail and Consumer Goods Market Estimates and Forecasts, by Industry Verticals (2020-2032) (USD Billion)

10.3.1.7.2 Romania Global Capabilities Centre in the Retail and Consumer Goods Market Estimates and Forecasts, by Customer (2020-2032) (USD Billion)

10.3.1.7.3 Romania Global Capabilities Centre in the Retail and Consumer Goods Market Estimates and Forecasts, by Service (2020-2032) (USD Billion)

10.3.1.8 Hungary

10.3.1.8.1 Hungary Global Capabilities Centre in the Retail and Consumer Goods Market Estimates and Forecasts, by Industry Verticals (2020-2032) (USD Billion)

10.3.1.8.2 Hungary Global Capabilities Centre in the Retail and Consumer Goods Market Estimates and Forecasts, by Customer (2020-2032) (USD Billion)

10.3.1.8.3 Hungary Global Capabilities Centre in the Retail and Consumer Goods Market Estimates and Forecasts, by Service (2020-2032) (USD Billion)

10.3.1.9 Turkey

10.3.1.9.1 Turkey Global Capabilities Centre in the Retail and Consumer Goods Market Estimates and Forecasts, by Industry Verticals (2020-2032) (USD Billion)

10.3.1.9.2 Turkey Global Capabilities Centre in the Retail and Consumer Goods Market Estimates and Forecasts, by Customer (2020-2032) (USD Billion)

10.3.1.9.3 Turkey Global Capabilities Centre in the Retail and Consumer Goods Market Estimates and Forecasts, by Service (2020-2032) (USD Billion)

10.3.1.10 Rest of Eastern Europe

10.3.1.10.1 Rest of Eastern Europe Global Capabilities Centre in the Retail and Consumer Goods Market Estimates and Forecasts, by Industry Verticals (2020-2032) (USD Billion)

10.3.1.10.2 Rest of Eastern Europe Global Capabilities Centre in the Retail and Consumer Goods Market Estimates and Forecasts, by Customer (2020-2032) (USD Billion)

10.3.1.10.3 Rest of Eastern Europe Global Capabilities Centre in the Retail and Consumer Goods Market Estimates and Forecasts, by Service (2020-2032) (USD Billion)

10.3.2 Western Europe

10.3.2.1 Trends Analysis

10.3.2.2 Western Europe Global Capabilities Centre in the Retail and Consumer Goods Market Estimates and Forecasts, by Country (2020-2032) (USD Billion)

10.3.2.3 Western Europe Global Capabilities Centre in the Retail and Consumer Goods Market Estimates and Forecasts, by Industry Verticals (2020-2032) (USD Billion)  

10.3.2.4 Western Europe Global Capabilities Centre in the Retail and Consumer Goods Market Estimates and Forecasts, by Customer (2020-2032) (USD Billion)

10.3.2.5 Western Europe Global Capabilities Centre in the Retail and Consumer Goods Market Estimates and Forecasts, by Service (2020-2032) (USD Billion)

10.3.2.6 Germany

10.3.2.6.1 Germany Global Capabilities Centre in the Retail and Consumer Goods Market Estimates and Forecasts, by Industry Verticals (2020-2032) (USD Billion)

10.3.2.6.2 Germany Global Capabilities Centre in the Retail and Consumer Goods Market Estimates and Forecasts, by Customer (2020-2032) (USD Billion)

10.3.2.6.3 Germany Global Capabilities Centre in the Retail and Consumer Goods Market Estimates and Forecasts, by Service (2020-2032) (USD Billion)

10.3.2.7 France

10.3.2.7.1 France Global Capabilities Centre in the Retail and Consumer Goods Market Estimates and Forecasts, by Industry Verticals (2020-2032) (USD Billion)

10.3.2.7.2 France Global Capabilities Centre in the Retail and Consumer Goods Market Estimates and Forecasts, by Customer (2020-2032) (USD Billion)

10.3.2.7.3 France Global Capabilities Centre in the Retail and Consumer Goods Market Estimates and Forecasts, by Service (2020-2032) (USD Billion)

10.3.2.8 UK

10.3.2.8.1 UK Global Capabilities Centre in the Retail and Consumer Goods Market Estimates and Forecasts, by Industry Verticals (2020-2032) (USD Billion)

10.3.2.8.2 UK Global Capabilities Centre in the Retail and Consumer Goods Market Estimates and Forecasts, by Customer (2020-2032) (USD Billion)

10.3.2.8.3 UK Global Capabilities Centre in the Retail and Consumer Goods Market Estimates and Forecasts, by Service (2020-2032) (USD Billion)

10.3.2.9 Italy

10.3.2.9.1 Italy Global Capabilities Centre in the Retail and Consumer Goods Market Estimates and Forecasts, by Industry Verticals (2020-2032) (USD Billion)

10.3.2.9.2 Italy Global Capabilities Centre in the Retail and Consumer Goods Market Estimates and Forecasts, by Customer (2020-2032) (USD Billion)

10.3.2.9.3 Italy Global Capabilities Centre in the Retail and Consumer Goods Market Estimates and Forecasts, by Service (2020-2032) (USD Billion)

10.3.2.10 Spain

10.3.2.10.1 Spain Global Capabilities Centre in the Retail and Consumer Goods Market Estimates and Forecasts, by Industry Verticals (2020-2032) (USD Billion)

10.3.2.10.2 Spain Global Capabilities Centre in the Retail and Consumer Goods Market Estimates and Forecasts, by Customer (2020-2032) (USD Billion)

10.3.2.10.3 Spain Global Capabilities Centre in the Retail and Consumer Goods Market Estimates and Forecasts, by Service (2020-2032) (USD Billion)

10.3.2.11 Netherlands

10.3.2.11.1 Netherlands Global Capabilities Centre in the Retail and Consumer Goods Market Estimates and Forecasts, by Industry Verticals (2020-2032) (USD Billion)

10.3.2.11.2 Netherlands Global Capabilities Centre in the Retail and Consumer Goods Market Estimates and Forecasts, by Customer (2020-2032) (USD Billion)

10.3.2.11.3 Netherlands Global Capabilities Centre in the Retail and Consumer Goods Market Estimates and Forecasts, by Service (2020-2032) (USD Billion)

10.3.2.12 Switzerland

10.3.2.12.1 Switzerland Global Capabilities Centre in the Retail and Consumer Goods Market Estimates and Forecasts, by Industry Verticals (2020-2032) (USD Billion)

10.3.2.12.2 Switzerland Global Capabilities Centre in the Retail and Consumer Goods Market Estimates and Forecasts, by Customer (2020-2032) (USD Billion)

10.3.2.12.3 Switzerland Global Capabilities Centre in the Retail and Consumer Goods Market Estimates and Forecasts, by Service (2020-2032) (USD Billion)

10.3.2.13 Austria

10.3.2.13.1 Austria Global Capabilities Centre in the Retail and Consumer Goods Market Estimates and Forecasts, by Industry Verticals (2020-2032) (USD Billion)

10.3.2.13.2 Austria Global Capabilities Centre in the Retail and Consumer Goods Market Estimates and Forecasts, by Customer (2020-2032) (USD Billion)

10.3.2.13.3 Austria Global Capabilities Centre in the Retail and Consumer Goods Market Estimates and Forecasts, by Service (2020-2032) (USD Billion)

10.3.2.14 Rest of Western Europe

10.3.2.14.1 Rest of Western Europe Global Capabilities Centre in the Retail and Consumer Goods Market Estimates and Forecasts, by Industry Verticals (2020-2032) (USD Billion)

10.3.2.14.2 Rest of Western Europe Global Capabilities Centre in the Retail and Consumer Goods Market Estimates and Forecasts, by Customer (2020-2032) (USD Billion)

10.3.2.14.3 Rest of Western Europe Global Capabilities Centre in the Retail and Consumer Goods Market Estimates and Forecasts, by Service (2020-2032) (USD Billion)

10.4 Asia Pacific

10.4.1 Trends Analysis

10.4.2 Asia Pacific Global Capabilities Centre in the Retail and Consumer Goods Market Estimates and Forecasts, by Country (2020-2032) (USD Billion)

10.4.3 Asia Pacific Global Capabilities Centre in the Retail and Consumer Goods Market Estimates and Forecasts, by Industry Verticals (2020-2032) (USD Billion)  

10.4.4 Asia Pacific Global Capabilities Centre in the Retail and Consumer Goods Market Estimates and Forecasts, by Customer (2020-2032) (USD Billion)

10.4.5 Asia Pacific Global Capabilities Centre in the Retail and Consumer Goods Market Estimates and Forecasts, by Service (2020-2032) (USD Billion)

10.4.6 China

10.4.6.1 China Global Capabilities Centre in the Retail and Consumer Goods Market Estimates and Forecasts, by Industry Verticals (2020-2032) (USD Billion)

10.4.6.2 China Global Capabilities Centre in the Retail and Consumer Goods Market Estimates and Forecasts, by Customer (2020-2032) (USD Billion)

10.4.6.3 China Global Capabilities Centre in the Retail and Consumer Goods Market Estimates and Forecasts, by Service (2020-2032) (USD Billion)

10.4.7 India

10.4.7.1 India Global Capabilities Centre in the Retail and Consumer Goods Market Estimates and Forecasts, by Industry Verticals (2020-2032) (USD Billion)

10.4.7.2 India Global Capabilities Centre in the Retail and Consumer Goods Market Estimates and Forecasts, by Customer (2020-2032) (USD Billion)

10.4.7.3 India Global Capabilities Centre in the Retail and Consumer Goods Market Estimates and Forecasts, by Service (2020-2032) (USD Billion)

10.4.8 Japan

10.4.8.1 Japan Global Capabilities Centre in the Retail and Consumer Goods Market Estimates and Forecasts, by Industry Verticals (2020-2032) (USD Billion)

10.4.8.2 Japan Global Capabilities Centre in the Retail and Consumer Goods Market Estimates and Forecasts, by Customer (2020-2032) (USD Billion)

10.4.8.3 Japan Global Capabilities Centre in the Retail and Consumer Goods Market Estimates and Forecasts, by Service (2020-2032) (USD Billion)

10.4.9 South Korea

10.4.9.1 South Korea Global Capabilities Centre in the Retail and Consumer Goods Market Estimates and Forecasts, by Industry Verticals (2020-2032) (USD Billion)

10.4.9.2 South Korea Global Capabilities Centre in the Retail and Consumer Goods Market Estimates and Forecasts, by Customer (2020-2032) (USD Billion)

10.4.9.3 South Korea Global Capabilities Centre in the Retail and Consumer Goods Market Estimates and Forecasts, by Service (2020-2032) (USD Billion)

10.4.10 Vietnam

10.4.10.1 Vietnam Global Capabilities Centre in the Retail and Consumer Goods Market Estimates and Forecasts, by Industry Verticals (2020-2032) (USD Billion)

10.4.10.2 Vietnam Global Capabilities Centre in the Retail and Consumer Goods Market Estimates and Forecasts, by Customer (2020-2032) (USD Billion)

10.4.10.3 Vietnam Global Capabilities Centre in the Retail and Consumer Goods Market Estimates and Forecasts, by Service (2020-2032) (USD Billion)

10.4.11 Singapore

10.4.11.1 Singapore Global Capabilities Centre in the Retail and Consumer Goods Market Estimates and Forecasts, by Industry Verticals (2020-2032) (USD Billion)

10.4.11.2 Singapore Global Capabilities Centre in the Retail and Consumer Goods Market Estimates and Forecasts, by Customer (2020-2032) (USD Billion)

10.4.11.3 Singapore Global Capabilities Centre in the Retail and Consumer Goods Market Estimates and Forecasts, by Service (2020-2032) (USD Billion)

10.4.12 Australia

10.4.12.1 Australia Global Capabilities Centre in the Retail and Consumer Goods Market Estimates and Forecasts, by Industry Verticals (2020-2032) (USD Billion)

10.4.12.2 Australia Global Capabilities Centre in the Retail and Consumer Goods Market Estimates and Forecasts, by Customer (2020-2032) (USD Billion)

10.4.12.3 Australia Global Capabilities Centre in the Retail and Consumer Goods Market Estimates and Forecasts, by Service (2020-2032) (USD Billion)

10.4.13 Rest of Asia Pacific

10.4.13.1 Rest of Asia Pacific Global Capabilities Centre in the Retail and Consumer Goods Market Estimates and Forecasts, by Industry Verticals (2020-2032) (USD Billion)

10.4.13.2 Rest of Asia Pacific Global Capabilities Centre in the Retail and Consumer Goods Market Estimates and Forecasts, by Customer (2020-2032) (USD Billion)

10.4.13.3 Rest of Asia Pacific Global Capabilities Centre in the Retail and Consumer Goods Market Estimates and Forecasts, by Service (2020-2032) (USD Billion)

10.5 Middle East and Africa

10.5.1 Middle East

10.5.1.1 Trends Analysis

10.5.1.2 Middle East Global Capabilities Centre in the Retail and Consumer Goods Market Estimates and Forecasts, by Country (2020-2032) (USD Billion)

10.5.1.3 Middle East Global Capabilities Centre in the Retail and Consumer Goods Market Estimates and Forecasts, by Industry Verticals (2020-2032) (USD Billion)  

10.5.1.4 Middle East Global Capabilities Centre in the Retail and Consumer Goods Market Estimates and Forecasts, by Customer (2020-2032) (USD Billion)

10.5.1.5 Middle East Global Capabilities Centre in the Retail and Consumer Goods Market Estimates and Forecasts, by Service (2020-2032) (USD Billion)

10.5.1.6 UAE

10.5.1.6.1 UAE Global Capabilities Centre in the Retail and Consumer Goods Market Estimates and Forecasts, by Industry Verticals (2020-2032) (USD Billion)

10.5.1.6.2 UAE Global Capabilities Centre in the Retail and Consumer Goods Market Estimates and Forecasts, by Customer (2020-2032) (USD Billion)

10.5.1.6.3 UAE Global Capabilities Centre in the Retail and Consumer Goods Market Estimates and Forecasts, by Service (2020-2032) (USD Billion)

10.5.1.7 Egypt

10.5.1.7.1 Egypt Global Capabilities Centre in the Retail and Consumer Goods Market Estimates and Forecasts, by Industry Verticals (2020-2032) (USD Billion)

10.5.1.7.2 Egypt Global Capabilities Centre in the Retail and Consumer Goods Market Estimates and Forecasts, by Customer (2020-2032) (USD Billion)

10.5.1.7.3 Egypt Global Capabilities Centre in the Retail and Consumer Goods Market Estimates and Forecasts, by Service (2020-2032) (USD Billion)

10.5.1.8 Saudi Arabia

10.5.1.8.1 Saudi Arabia Global Capabilities Centre in the Retail and Consumer Goods Market Estimates and Forecasts, by Industry Verticals (2020-2032) (USD Billion)

10.5.1.8.2 Saudi Arabia Global Capabilities Centre in the Retail and Consumer Goods Market Estimates and Forecasts, by Customer (2020-2032) (USD Billion)

10.5.1.8.3 Saudi Arabia Global Capabilities Centre in the Retail and Consumer Goods Market Estimates and Forecasts, by Service (2020-2032) (USD Billion)

10.5.1.9 Qatar

10.5.1.9.1 Qatar Global Capabilities Centre in the Retail and Consumer Goods Market Estimates and Forecasts, by Industry Verticals (2020-2032) (USD Billion)

10.5.1.9.2 Qatar Global Capabilities Centre in the Retail and Consumer Goods Market Estimates and Forecasts, by Customer (2020-2032) (USD Billion)

10.5.1.9.3 Qatar Global Capabilities Centre in the Retail and Consumer Goods Market Estimates and Forecasts, by Service (2020-2032) (USD Billion)

10.5.1.10 Rest of Middle East

10.5.1.10.1 Rest of Middle East Global Capabilities Centre in the Retail and Consumer Goods Market Estimates and Forecasts, by Industry Verticals (2020-2032) (USD Billion)

10.5.1.10.2 Rest of Middle East Global Capabilities Centre in the Retail and Consumer Goods Market Estimates and Forecasts, by Customer (2020-2032) (USD Billion)

10.5.1.10.3 Rest of Middle East Global Capabilities Centre in the Retail and Consumer Goods Market Estimates and Forecasts, by Service (2020-2032) (USD Billion)

10.5.2 Africa

10.5.2.1 Trends Analysis

10.5.2.2 Africa Global Capabilities Centre in the Retail and Consumer Goods Market Estimates and Forecasts, by Country (2020-2032) (USD Billion)

10.5.2.3 Africa Global Capabilities Centre in the Retail and Consumer Goods Market Estimates and Forecasts, by Industry Verticals (2020-2032) (USD Billion)  

10.5.2.4 Africa Global Capabilities Centre in the Retail and Consumer Goods Market Estimates and Forecasts, by Customer (2020-2032) (USD Billion)

10.5.2.5 Africa Global Capabilities Centre in the Retail and Consumer Goods Market Estimates and Forecasts, by Service (2020-2032) (USD Billion)

10.5.2.6 South Africa

10.5.2.6.1 South Africa Global Capabilities Centre in the Retail and Consumer Goods Market Estimates and Forecasts, by Industry Verticals (2020-2032) (USD Billion)

10.5.2.6.2 South Africa Global Capabilities Centre in the Retail and Consumer Goods Market Estimates and Forecasts, by Customer (2020-2032) (USD Billion)

10.5.2.6.3 South Africa Global Capabilities Centre in the Retail and Consumer Goods Market Estimates and Forecasts, by Service (2020-2032) (USD Billion)

10.5.2.7 Nigeria

10.5.2.7.1 Nigeria Global Capabilities Centre in the Retail and Consumer Goods Market Estimates and Forecasts, by Industry Verticals (2020-2032) (USD Billion)

10.5.2.7.2 Nigeria Global Capabilities Centre in the Retail and Consumer Goods Market Estimates and Forecasts, by Customer (2020-2032) (USD Billion)

10.5.2.7.3 Nigeria Global Capabilities Centre in the Retail and Consumer Goods Market Estimates and Forecasts, by Service (2020-2032) (USD Billion)

10.5.2.8 Rest of Africa

10.5.2.8.1 Rest of Africa Global Capabilities Centre in the Retail and Consumer Goods Market Estimates and Forecasts, by Industry Verticals (2020-2032) (USD Billion)

10.5.2.8.2 Rest of Africa Global Capabilities Centre in the Retail and Consumer Goods Market Estimates and Forecasts, by Customer (2020-2032) (USD Billion)

10.5.2.8.3 Rest of Africa Global Capabilities Centre in the Retail and Consumer Goods Market Estimates and Forecasts, by Service (2020-2032) (USD Billion)

10.6 Latin America

10.6.1 Trends Analysis

10.6.2 Latin America Global Capabilities Centre in the Retail and Consumer Goods Market Estimates and Forecasts, by Country (2020-2032) (USD Billion)

10.6.3 Latin America Global Capabilities Centre in the Retail and Consumer Goods Market Estimates and Forecasts, by Industry Verticals (2020-2032) (USD Billion)  

10.6.4 Latin America Global Capabilities Centre in the Retail and Consumer Goods Market Estimates and Forecasts, by Customer (2020-2032) (USD Billion)

10.6.5 Latin America Global Capabilities Centre in the Retail and Consumer Goods Market Estimates and Forecasts, by Service (2020-2032) (USD Billion)

10.6.6 Brazil

10.6.6.1 Brazil Global Capabilities Centre in the Retail and Consumer Goods Market Estimates and Forecasts, by Industry Verticals (2020-2032) (USD Billion)

10.6.6.2 Brazil Global Capabilities Centre in the Retail and Consumer Goods Market Estimates and Forecasts, by Customer (2020-2032) (USD Billion)

10.6.6.3 Brazil Global Capabilities Centre in the Retail and Consumer Goods Market Estimates and Forecasts, by Service (2020-2032) (USD Billion)

10.6.7 Argentina

10.6.7.1 Argentina Global Capabilities Centre in the Retail and Consumer Goods Market Estimates and Forecasts, by Industry Verticals (2020-2032) (USD Billion)

10.6.7.2 Argentina Global Capabilities Centre in the Retail and Consumer Goods Market Estimates and Forecasts, by Customer (2020-2032) (USD Billion)

10.6.7.3 Argentina Global Capabilities Centre in the Retail and Consumer Goods Market Estimates and Forecasts, by Service (2020-2032) (USD Billion)

10.6.8 Colombia

10.6.8.1 Colombia Global Capabilities Centre in the Retail and Consumer Goods Market Estimates and Forecasts, by Industry Verticals (2020-2032) (USD Billion)

10.6.8.2 Colombia Global Capabilities Centre in the Retail and Consumer Goods Market Estimates and Forecasts, by Customer (2020-2032) (USD Billion)

10.6.8.3 Colombia Global Capabilities Centre in the Retail and Consumer Goods Market Estimates and Forecasts, by Service (2020-2032) (USD Billion)

10.6.9 Rest of Latin America

10.6.9.1 Rest of Latin America Global Capabilities Centre in the Retail and Consumer Goods Market Estimates and Forecasts, by Industry Verticals (2020-2032) (USD Billion)

10.6.9.2 Rest of Latin America Global Capabilities Centre in the Retail and Consumer Goods Market Estimates and Forecasts, by Customer (2020-2032) (USD Billion)

10.6.9.3 Rest of Latin America Global Capabilities Centre in the Retail and Consumer Goods Market Estimates and Forecasts, by Service (2020-2032) (USD Billion)

11. Company Profiles

11.1 GrafTech International

11.1.1 Company Overview

11.1.2 Financial

11.1.3 Products/ Services Offered

11.1.4 SWOT Analysis

11.2 XG Sciences, Inc.

             11.2.1 Company Overview

11.2.2 Financial

11.2.3 Products/ Services Offered

11.2.4 SWOT Analysis

11.3 Applied Graphene Materials plc

11.3.1 Company Overview

11.3.2 Financial

11.3.3 Products/ Services Offered

11.3.4 SWOT Analysis

11.4 Haydale Graphene Industries Plc

11.4.1 Company Overview

11.4.2 Financial

11.4.3 Products/ Services Offered

11.4.4 SWOT Analysis

11.5 Versarien Plc

11.5.1 Company Overview

11.5.2 Financial

11.5.3 Products/ Services Offered

11.5.4 SWOT Analysis

11.6 First Graphene Ltd

11.6.1 Company Overview

11.6.2 Financial

11.6.3 Products/ Services Offered

11.6.4 SWOT Analysis

11.7 G6 Materials Corp.

11.7.1 Company Overview

11.7.2 Financial

11.7.3 Products/ Services Offered

11.7.4 SWOT Analysis

11.8 Thomas Swan & Co. Ltd.

11.8.1 Company Overview

11.8.2 Financial

11.8.3 Products/ Services Offered

11.8.4 SWOT Analysis

11.9 CVD Equipment Corporation

             11.9.1 Company Overview

11.9.2 Financial

11.9.3 Products/ Services Offered

11.9.4 SWOT Analysis

11.10 Angstron Materials, Inc.

11.10.1 Company Overview

11.10.2 Financial

11.10.3 Products/ Services Offered

11.10.4 SWOT Analysis

12. Use Cases and Best Practices

13. Conclusion

An accurate research report requires proper strategizing as well as implementation. There are multiple factors involved in the completion of good and accurate research report and selecting the best methodology to compete the research is the toughest part. Since the research reports we provide play a crucial role in any company’s decision-making process, therefore we at SNS Insider always believe that we should choose the best method which gives us results closer to reality. This allows us to reach at a stage wherein we can provide our clients best and accurate investment to output ratio.

Each report that we prepare takes a timeframe of 350-400 business hours for production. Starting from the selection of titles through a couple of in-depth brain storming session to the final QC process before uploading our titles on our website we dedicate around 350 working hours. The titles are selected based on their current market cap and the foreseen CAGR and growth.


The 5 steps process:

Step 1: Secondary Research:

Secondary Research or Desk Research is as the name suggests is a research process wherein, we collect data through the readily available information. In this process we use various paid and unpaid databases which our team has access to and gather data through the same. This includes examining of listed companies’ annual reports, Journals, SEC filling etc. Apart from this our team has access to various associations across the globe across different industries. Lastly, we have exchange relationships with various university as well as individual libraries.

Secondary Research

Step 2: Primary Research

When we talk about primary research, it is a type of study in which the researchers collect relevant data samples directly, rather than relying on previously collected data.  This type of research is focused on gaining content specific facts that can be sued to solve specific problems. Since the collected data is fresh and first hand therefore it makes the study more accurate and genuine.

We at SNS Insider have divided Primary Research into 2 parts.

Part 1 wherein we interview the KOLs of major players as well as the upcoming ones across various geographic regions. This allows us to have their view over the market scenario and acts as an important tool to come closer to the accurate market numbers. As many as 45 paid and unpaid primary interviews are taken from both the demand and supply side of the industry to make sure we land at an accurate judgement and analysis of the market.

This step involves the triangulation of data wherein our team analyses the interview transcripts, online survey responses and observation of on filed participants. The below mentioned chart should give a better understanding of the part 1 of the primary interview.

Primary Research

Part 2: In this part of primary research the data collected via secondary research and the part 1 of the primary research is validated with the interviews from individual consultants and subject matter experts.

Consultants are those set of people who have at least 12 years of experience and expertise within the industry whereas Subject Matter Experts are those with at least 15 years of experience behind their back within the same space. The data with the help of two main processes i.e., FGDs (Focused Group Discussions) and IDs (Individual Discussions). This gives us a 3rd party nonbiased primary view of the market scenario making it a more dependable one while collation of the data pointers.

Step 3: Data Bank Validation

Once all the information is collected via primary and secondary sources, we run that information for data validation. At our intelligence centre our research heads track a lot of information related to the market which includes the quarterly reports, the daily stock prices, and other relevant information. Our data bank server gets updated every fortnight and that is how the information which we collected using our primary and secondary information is revalidated in real time.

Data Bank Validation

Step 4: QA/QC Process

After all the data collection and validation our team does a final level of quality check and quality assurance to get rid of any unwanted or undesired mistakes. This might include but not limited to getting rid of the any typos, duplication of numbers or missing of any important information. The people involved in this process include technical content writers, research heads and graphics people. Once this process is completed the title gets uploader on our platform for our clients to read it.

Step 5: Final QC/QA Process:

This is the last process and comes when the client has ordered the study. In this process a final QA/QC is done before the study is emailed to the client. Since we believe in giving our clients a good experience of our research studies, therefore, to make sure that we do not lack at our end in any way humanly possible we do a final round of quality check and then dispatch the study to the client.

Key Segments:

By Industry Verticals

  • Food and Beverage

  • Fashion and Apparel

  • Home Goods

By Customer

  • Large Enterprises

  • Small and Medium Enterprises (SMEs)

By Service

  • Research and Development (R&D)

  • Supply Chain Management

  • IT Service

  • Customer Support Services

  • Finance and Accounting

  • Marketing and Sales

Request for Segment Customization as per your Business Requirement: Segment Customization Request

Regional Coverage:

North America

  • US

  • Canada

  • Mexico

Europe

  • Eastern Europe

    • Poland

    • Romania

    • Hungary

    • Turkey

    • Rest of Eastern Europe

  • Western Europe

    • Germany

    • France

    • UK

    • Italy

    • Spain

    • Netherlands

    • Switzerland

    • Austria

    • Rest of Western Europe

Asia Pacific

  • China

  • India

  • Japan

  • South Korea

  • Vietnam

  • Singapore

  • Australia

  • Rest of Asia Pacific

Middle East & Africa

  • Middle East

    • UAE

    • Egypt

    • Saudi Arabia

    • Qatar

    • Rest of Middle East

  • Africa

    • Nigeria

    • South Africa

    • Rest of Africa

  • Latin America

  • Brazil

  • Argentina

  • Colombia

  • Rest of Latin America

Request for Country Level Research Report: Country Level Customization Request

Available Customization

With the given market data, SNS Insider offers customization as per the company’s specific needs. The following customization options are available for the report:

  • Product Analysis

  • Criss-Cross segment analysis (e.g. Product X Application)

  • Product Matrix which gives a detailed comparison of product portfolio of each company

  • Geographic Analysis

  • Additional countries in any of the regions

  • Company Information

  • Detailed analysis and profiling of additional market players (Up to five)


  •            5000 (33% Discount)


  •            8950 (40% Discount)


  •            3050 (23% Discount)

Start a Conversation

Hi! Click one of our member below to chat on Phone