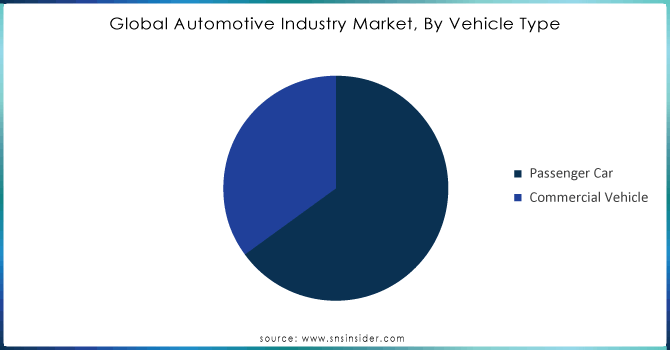
The Global Automotive Industry Market size is valued at USD 436.89 Bn in 2022 and is expected to reach USD 1789 Bn by 2030 and grow at a CAGR of 19.25% over the period of 2023-2030.
In 2021, the market for electric vehicles was expanding quickly. In order to comply with stricter pollution rules and public demand for cleaner transportation, many traditional manufacturers were making significant investments in electric car technologies. With businesses like Tesla, Waymo, and conventional manufacturers testing and implementing autonomous elements in their vehicles, autonomous vehicles or self-driving technology has continued to advance. Regulation and safety issues remained pressing problems to resolve. The COVID-19 pandemic created supply chain interruptions in numerous industries, including the automotive one. This had an effect on the supply of crucial components like semiconductors. The industry was being influenced by sustainability and environmental issues. By using more efficient vehicle designs and reducing their carbon impact during manufacture, many automakers were making strides in this direction.
Get E-PDF Sample Report on Automotive Industry Market - Request Sample Report
As ride-sharing services and vehicle-sharing platforms gain popularity, they may have an impact on urban regions' car ownership trends. Automakers were putting more of an emphasis on online sales channels and improving the user experience for online customers.
The automotive industry sought to grow in developing nations, especially Asia, where there was a rising middle class and a need for automobiles. Worldwide, governments are providing incentives to encourage the use of electric vehicles, including electric scooters. Tax reductions, financial assistance, and access to special parking and charging locations are a few examples of these incentives. Consumers are becoming more knowledgeable about the advantages electric vehicles have for the environment. Electric scooters have no emissions, which enhances the quality of the air and lowers greenhouse gas emissions. Compared to scooters fuelled by gasoline, electric scooters are more affordable to operate. Due to their increased efficiency and lack of need for gasoline or oil changes, electric scooters can go farther on a single charge. Sales of electric scooters rose by 23% in 2022–2023, the most in more than four years. Traditional automakers were up against competition from startups that were specializing in electric and driverless vehicles, as well as IT giants like Tesla. As customers and governments alike put pressure on the sector to cut emissions, EVs are growing in popularity. This is causing a significant change in how automobiles are created and developed.
The switch to electric vehicles (EVs) and rising costs are two issues that the Indian automotive industry is also dealing with. But in the next years, it's also anticipated that the Indian auto sector would expand dramatically. The Indian auto sector is predicted to grow to a $15 lakh crore (INR 150 trillion) market by 2024–25, according to a forecast by Invest India. Due to its numerous benefits over conventional gasoline-powered vehicles, including lower pollutants and lower running costs, EVs are growing in popularity. The EV industry is anticipated to expand quickly in the upcoming years because to the significant investments automakers are making in EV development.
Moving toward autonomous driving Another significant trend reshaping the automotive sector is autonomous driving. Several self-driving technologies are being developed by automakers, and some cars can already drive themselves in particular circumstances. As autonomous driving has the potential to transform how people travel, it is anticipated to have a significant impact on the automobile industry in the years to come. The car sector continues to be a significant global economic force. The number of vehicles sold worldwide in 2022 increased by 4.7% to 80.1 million units. The industry is also making significant investments in cutting-edge technology like linked automobiles, driverless vehicles, and EVs.
Driver:
The increase in global sales of vehicles and demand for the passenger vehicles in the rising economies.
People have more money to spend on discretionary items like new cars as their salaries improve. As more people settle in urban areas, the need for personal mobility rises. Better roads and highways make owning and operating a vehicle easier and more convenient. Governments in developing nations frequently enact laws that encourage the purchase of automobiles, such as tax breaks and subsidies.
In general, increased passenger vehicle sales in developing nations are an indication of wealth and economic expansion. However, it is crucial to address the problems brought on by this growth, including clogged roads, air pollution, and infrastructural issues.
Here are some instances of increased electric commercial vehicle sales in developing nations:
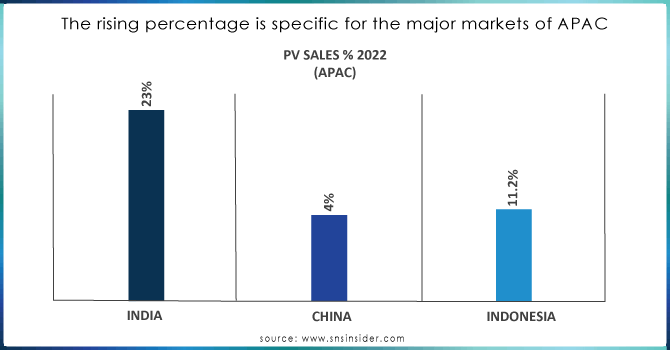
Source: SNS Analysis
Opportunity
The initiative taken by the government to upscale the actions related to achieving net zero carbon goal.
The rising development by the OEMs in order to improve the overall business model by focusing on the sustainability element.
Governments were contributing a sizable amount of money to assist the creation and use of renewable energy sources like hydroelectric, solar, and wind energy. These investments have the dual goals of reducing carbon emissions and relying on fossil resources. To promote the use of electric vehicles, numerous governments have provided incentives and subsidies. This includes subsidies for EV technology research and development, rebates for EV sales, and funding for charging infrastructure. To stay competitive in the future, automotive OEMs must make investments in cutting-edge technology like autonomous driving, connected vehicles, and electrified automobiles. Automotive OEMs can enter new areas, such as emerging countries and growing economies, to take advantage of fresh growth prospects. To expand their customer base and diversify their revenue streams, automotive OEMs can create new business models like subscription services and ride-hailing services. Funding for energy efficiency programs increased. In order to significantly reduce energy use and emissions, this includes measures to enhance the energy efficiency of buildings, industrial operations, and appliances.
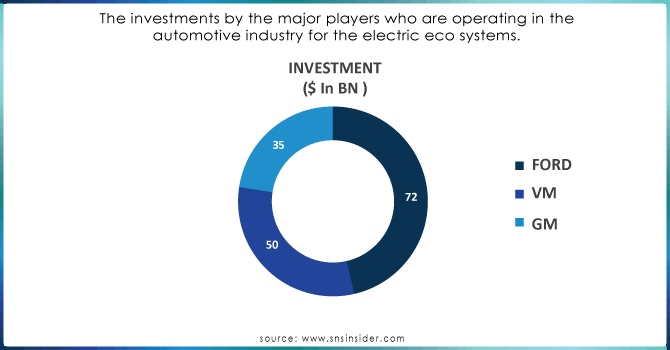
The firm has promised to investing USD 3.5 trillion in EV research and development over the following ten years and expects to introduce 30 new EV models by 2030.
The markets Volkswagen is entering are growing. The business plans to introduce new EV models in these areas while also making significant investments in its operations in China and India. New business models are being created by General Motors. The business has introduced a subscription service called Cadillac Care that charges clients a monthly fee in exchange for access to a fleet of Cadillac vehicles. Additionally, GM is creating Maven, a ride-hailing service. Ford is making operational improvements. Over the following three years, the corporation intends to slash expenditures by USD 3 billion.
Restrains
Because of the automotive industry's high degree of globalization, manufacturing has recently been significantly impacted. These disruptions have been caused by a number of events, including the COVID-19 epidemic, the conflict in Ukraine, and others.
Challenges
The margins of automakers are under pressure as a result of recent increases in the price of raw materials and components.
The world economy is dealing with a number of issues, such as high inflation and rising interest rates.
1. Market By Vehicle Type
Passenger Car
Hatchback
Sedan
SUV
MUV
Commercial Vehicle
LCVs
Heavy Trucks
Buses & Coaches
Get Customized Report as Per Your Business Requirement - Request For Customized Report
2. Market By Propulsion Type
ICE Vehicle
Electric Vehicle
Because they are more likely to be cutting their spending and saving money during a recession, consumers are less likely to buy new cars. Because the automobile sector employs many people, a recession may result in job losses across the board. During a recession, automakers could cut back on manufacturing and new product development. During a recession, suppliers may find it more difficult to meet the demands of the auto industry. Recession intensity and the particular circumstances of the business at the time can both affect how the recession affects the automotive industry. But during recessions, fewer people buy cars, more jobs are lost, and less money is invested.
Impact of War:
Major raw material and component suppliers to the automotive industry are Russia and Ukraine. The supply chain has been hampered by the war, making it challenging and expensive for manufacturers to acquire the materials they require to build automobiles. As a result of the war, the price of energy and raw materials has dramatically risen. The price of vehicles has increased as a result of this. Demand has decreased as a result of the war's instability and economic uncertainty. Because of this, demand for new cars has decreased, notably in Europe.
Source: SNS Analysis
The investment details of all the major players performing in every segment mentioned in this market will be provided in final report. Also, the completed M&A and possible vertical integration moves which are in the pipeline will be provided.
Governments all across the world are establishing challenging goals for lowering greenhouse gas emissions from the transportation industry. Because electric vehicles are more environmentally friendly than gasoline-powered vehicles, this is motivating automakers to make investments in them. Electric vehicle demand is increasing quickly among consumers. This is a result of a number of things, such as the rising price of fuel, the advantages electric vehicles have for the environment, and the growing quantity of electric vehicles on the market. Electric vehicles are becoming more feasible and inexpensive because to developments in battery technology and electric vehicle design. As a result, buyers are finding electric automobiles to be a more appealing option.
Electric cars, SUVs, trucks, and vans are among the many types of vehicles that automakers are now creating. To guarantee a steady supply of batteries for their electric vehicles, automakers are investing in battery manufacture. To make it simpler for users to charge their electric vehicles, automakers are investing in infrastructure for charging. To create new technologies for their electric vehicles, such as autonomous driving and over-the-air upgrades, automakers are investing in software and digitalization.
Exhibit 1
Region | Market Size 2022 |
---|---|
North America | 131 Bn |
Europe | XX |
APAC | 214 Billion |
LATAM | XX |
MEA | XX |
Source: SNS Analysis
The COVID-19 pandemic, broken supply chains, and growing inflation are just a few of the difficulties the North American automobile sector has been dealing with lately. The industry is anticipated to rebound in the upcoming years, however, thanks to the significant demand for electric vehicles and other cutting-edge technologies. With over 70% of all car sales in North America, the United States has the largest automotive market in the continent. A broad demographic base and a robust domestic economy sustain the U.S. car sector.
Undoubtedly one of the most significant trends in North America is the electrification of the automotive sector. Governments are providing incentives to encourage the adoption of electric vehicles, and automakers are investing extensively in this technology. Another significant trend in the North American car industry is autonomous driving. Automakers are working on autonomous vehicles, and governments are establishing rules to control their usage. The automotive industry in North America is likewise experiencing a significant rise in connectivity. Vehicles that are connected to the internet and to one another are being developed by automakers. This enables communication between vehicles and the infrastructure, which can increase safety and effectiveness.
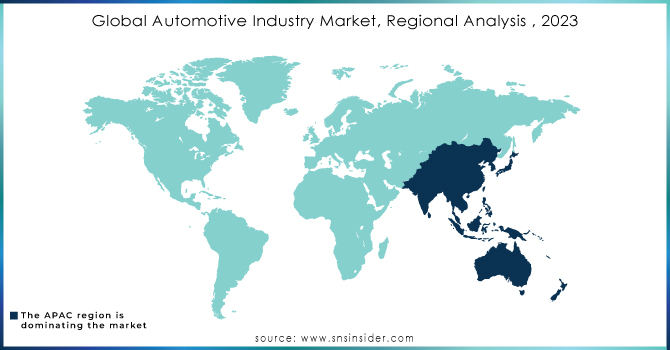
The world's largest and fastest-growing automobile market is located in Asia-Pacific (APAC). Some of the top automakers in the world, such as Toyota, Honda, and Hyundai, are based in the area. There is a huge network of suppliers and dealerships that support the APAC automobile sector. The growing demand for electric vehicles and other cutting-edge technology is anticipated to fuel further expansion of the APAC automotive market over the coming years. The sector will nevertheless also have to deal with difficulties including deteriorating supply chains and growing prices.
USED Cases
Introduction
One of the major problems faced by the OEMs and the government is related to rising fatalities all around the globe. Specially the major concerns are associated with the rising urbanisation and accidents happening in highly developed countries. The development of ADAS systems looking at the safety and the rising mobility of autonomous eco system, the development is said to be the game changer and will surely impact the safety factors of the local population. After the primary analysis with the industry experts, we got to know the adoption percentage of the system is way more ahead than forecasted. We have mentioned the key features and the pre concepts about how the system is functioning and the facts related to why it is the most essential element in vehicles in this era.
Exhibit 2
Country | Fatalities | Increase (%) |
---|---|---|
Germany | 2782 | 9 |
China | 9980000 | 3 |
US | 42795 | 2 |
Brazil | 1480000 | 10.8 |
The samples of major economies of respective region have been studied for analysing the present situation. The data abstracted is from the official sources.
Case Analysis:
The driver can be warned if they start to become distracted by ADAS systems, which can track their level of concentration. This may lessen the number of collisions brought on by driver distraction. ADAS systems may automatically rectify errors like lane departure and unwanted acceleration, which helps to reduce driver error. By doing this, the number of accidents brought on by human error may be decreased. ADAS systems can give the driver a 360-degree picture of the area around the vehicle, improving vision. By doing this, the motorist may be able to recognize and steer clear of risks that they might otherwise miss. ADAS systems can react more quickly than people can, which can assist prevent collisions in emergency situations.
If the system senses an impending accident, AEB systems have the ability to autonomously deploy the brakes. Rear-end collision rates have been proven to be significantly decreased by AEB systems. LDW (lane departure warning) systems warn the driver if they begin to veer off course. Lane departure accidents can potentially be decreased with the aid of LDW technologies. Systems for blind spot monitoring (BSM) warn the driver when a car is in their blind area. The probability of lane change collisions can be decreased with the aid of BSM technologies. Pedestrian detection systems can warn the driver if a pedestrian crosses their route in front of their car. Accidents involving pedestrians can be decreased with the aid of pedestrian detecting devices. The vehicle in front of you is automatically kept at a safe distance thanks to ACC technologies. Driver tiredness can be reduced and fuel efficiency can be increased using ACC systems.
Automobile original equipment manufacturers are also creating new, advanced ADAS systems. For instance, several OEMs are creating ADAS systems that can steer the car automatically to prevent collisions. Other OEMs are working on ADAS technologies that will aid drivers in parking and navigating traffic. As ADAS systems spread and become more widely available, they are likely to have a big impact on how we drive. ADAS technologies may help fewer accidents and fatalities occur on the road. Additionally, they can improve the convenience and comfort of driving.
The major players are Cargo Carriers, UPS, FedEx, Ceva Holdings, Tuma Transport, Swift Transport, Interlogix, Transtech Logistics Procet, Concargo and others playres
Overall, ADAS systems are a useful tool for enhancing traffic safety. To make everyone's safety on the roads, automotive OEMs are devoted to creating and adopting innovative ADAS systems.
Report Attributes | Details |
---|---|
Market Size in 2022 | US$ 436.29 Bn |
Market Size by 2030 | US$ 1789 Bn |
CAGR | CAGR of 19.25 % From 2023 to 2030 |
Base Year | 2022 |
Forecast Period | 2023-2030 |
Historical Data | 2019-2021 |
Report Scope & Coverage | Market Size, Segments Analysis, Competitive Landscape, Regional Analysis, DROC & SWOT Analysis, Forecast Outlook |
Key Segments | • By Electric Vehicle, |
• By Automotive Data Management, | |
• By Locomotive Market, | |
• By Electric Scooters, | |
• By Automotive Electronics, | |
• By Autonomous Cars, | |
Regional Analysis/Coverage | North America (US, Canada, Mexico), Europe (Eastern Europe [Poland, Romania, Hungary, Turkey, Rest of Eastern Europe] Western Europe] Germany, France, UK, Italy, Spain, Netherlands, Switzerland, Austria, Rest of Western Europe]), Asia Pacific (China, India, Japan, South Korea, Vietnam, Singapore, Australia, Rest of Asia Pacific), Middle East & Africa (Middle East [UAE, Egypt, Saudi Arabia, Qatar, Rest of Middle East], Africa [Nigeria, South Africa, Rest of Africa], Latin America (Brazil, Argentina, Colombia Rest of Latin America) |
Company Profiles | Cargo Carriers, UPS, FedEx, Ceva Holdings, Tuma Transport, Swift Transport, Interlogix, Transtech Logistics Procet, Concargo and others. |
Key Drivers | • The increase in global sales of vehicles and demand for the passenger vehicles in the rising economies. |
Market Restraints | • The margins of automakers are under pressure as a result of recent increases in the price of raw materials and components. |
Ans: The Global Automotive Industry Market size is valued at USD 436.89 Bn in 2022 and is expected to reach USD 1789 Bn by 2030 and grow at a CAGR of 19.25% over the period of 2023-2030.
ANS: CAGR of 19.25% over the period of 2023-2030.
Ans: The increase in global sales of vehicles and demand for the passenger vehicles in the rising economies.
Ans: The world economy is dealing with a number of issues, such as high inflation and rising interest rates.
ANS: APAC will be the region with the largest share during the forecasted period.
Table of Contents
1. Introduction
1.1 Market Definition
1.2 Scope (Inclusion and Exclusions)
1.3 Research Assumptions
2. Executive Summary
2.1 Market Overview
2.2 Regional Synopsis
2.3 Competitive Summary
3. Research Methodology
3.1 Top-Down Approach
3.2 Bottom-up Approach
3.3. Data Validation
3.4 Primary Interviews
4. Market Dynamics Impact Analysis
4.1 Market Driving Factors Analysis
4.1.2 Drivers
4.1.2 Restraints
4.1.3 Opportunities
4.1.4 Challenges
4.2 PESTLE Analysis
4.3 Porter’s Five Forces Model
5. Statistical Insights and Trends Reporting
5.1Wafer Vehicle Production Volumes, by Region (2023)
5.2 Chip Design Trends (Historic and Future)
5.3 Fab Capacity Utilization (2023)
5.4 Supply Chain Metrics
6. Competitive Landscape
6.1 List of Major Companies, By Region
6.2 Market Share Analysis, By Region
6.3 Vehicle Type Benchmarking
6.3.1 Vehicle Type specifications and features
6.3.2 Pricing
6.4 Strategic Initiatives
6.4.1 Marketing and promotional activities
6.4.2 Distribution and supply chain strategies
6.4.3 Expansion plans and new Vehicle Type launches
6.4.4 Strategic partnerships and collaborations
6.5 Technological Advancements
6.6 Market Positioning and Branding
7. Global Automotive Industry Market Segmentation, by Vehicle Type
7.1 Chapter Overview
7.2 Passenger Car
7.2.1 Passenger Car Global Automotive Industry Market Trends Analysis (2020-2032)
7.2.2 Passenger Car Global Automotive Industry Market Size Estimates and Forecasts to 2032 (USD Billion)
7.2.1 Hatchback
7.2.1.1 Hatchback Global Automotive Industry Market Trends Analysis (2020-2032)
7.2.1.2 Hatchback Global Automotive Industry Market Size Estimates and Forecasts to 2032 (USD Billion)
7.2.2 Sedan
7.2.2.1 Sedan Global Automotive Industry Market Trends Analysis (2020-2032)
7.2.2.2 Sedan Global Automotive Industry Market Size Estimates and Forecasts to 2032 (USD Billion)
7.2.3 SUV
7.2.2.1 SUV Global Automotive Industry Market Trends Analysis (2020-2032)
7.2.2.2 SUV Global Automotive Industry Market Size Estimates and Forecasts to 2032 (USD Billion)
7.2.4 MUV
7.2.2.1 MUV Global Automotive Industry Market Trends Analysis (2020-2032)
7.2.2.2 MUV Global Automotive Industry Market Size Estimates and Forecasts to 2032 (USD Billion)
7.3 Commercial Vehicle
7.3.1 Commercial Vehicle Global Automotive Industry Market Trends Analysis (2020-2032)
7.3.2 Commercial Vehicle Global Automotive Industry Market Size Estimates and Forecasts to 2032 (USD Billion)
7.3.2 LCVs
7.3.1 LCVs Global Automotive Industry Market Trends Analysis (2020-2032)
7.3.2 LCVs Global Automotive Industry Market Size Estimates and Forecasts to 2032 (USD Billion)
7.3.3 Heavy Trucks
7.3.1 Heavy Trucks Global Automotive Industry Market Trends Analysis (2020-2032)
7.3.2 Heavy Trucks Global Automotive Industry Market Size Estimates and Forecasts to 2032 (USD Billion)
7.3.4 Buses & Coaches
7.3.1 Buses & Coaches Global Automotive Industry Market Trends Analysis (2020-2032)
7.3.2 Buses & Coaches Global Automotive Industry Market Size Estimates and Forecasts to 2032 (USD Billion)
8. Global Automotive Industry Market Segmentation, by Propulsion Type
8.1 Chapter Overview
8.2 ICE Vehicles
8.2.1 ICE Vehicles Market Trends Analysis (2020-2032)
8.2.2 ICE Vehicles Market Size Estimates and Forecasts to 2032 (USD Billion)
8.3 Electric Vehicle
8.3.1 Electric Vehicle Market Trends Analysis (2020-2032)
8.3.2 Electric Vehicle Market Size Estimates and Forecasts to 2032 (USD Billion)
9. Regional Analysis
9.1 Chapter Overview
9.2 North America
9.2.1 Trends Analysis
9.2.2 North America Automotive Industry Market Estimates and Forecasts, by Country (2020-2032) (USD Billion)
9.2.3 North America Automotive Industry Market Estimates and Forecasts, by Vehicle Type (2020-2032) (USD Billion)
9.2.4 North America Automotive Industry Market Estimates and Forecasts, by Propulsion Type (2020-2032) (USD Billion)
9.2.5 USA
9.2.5.1 USA Automotive Industry Market Estimates and Forecasts, by Vehicle Type (2020-2032) (USD Billion)
9.2.5.2 USA Automotive Industry Market Estimates and Forecasts, by Propulsion Type (2020-2032) (USD Billion)
9.2.6 Canada
9.2.6.1 Canada Automotive Industry Market Estimates and Forecasts, by Vehicle Type (2020-2032) (USD Billion)
9.2.6.2 Canada Automotive Industry Market Estimates and Forecasts, by Propulsion Type (2020-2032) (USD Billion)
9.2.7 Mexico
9.2.7.1 Mexico Automotive Industry Market Estimates and Forecasts, by Vehicle Type (2020-2032) (USD Billion)
9.2.7.2 Mexico Automotive Industry Market Estimates and Forecasts, by Propulsion Type (2020-2032) (USD Billion)
9.3 Europe
9.3.1 Eastern Europe
9.3.1.1 Trends Analysis
9.3.1.2 Eastern Europe Automotive Industry Market Estimates and Forecasts, by Country (2020-2032) (USD Billion)
9.3.1.3 Eastern Europe Automotive Industry Market Estimates and Forecasts, by Vehicle Type (2020-2032) (USD Billion)
9.3.1.4 Eastern Europe Automotive Industry Market Estimates and Forecasts, by Propulsion Type (2020-2032) (USD Billion)
9.3.1.5 Poland
9.3.1.5.1 Poland Automotive Industry Market Estimates and Forecasts, by Vehicle Type (2020-2032) (USD Billion)
9.3.1.5.2 Poland Automotive Industry Market Estimates and Forecasts, by Propulsion Type (2020-2032) (USD Billion)
9.3.1.6 Romania
9.3.1.6.1 Romania Automotive Industry Market Estimates and Forecasts, by Vehicle Type (2020-2032) (USD Billion)
9.3.1.6.2 Romania Automotive Industry Market Estimates and Forecasts, by Propulsion Type (2020-2032) (USD Billion)
9.3.1.7 Hungary
9.3.1.7.1 Hungary Automotive Industry Market Estimates and Forecasts, by Vehicle Type (2020-2032) (USD Billion)
9.3.1.7.2 Hungary Automotive Industry Market Estimates and Forecasts, by Propulsion Type (2020-2032) (USD Billion)
9.3.1.8 Turkey
9.3.1.8.1 Turkey Automotive Industry Market Estimates and Forecasts, by Vehicle Type (2020-2032) (USD Billion)
9.3.1.8.2 Turkey Automotive Industry Market Estimates and Forecasts, by Propulsion Type (2020-2032) (USD Billion)
9.3.1.9 Rest of Eastern Europe
9.3.1.9.1 Rest of Eastern Europe Automotive Industry Market Estimates and Forecasts, by Vehicle Type (2020-2032) (USD Billion)
9.3.1.9.2 Rest of Eastern Europe Automotive Industry Market Estimates and Forecasts, by Propulsion Type (2020-2032) (USD Billion)
9.3.2 Western Europe
9.3.2.1 Trends Analysis
9.3.2.2 Western Europe Automotive Industry Market Estimates and Forecasts, by Country (2020-2032) (USD Billion)
9.3.2.3 Western Europe Automotive Industry Market Estimates and Forecasts, by Vehicle Type (2020-2032) (USD Billion)
9.3.2.4 Western Europe Automotive Industry Market Estimates and Forecasts, by Propulsion Type (2020-2032) (USD Billion)
9.3.2.5 Germany
9.3.2.5.1 Germany Automotive Industry Market Estimates and Forecasts, by Vehicle Type (2020-2032) (USD Billion)
9.3.2.5.2 Germany Automotive Industry Market Estimates and Forecasts, by Propulsion Type (2020-2032) (USD Billion)
9.3.2.6 France
9.3.2.6.1 France Automotive Industry Market Estimates and Forecasts, by Vehicle Type (2020-2032) (USD Billion)
9.3.2.6.2 France Automotive Industry Market Estimates and Forecasts, by Propulsion Type (2020-2032) (USD Billion)
9.3.2.7 UK
9.3.2.7.1 UK Automotive Industry Market Estimates and Forecasts, by Vehicle Type (2020-2032) (USD Billion)
9.3.2.7.2 UK Automotive Industry Market Estimates and Forecasts, by Propulsion Type (2020-2032) (USD Billion)
9.3.2.8 Italy
9.3.2.8.1 Italy Automotive Industry Market Estimates and Forecasts, by Vehicle Type (2020-2032) (USD Billion)
9.3.2.8.2 Italy Automotive Industry Market Estimates and Forecasts, by Propulsion Type (2020-2032) (USD Billion)
9.3.2.9 Spain
9.3.2.9.1 Spain Automotive Industry Market Estimates and Forecasts, by Vehicle Type (2020-2032) (USD Billion)
9.3.2.9.2 Spain Automotive Industry Market Estimates and Forecasts, by Propulsion Type (2020-2032) (USD Billion)
9.3.2.10 Netherlands
9.3.2.10.1 Netherlands Automotive Industry Market Estimates and Forecasts, by Vehicle Type (2020-2032) (USD Billion)
9.3.2.10.2 Netherlands Automotive Industry Market Estimates and Forecasts, by Propulsion Type (2020-2032) (USD Billion)
9.3.2.11 Switzerland
9.3.2.11.1 Switzerland Automotive Industry Market Estimates and Forecasts, by Vehicle Type (2020-2032) (USD Billion)
9.3.2.11.2 Switzerland Automotive Industry Market Estimates and Forecasts, by Propulsion Type (2020-2032) (USD Billion)
9.3.2.12 Austria
9.3.2.12.1 Austria Automotive Industry Market Estimates and Forecasts, by Vehicle Type (2020-2032) (USD Billion)
9.3.2.12.2 Austria Automotive Industry Market Estimates and Forecasts, by Propulsion Type (2020-2032) (USD Billion)
9.3.2.13 Rest of Western Europe
9.3.2.13.1 Rest of Western Europe Automotive Industry Market Estimates and Forecasts, by Vehicle Type (2020-2032) (USD Billion)
9.3.2.13.2 Rest of Western Europe Automotive Industry Market Estimates and Forecasts, by Propulsion Type (2020-2032) (USD Billion)
9.4 Asia Pacific
9.4.1 Trends Analysis
9.4.2 Asia Pacific Automotive Industry Market Estimates and Forecasts, by Country (2020-2032) (USD Billion)
9.4.3 Asia Pacific Automotive Industry Market Estimates and Forecasts, by Vehicle Type (2020-2032) (USD Billion)
9.4.4 Asia Pacific Automotive Industry Market Estimates and Forecasts, by Propulsion Type (2020-2032) (USD Billion)
9.4.5 China
9.4.5.1 China Automotive Industry Market Estimates and Forecasts, by Vehicle Type (2020-2032) (USD Billion)
9.4.5.2 China Automotive Industry Market Estimates and Forecasts, by Propulsion Type (2020-2032) (USD Billion)
9.4.6 India
9.4.5.1 India Automotive Industry Market Estimates and Forecasts, by Vehicle Type (2020-2032) (USD Billion)
9.4.5.2 India Automotive Industry Market Estimates and Forecasts, by Propulsion Type (2020-2032) (USD Billion)
9.4.5 Japan
9.4.5.1 Japan Automotive Industry Market Estimates and Forecasts, by Vehicle Type (2020-2032) (USD Billion)
9.4.5.2 Japan Automotive Industry Market Estimates and Forecasts, by Propulsion Type (2020-2032) (USD Billion)
9.4.6 South Korea
9.4.6.1 South Korea Automotive Industry Market Estimates and Forecasts, by Vehicle Type (2020-2032) (USD Billion)
9.4.6.2 South Korea Automotive Industry Market Estimates and Forecasts, by Propulsion Type (2020-2032) (USD Billion)
9.4.7 Vietnam
9.4.7.1 Vietnam Automotive Industry Market Estimates and Forecasts, by Vehicle Type (2020-2032) (USD Billion)
9.2.7.2 Vietnam Automotive Industry Market Estimates and Forecasts, by Propulsion Type (2020-2032) (USD Billion)
9.4.8 Singapore
9.4.8.1 Singapore Automotive Industry Market Estimates and Forecasts, by Vehicle Type (2020-2032) (USD Billion)
9.4.8.2 Singapore Automotive Industry Market Estimates and Forecasts, by Propulsion Type (2020-2032) (USD Billion)
9.4.9 Australia
9.4.9.1 Australia Automotive Industry Market Estimates and Forecasts, by Vehicle Type (2020-2032) (USD Billion)
9.4.9.2 Australia Automotive Industry Market Estimates and Forecasts, by Propulsion Type (2020-2032) (USD Billion)
9.4.10 Rest of Asia Pacific
9.4.10.1 Rest of Asia Pacific Automotive Industry Market Estimates and Forecasts, by Vehicle Type (2020-2032) (USD Billion)
9.4.10.2 Rest of Asia Pacific Automotive Industry Market Estimates and Forecasts, by Propulsion Type (2020-2032) (USD Billion)
9.5 Middle East and Africa
9.5.1 Middle East
9.5.1.1 Trends Analysis
9.5.1.2 Middle East Automotive Industry Market Estimates and Forecasts, by Country (2020-2032) (USD Billion)
9.5.1.3 Middle East Automotive Industry Market Estimates and Forecasts, by Vehicle Type (2020-2032) (USD Billion)
9.5.1.4 Middle East Automotive Industry Market Estimates and Forecasts, by Propulsion Type (2020-2032) (USD Billion)
9.5.1.5 UAE
9.5.1.5.1 UAE Automotive Industry Market Estimates and Forecasts, by Vehicle Type (2020-2032) (USD Billion)
9.5.1.5.2 UAE Automotive Industry Market Estimates and Forecasts, by Propulsion Type (2020-2032) (USD Billion)
9.5.1.6 Egypt
9.5.1.6.1 Egypt Automotive Industry Market Estimates and Forecasts, by Vehicle Type (2020-2032) (USD Billion)
9.5.1.6.2 Egypt Automotive Industry Market Estimates and Forecasts, by Propulsion Type (2020-2032) (USD Billion)
9.5.1.7 Saudi Arabia
9.5.1.7.1 Saudi Arabia Automotive Industry Market Estimates and Forecasts, by Vehicle Type (2020-2032) (USD Billion)
9.5.1.7.2 Saudi Arabia Automotive Industry Market Estimates and Forecasts, by Propulsion Type (2020-2032) (USD Billion)
9.5.1.8 Qatar
9.5.1.8.1 Qatar Automotive Industry Market Estimates and Forecasts, by Vehicle Type (2020-2032) (USD Billion)
9.5.1.8.2 Qatar Automotive Industry Market Estimates and Forecasts, by Propulsion Type (2020-2032) (USD Billion)
9.5.1.9 Rest of Middle East
9.5.1.9.1 Rest of Middle East Automotive Industry Market Estimates and Forecasts, by Vehicle Type (2020-2032) (USD Billion)
9.5.1.9.2 Rest of Middle East Automotive Industry Market Estimates and Forecasts, by Propulsion Type (2020-2032) (USD Billion)
9.5.2 Africa
9.5.2.1 Trends Analysis
9.5.2.2 Africa Automotive Industry Market Estimates and Forecasts, by Country (2020-2032) (USD Billion)
9.5.2.3 Africa Automotive Industry Market Estimates and Forecasts, by Vehicle Type (2020-2032) (USD Billion)
9.5.2.4 Africa Automotive Industry Market Estimates and Forecasts, by Propulsion Type (2020-2032) (USD Billion)
9.5.2.5 South Africa
9.5.2.5.1 South Africa Automotive Industry Market Estimates and Forecasts, by Vehicle Type (2020-2032) (USD Billion)
9.5.2.5.2 South Africa Automotive Industry Market Estimates and Forecasts, by Propulsion Type (2020-2032) (USD Billion)
9.5.2.6 Nigeria
9.5.2.6.1 Nigeria Automotive Industry Market Estimates and Forecasts, by Vehicle Type (2020-2032) (USD Billion)
9.5.2.6.2 Nigeria Automotive Industry Market Estimates and Forecasts, by Propulsion Type (2020-2032) (USD Billion)
9.5.2.7 Rest of Africa
9.5.2.7.1 Rest of Africa Automotive Industry Market Estimates and Forecasts, by Component (2020-2032) (USD Billion)
9.5.2.7.2 Rest of Africa Automotive Industry Market Estimates and Forecasts, by Technology (2020-2032) (USD Billion)
9.6 Latin America
9.6.1 Trends Analysis
9.6.2 Latin America Automotive Industry Market Estimates and Forecasts, by Country (2020-2032) (USD Billion)
9.6.3 Latin America Automotive Industry Market Estimates and Forecasts, by Vehicle Type (2020-2032) (USD Billion)
9.6.4 Latin America Automotive Industry Market Estimates and Forecasts, by Propulsion Type (2020-2032) (USD Billion)
9.6.5 Brazil
9.6.5.1 Brazil Automotive Industry Market Estimates and Forecasts, by Vehicle Type (2020-2032) (USD Billion)
9.6.5.2 Brazil Automotive Industry Market Estimates and Forecasts, by Propulsion Type (2020-2032) (USD Billion)
9.6.6 Argentina
9.6.6.1 Argentina Automotive Industry Market Estimates and Forecasts, by Vehicle Type (2020-2032) (USD Billion)
9.6.6.2 Argentina Automotive Industry Market Estimates and Forecasts, by Propulsion Type (2020-2032) (USD Billion)
9.6.7 Colombia
9.6.7.1 Colombia Automotive Industry Market Estimates and Forecasts, by Vehicle Type (2020-2032) (USD Billion)
9.6.7.2 Colombia Automotive Industry Market Estimates and Forecasts, by Propulsion Type (2020-2032) (USD Billion)
9.6.8 Rest of Latin America
9.6.8.1 Rest of Latin America Automotive Industry Market Estimates and Forecasts, by Vehicle Type (2020-2032) (USD Billion)
9.6.8.2 Rest of Latin America Automotive Industry Market Estimates and Forecasts, by Propulsion Type (2020-2032) (USD Billion)
10. Company Profiles
10.1 Bright LED Electronics Corporation
10.1.1 Company Overview
10.1.2 Financial
10.1.3 Products/ Services Offered
110.1.4 SWOT Analysis
10.2 AVA Technologies
10.2.1 Company Overview
10.2.2 Financial
10.2.3 Products/ Services Offered
10.2.4 SWOT Analysis
10.3 Bridgelux, Inc.
10.3.1 Company Overview
10.3.2 Financial
10.3.3 Products/ Services Offered
10.3.4 SWOT Analysis
10.4 Hitachi Cable, Ltd.
10.4.1 Company Overview
10.4.2 Financial
10.4.3 Products/ Services Offered
10.4.4 SWOT Analysis
10.5 Dowa Electronics Materials Co., Ltd.
10.5.1 Company Overview
10.5.2 Financial
10.5.3 Products/ Services Offered
10.5.4 SWOT Analysis
10.6 Optek Technology,
10.6.1 Company Overview
10.6.2 Financial
10.6.3 Products/ Services Offered
10.6.4 SWOT Analysis
10.7 Cree LED
10.7.1 Company Overview
10.7.2 Financial
10.7.3 Products/ Services Offered
10.7.4 SWOT Analysis
10.8 Nichia Corporation
10.8.1 Company Overview
10.8.2 Financial
10.8.3 Products/ Services Offered
10.8.4 SWOT Analysis
10.9 Epistar Corporation
10.9.1 Company Overview
10.9.2 Financial
10.9.3 Products/ Services Offered
10.9.4 SWOT Analysis
10.10 Huga Optech, Inc.
10.9.1 Company Overview
10.9.2 Financial
10.9.3 Products/ Services Offered
10.9.4 SWOT Analysis
11. Use Cases and Best Practices
12. Conclusion
An accurate research report requires proper strategizing as well as implementation. There are multiple factors involved in the completion of good and accurate research report and selecting the best methodology to compete the research is the toughest part. Since the research reports we provide play a crucial role in any company’s decision-making process, therefore we at SNS Insider always believe that we should choose the best method which gives us results closer to reality. This allows us to reach at a stage wherein we can provide our clients best and accurate investment to output ratio.
Each report that we prepare takes a timeframe of 350-400 business hours for production. Starting from the selection of titles through a couple of in-depth brain storming session to the final QC process before uploading our titles on our website we dedicate around 350 working hours. The titles are selected based on their current market cap and the foreseen CAGR and growth.
The 5 steps process:
Step 1: Secondary Research:
Secondary Research or Desk Research is as the name suggests is a research process wherein, we collect data through the readily available information. In this process we use various paid and unpaid databases which our team has access to and gather data through the same. This includes examining of listed companies’ annual reports, Journals, SEC filling etc. Apart from this our team has access to various associations across the globe across different industries. Lastly, we have exchange relationships with various university as well as individual libraries.
Step 2: Primary Research
When we talk about primary research, it is a type of study in which the researchers collect relevant data samples directly, rather than relying on previously collected data. This type of research is focused on gaining content specific facts that can be sued to solve specific problems. Since the collected data is fresh and first hand therefore it makes the study more accurate and genuine.
We at SNS Insider have divided Primary Research into 2 parts.
Part 1 wherein we interview the KOLs of major players as well as the upcoming ones across various geographic regions. This allows us to have their view over the market scenario and acts as an important tool to come closer to the accurate market numbers. As many as 45 paid and unpaid primary interviews are taken from both the demand and supply side of the industry to make sure we land at an accurate judgement and analysis of the market.
This step involves the triangulation of data wherein our team analyses the interview transcripts, online survey responses and observation of on filed participants. The below mentioned chart should give a better understanding of the part 1 of the primary interview.
Part 2: In this part of primary research the data collected via secondary research and the part 1 of the primary research is validated with the interviews from individual consultants and subject matter experts.
Consultants are those set of people who have at least 12 years of experience and expertise within the industry whereas Subject Matter Experts are those with at least 15 years of experience behind their back within the same space. The data with the help of two main processes i.e., FGDs (Focused Group Discussions) and IDs (Individual Discussions). This gives us a 3rd party nonbiased primary view of the market scenario making it a more dependable one while collation of the data pointers.
Step 3: Data Bank Validation
Once all the information is collected via primary and secondary sources, we run that information for data validation. At our intelligence centre our research heads track a lot of information related to the market which includes the quarterly reports, the daily stock prices, and other relevant information. Our data bank server gets updated every fortnight and that is how the information which we collected using our primary and secondary information is revalidated in real time.
Step 4: QA/QC Process
After all the data collection and validation our team does a final level of quality check and quality assurance to get rid of any unwanted or undesired mistakes. This might include but not limited to getting rid of the any typos, duplication of numbers or missing of any important information. The people involved in this process include technical content writers, research heads and graphics people. Once this process is completed the title gets uploader on our platform for our clients to read it.
Step 5: Final QC/QA Process:
This is the last process and comes when the client has ordered the study. In this process a final QA/QC is done before the study is emailed to the client. Since we believe in giving our clients a good experience of our research studies, therefore, to make sure that we do not lack at our end in any way humanly possible we do a final round of quality check and then dispatch the study to the client.
Key Segments
By Vehicle Type
Hatchback
Sedan
SUV
MUV
LCVs
Heavy Trucks
Buses & Coaches
By Propulsion Type
ICE Vehicles
Electric Vehicles
Request for Segment Customization as per your Business Requirement: Segment Customization Request
Regional Coverage
North America
US
Canada
Mexico
Europe
Eastern Europe
Poland
Romania
Hungary
Turkey
Rest of Eastern Europe
Western Europe
Germany
France
UK
Italy
Spain
Netherlands
Switzerland
Austria
Rest of Western Europe
Asia Pacific
China
India
Japan
South Korea
Vietnam
Singapore
Australia
Rest of Asia Pacific
Middle East & Africa
Middle East
UAE
Egypt
Saudi Arabia
Qatar
Rest of the Middle East
Africa
Nigeria
South Africa
Rest of Africa
Latin America
Brazil
Argentina
Colombia
Rest of Latin America
Request for Country Level Research Report: Country Level Customization Request
Available Customization
With the given market data, SNS Insider offers customization as per the company’s specific needs. The following customization options are available for the report:
Product Analysis
Criss-Cross segment analysis (e.g. Product X Application)
Product Matrix which gives a detailed comparison of product portfolio of each company
Geographic Analysis
Additional countries in any of the regions
Company Information
Detailed analysis and profiling of additional market players (Up to five)
The Car Rental Market Size was valued at USD 130.45 billion in 2023 and will reach USD 311.63 billion by 2031 and grow at a CAGR of 11.5% by 2024-2031
The Automotive Biometric Market Size was valued at USD 1.4 billion in 2023 and is expected to reach USD 6.45 billion by 2032 and grow at a CAGR of 16.39% over the forecast period 2024-2032.
The Luxury Car Market Size was valued at USD 658.43 billion in 2023, and will reach to USD 1210.49 billion by 2032, and grow at a CAGR of 7% by 2024-2032.
The Automotive USB Power Delivery System Market Size was valued at USD 512.26 million in 2023 and is expected to reach USD 1925.51 million by 2031 and grow at a CAGR of 18% over the forecast period 2024-2031.
The Micro-Mobility Market size was valued at USD 3.64 billion in 2023 and will reach USD 10.84 billion by 2032 and grow at a CAGR of 12.9% by 2024-2032
The Automotive Radiator Fan Market Size was valued at USD 8.3 billion in 2023 and is expected to reach USD 12.72 billion by 2031 and grow at a CAGR of 5.48% over the forecast period 2024-2031.
Hi! Click one of our member below to chat on Phone