Get More Information on GCCs in the BFSI Market - Request Sample Report
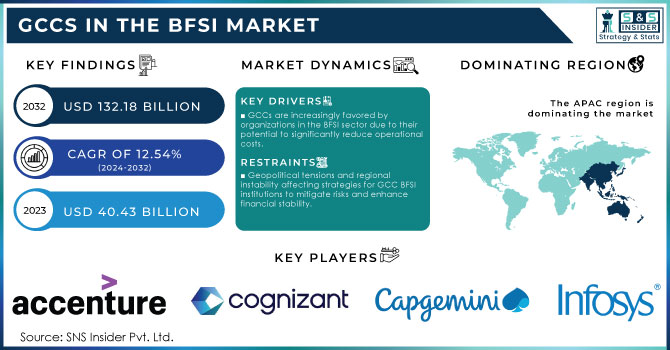
The GCCs in the BFSI Market Size were valued at USD 40.43 billion in 2023 and are expected to reach USD 132.18 Billion by 2032, growing at a CAGR of 12.54% over the forecast period 2024-2032.
The global capability centers (GCCs) in the banking, financial services, and insurance (BFSI) market represent a strategic shift in how organizations operate in an increasingly digital and competitive landscape, primarily driven by the need for cost optimization. As financial institutions face rising regulatory pressures and the demand for enhanced customer experiences, they must discover effective ways to streamline operations without sacrificing quality. GCCs enable organizations to centralize their operations, reducing redundancies and reducing costs. This shift is crucial in a market where profit margins are often tight and the pressure to innovate is relentless. For instance, India is now home to 170-175 BFSI GCCs operated by around 85-90 multinational corporations (MNCs). Key cities such as Bengaluru, Mumbai, and Delhi NCR lead the sector, with Bengaluru alone accounting for 30% of all centers. These centers employ approximately 540,000 professionals, offering competitive salaries, particularly in technology roles, which are 20% higher than traditional IT services. The future looks promising for BFSI GCCs, with rising demand for advanced tech expertise, regulatory compliance, and further expansion by global banks. A notable example is JPMorgan, which has allocated USD 15 billion for global tech spending, including USD 2 billion dedicated to its India GCC.
GCCs can develop advanced risk management models that utilize big data analytics to identify and mitigate potential risks proactively. This approach not only safeguards the institution’s assets but also enhances its reputation with regulators and customers alike. The regulatory framework for financial institutions, including BFSI GCCs, has identified liquidity risk as a major concern, particularly following bank failures in 2023. The revised "Interagency Policy Statement on Funding and Liquidity Risk Management" from July 2023 underscores the importance of strong contingency funding plans. In 2024, regulatory oversight is focused on ensuring that Global Custodian Banks (GCCs) can manage liquidity stress scenarios using proper asset-liability management (ALM) and participating in asset-liability committees (ALCOs).
Drivers
GCCs are increasingly favored by organizations in the BFSI sector due to their potential to significantly reduce operational costs.
GCCs enable these organizations to tap into qualified workforce at reduced pay scales, particularly in emerging nations like India, the Philippines, and Eastern Europe, where labor expenses are significantly lesser when compared to Western countries. Additionally, GCCs are created to streamline functions like IT services, back-office tasks, customer support, and compliance management. This concentration facilitates a more efficient method, reducing repetitive procedures and utilizing economies of scale. By doing this, BFSI companies can enhance operational efficiency, lower expenses, and increase overall profitability. Furthermore, advancements in automation and artificial intelligence (AI) are crucial in improving operational efficiency in GCCs. Automated tools can manage repetitive tasks like handling transactions, providing customer support, and managing data, thus leading to a decrease in manual work and expenses.
The proliferation of GCCs in the BFSI sector is the access to a global talent pool.
Financial institutions need specialized skills to address increasing complexities in cybersecurity, data analytics, regulatory compliance, and financial technology (fintech) innovations. In their home markets, many of these skills may be rare or costly, but GCCs in countries such as India, China, and Poland provide a wider and more cost-effective talent pool due to their highly educated workforces. GCCs allow BFSI companies to access a wide range of talent, including software engineers, data scientists, and legal, and compliance experts, regardless of location restrictions in their home countries. Having access to talent from around the world ensures that BFSI companies are more prepared to innovate, adapt to regulatory changes, and utilize advanced technologies. Moreover, workers in these areas frequently come into contact with international norms and are knowledgeable about regulatory frameworks that are relevant in various markets, resulting in a stronger and more flexible labor force. BFSI companies can accelerate innovation and technology adoption by setting up GCCs in tech hubs with access to talent proficient in cutting-edge technologies.
Restraints
Geopolitical tensions and regional instability affecting strategies for GCC BFSI institutions to mitigate risks and enhance financial stability.
Geopolitical tensions and regional instability create major obstacles for the Banking, Financial Services, and Insurance (BFSI) sector in the Gulf Cooperation Council (GCC) region, impacting their risk management approaches and financial well-being. Saudi Arabia, the UAE, Qatar, Kuwait, Oman, and Bahrain are situated in a region that has a history of political instability, with diplomatic disagreements, sanctions, and conflicts. These geopolitical factors may cause economic disturbances, affecting foreign investments, trade, and market confidence. In the GCC, uncertainties facing BFSI institutions heighten risks linked to cross-border transactions, foreign exchange fluctuations, and credit defaults. In this kind of environment, banks and financial institutions need to implement strict risk management tactics, like improving their due diligence procedures, spreading out their investment holdings, and holding onto more capital reserves to protect against possible economic disruptions. Moreover, they might concentrate on growing domestic activities instead of global expansions to reduce vulnerability to geopolitical risks.
By Service Type
IT and Digital Services dominated the GCCs in the BFSI market in 2023 with 20% market share, mainly because of the industry's growing dependence on digital transformation and technological incorporation. Financial institutions use these abilities to enhance operational efficiency, provide personalized digital experiences, and improve data security. The increasing demand for IT services is fueled by the transition to digital banking, partnerships with fintech companies, and enhanced data analysis techniques. For instance, JP Morgan Chase has employed its Global Capability Center in India to create digital platforms and improve customer services, with a focus on AI and machine learning solutions.
Core Banking Operations is projected to become the fastest-growing segment within GCCs for the BFSI market, due to the demand for centralized and efficient management of functions like loan processing, account management, and payment systems. It allows financial institutions to keep a single, centralized platform for essential services, leading to improved customer experience and more efficient processes. The increasing use of cloud-based core banking systems continues to speed up this expansion. For example, Citi has utilized its GCCs to automate and oversee essential banking tasks, improving the efficiency of loan approval and transaction processing times.
By Technology:
The digital payments & fintech solutions segment led the market in 2023 with a major market share, mainly driven by the Digital Payments & Fintech Solutions segment. The increasing popularity of this sector is fueled by the rising demand for electronic payments, mobile banking, and digital wallets, especially in the GCC area. The popularity of digital banking services, like contactless payments and real-time fund transfers, is driven by the young population and high smartphone usage in the region. Businesses and consumers in the GCC benefit from secure digital payment gateways provided by companies such as PayTabs, ensuring smooth transactions. Moreover, Ripple offers blockchain solutions for international payments, simplifying money transfers in the area.
Artificial Intelligence (AI) & Machine Learning (ML) is projected to become the fastest-growing segment in the GCCs in the BFSI market during 2024-2032. The use of AI and ML is growing for custom banking experiences, evaluating risks, and detecting fraud. These technologies help banks examine extensive amounts of data, offering anticipatory perspectives and streamlining intricate decision-making processes. For instance, Emirates NBD uses AI-powered chatbots to improve customer service and simplify inquiries. In addition, HSBC utilizes ML algorithms to enhance anti-money laundering (AML) and compliance screenings, resulting in quicker detection of suspicious transactions.
By Company Size
Large size segment dominated the market in 2023 with a 73% market share because of their abundant resources and skill in handling major operations. GCCs are frequently utilized to consolidate back-office tasks, optimize operations, and improve customer interactions across various locations. This allows them to lower expenses and enhance productivity, leading to a more powerful worldwide influence. Major global banks and insurance companies, like JPMorgan Chase and AXA, use GCCs for tasks such as risk management, data analysis, and intricate financial modeling to stay ahead in the international market by making use of their extensive resources.
The small and mid-size segment is anticipated to become the fastest-growing segment during 2024-2032. These companies frequently concentrate on specialized financial services and solutions tailored to meet particular market requirements. They also use GCCs to reduce costs and expand operations without making large infrastructure investments. Instances of fintech startups and regional banks utilizing GCCs to create mobile banking apps or to improve customer satisfaction with chatbots.
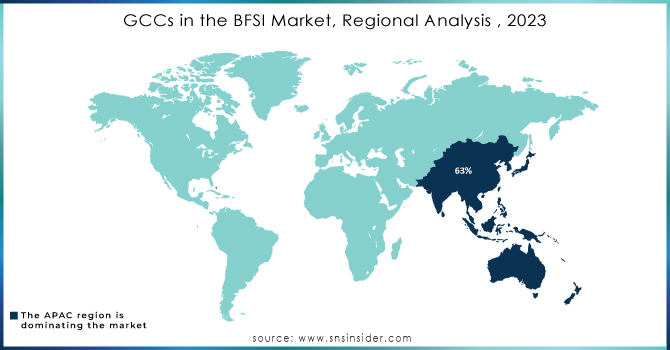
The APAC region held the major market share of 63% in 2023 and led the market, due to its vast population and rapidly expanding economies like China, India, and Southeast Asia, holds a dominant position in the GCC BFSI market. The rise of digital banking, fintech innovations, and increased investment in advanced technologies like AI and blockchain drive growth. Countries in the APAC region are leveraging GCCs to improve customer engagement, streamline operations, and enhance service offerings. Companies like Tencent and Ant Group in China, and Infosys in India, are utilizing GCCs to enhance financial inclusion and develop seamless banking experiences.
Although India is still a popular choice because of its large skilled workforce and cost benefits, many other countries also offer attractive opportunities for Global Capability Centers (GCCs). The Philippines is famous for its proficient English speakers and vast expertise in Business Process Outsourcing (BPO), specifically in IT and customer service fields. Poland is becoming increasingly popular for IT services due to its strong presence of technical graduates and convenient integration for European operations. Ireland provides attractive corporate tax rates and a talented workforce specializing in IT, pharmaceuticals, and finance. Malaysia is known for its strong infrastructure and attractive government benefits, particularly in the fields of IT and HR services. Vietnam's burgeoning economy and affordable prices make it appealing for IT and software development. Mexico enjoys advantages from being near the United States and having a strong manufacturing industry. Romania is known for its robust technical education system and affordable prices, especially in the field of IT services. In conclusion, Canada has a well-educated workforce and a good quality of life, making it an attractive destination for the technology and finance industries.
Need Any Customization Research On GCCs in the BFSI Market - Inquiry Now
The major key players in the GCCs in the BFSI Market are:
Accenture (Digital Banking Solutions, Fraud Detection Services)
Cognizant (Cognizant Banking Platform, Insurance Services)
TCS (Tata Consultancy Services) (TCS BaNCS, TCS iON)
Infosys (Finacle Banking Solution, Infosys Risk and Compliance Management)
Wipro (Wipro HOLMES, Wipro’s Digital Banking Suite)
HCL Technologies (HCL Banking and Financial Services, HCL Cybersecurity Services)
Capgemini (Capgemini Financial Services Solutions, Capgemini Digital Insurance Services)
IBM (IBM Watson Financial Services, IBM Cloud for Financial Services)
Deloitte (Deloitte Digital Banking, Risk Management Solutions)
EY (Ernst & Young) (EY Financial Services Advisory, EY Risk Transformation)
KPMG (KPMG Digital Transformation, KPMG Regulatory Services)
FIS (FIS Modern Banking Platform, FIS Risk and Compliance Management)
SAS (SAS Analytics for Banking, SAS Fraud Management)
Oracle (Oracle Financial Services Analytical Applications, Oracle Banking Digital Experience)
SAP (SAP Banking Services, SAP Financial Services)
MUFG (Mitsubishi UFJ Financial Group) (MUFG Banking Solutions, MUFG Digital Transformation)
Standard Chartered (Standard Chartered FinTech Investments, SC Ventures)
BNP Paribas (BNP Paribas Digital Banking Solutions, BNP Paribas Corporate & Institutional Banking)
JP Morgan Chase (JP Morgan Payments, JPMorgan Digital Banking)
HSBC (HSBC Global Banking and Markets, HSBC Digital Solutions)
American Express (Payment Solutions, Fraud Detection Services)
Visa (Payment Processing Solutions, Risk Management Solutions)
Mastercard (Payment Gateway Services, Data Analytics Solutions)
PayPal (Digital Wallet Services, Merchant Solutions)
BNY Mellon (Investment Management Services, Custody Solutions)
Goldman Sachs (Investment Banking Services, Asset Management Solutions)
September 18, 2024: Global tech giant Microsoft spent close to about Rs 1,000 crore to acquire two land parcels in the IT district of Hinjewadi over the past two months in a strategic acquisition that will allow the technology major to establish its footprint in the country.
September 2, 2024: Bengaluru emerged as the talent magnet and one-stop destination for active talent with ideal skills for the BFSI Global Capability Centers according to the report. The city hosts about 35 percent of the country’s BFSI GCCs and boasts about having 26 percent of the active talent pool with mandatory/accommodative skills.
January 31, 2024: Mizuho Financial Group, Japan’s third-largest financial services group, established its Global Business Centre in Chennai. The Chennai center will play a vital role in managing high-end IT/ITeS such as Robotic Process Automation RPA, Artificial Intelligence AI, systems development, cybersecurity, and general banking operations.
| Report Attribute | Details |
|---|---|
| Market Size in 2023 | USD 40.43 Billion |
| Market Size by 2032 | USD 132.18 Billion |
| CAGR | CAGR of 12.54% From 2024 to 2032 |
| Base Year | 2023 |
| Forecast Period | 2024-2032 |
| Historical Data | 2020-2022 |
| Report Scope & Coverage | Market Size, Segments Analysis, Competitive Landscape, Regional Analysis, DROC & SWOT Analysis, Forecast Outlook |
| Key Segments | • By Service Type (Core Banking Operations, Financial Services, Insurance Services, Actuarial Services, IT and Digital Services, Customer Support Services) • By Technology (AI & ML in Banking, Blockchain, Robotic Process Automation (RPA) in BFSI, Big Data and Analytics, Cloud Computing, Cybersecurity Solutions, Digital Payments, Fintech Solutions) • By Company Size (Small, Medium, Large) |
| Regional Analysis/Coverage | North America (US, Canada, Mexico), Europe (Eastern Europe [Poland, Romania, Hungary, Turkey, Rest of Eastern Europe] Western Europe] Germany, France, UK, Italy, Spain, Netherlands, Switzerland, Austria, Rest of Western Europe]), Asia Pacific (China, India, Japan, South Korea, Vietnam, Singapore, Australia, Rest of Asia Pacific), Middle East & Africa (Middle East [UAE, Egypt, Saudi Arabia, Qatar, Rest of Middle East], Africa [Nigeria, South Africa, Rest of Africa], Latin America (Brazil, Argentina, Colombia, Rest of Latin America) |
| Company Profiles | Accenture, Cognizant, TCS (Tata Consultancy Services), Infosys, Wipro, HCL Technologies, Capgemini, IBM, Deloitte, EY (Ernst & Young), KPMG, FIS, SAS, Oracle, SAP, MUFG (Mitsubishi UFJ Financial Group), Standard Chartered, BNP Paribas, JP Morgan Chase, HSBC, American Express, Visa, Mastercard, PayPal, BNY Mellon, Goldman Sachs |
| Key Drivers | • GCCs are increasingly favored by organizations in the BFSI sector due to their potential to significantly reduce operational costs. • The proliferation of GCCs in the BFSI sector is the access to a global talent pool. |
| RESTRAINTS | • Geopolitical tensions and regional instability affecting strategies for GCC BFSI institutions to mitigate risks and enhance financial stability. |
Ans: The GCCs in the BFSI Market are expected to grow at a CAGR of 12.54% during 2024-2032.
Ans: The GCCs in the BFSI Market was USD 40.43 Billion in 2023 and is expected to Reach USD 132.18 Billion by 2032.
Ans: GCCs are increasingly favored by organizations in the BFSI sector due to their potential to significantly reduce operational costs.
Ans: The large size segment dominated the GCCs in the BFSI Market.
Ans: Asia-Pacific dominated the GCCs in the BFSI Market in 2023.
1. Introduction
1.1 Market Definition
1.2 Scope (Inclusion and Exclusions)
1.3 Research Assumptions
2. Executive Summary
2.1 Market Overview
2.2 Regional Synopsis
2.3 Competitive Summary
3. Research Methodology
3.1 Top-Down Approach
3.2 Bottom-up Approach
3.3. Data Validation
3.4 Primary Interviews
4. Market Dynamics Impact Analysis
4.1 Market Driving Factors Analysis
4.1.1 Drivers
4.1.2 Restraints
4.1.3 Opportunities
4.1.4 Challenges
4.2 PESTLE Analysis
4.3 Porter’s Five Forces Model
5. Statistical Insights and Trends Reporting
5.1 GCCs in the BFSI Employee Productivity by Region
5.2 Compliance and Risk Metrics, by Region (2023)
5.3 Technology Adoption Rate
5.3.1 AI Integration
5.4 Geographic Distribution of Services
6. Competitive Landscape
6.1 List of Major Companies, By Region
6.2 Market Share Analysis, By Region
6.3 Product Benchmarking
6.3.1 Product specifications and features
6.3.2 Pricing
6.4 Strategic Initiatives
6.4.1 Marketing and promotional activities
6.4.2 Distribution and supply chain strategies
6.4.3 Expansion plans and new product launches
6.4.4 Strategic partnerships and collaborations
6.5 Technological Advancements
6.6 Market Positioning and Branding
7. GCCs in the BFSI Market Segmentation, by Service Type
7.1 Chapter Overview
7.2 Core Banking Operations
7.2.1 Core Banking Operations Market Trends Analysis (2020-2032)
7.2.2 Core Banking Operations Market Size Estimates and Forecasts to 2032 (USD Billion)
7.3 Financial Services
7.3.1 Financial Services Market Trends Analysis (2020-2032)
7.3.2 Financial Services Market Size Estimates and Forecasts to 2032 (USD Billion)
7.4 Insurance Services
7.4.1 Insurance Services Market Trends Analysis (2020-2032)
7.4.2 Insurance Services Market Size Estimates and Forecasts to 2032 (USD Billion)
7.5 Actuarial Services
7.5.1 Actuarial Services Market Trends Analysis (2020-2032)
7.5.2 Actuarial Services Market Size Estimates and Forecasts to 2032 (USD Billion)
7.6 IT and Digital Services
7.6.1 IT and Digital Services Market Trends Analysis (2020-2032)
7.6.2 IT and Digital Services Market Size Estimates and Forecasts to 2032 (USD Billion)
7.7 Customer Support Services
7.7.1 Customer Support Services Market Trends Analysis (2020-2032)
7.7.2 Customer Support Services Market Size Estimates and Forecasts to 2032 (USD Billion)
8. GCCs in the BFSI Market Segmentation, by Technology
8.1 Chapter Overview
8.2 Artificial Intelligence (AI) & Machine Learning (ML) in Banking
8.2.1 Artificial Intelligence (AI) & Machine Learning (ML) in Banking Market Trends Analysis (2020-2032)
8.2.2 Artificial Intelligence (AI) & Machine Learning (ML) in Banking Market Size Estimates and Forecasts to 2032 (USD Billion)
8.3 Blockchain and Distributed Ledger Technology
8.3.1 Blockchain and Distributed Ledger Technology Market Trends Analysis (2020-2032)
8.3.2 Blockchain and Distributed Ledger Technology Market Size Estimates and Forecasts to 2032 (USD Billion)
8.4 Robotic Process Automation (RPA) in BFSI
8.4.1 Robotic Process Automation (RPA) in BFSI Market Trends Analysis (2020-2032)
8.4.2 Robotic Process Automation (RPA) in BFSI Market Size Estimates and Forecasts to 2032 (USD Billion)
8.6 Big Data and Analytics for Fraud Detection & Risk Management
8.6.1 Big Data and Analytics for Fraud Detection & Risk Management Market Trends Analysis (2020-2032)
8.6.2 Big Data and Analytics for Fraud Detection & Risk Management Market Size Estimates and Forecasts to 2032 (USD Billion)
8.7 Cloud Computing & Digital Transformation
8.7.1 Cloud Computing & Digital Transformation Market Trends Analysis (2020-2032)
8.7.2 Cloud Computing & Digital Transformation Market Size Estimates and Forecasts to 2032 (USD Billion)
8.8 Cybersecurity Solutions
8.8.1 Cybersecurity Solutions Market Trends Analysis (2020-2032)
8.8.2 Cybersecurity Solutions Market Size Estimates and Forecasts to 2032 (USD Billion)
8.9 Digital Payments & Fintech Solutions
8.9.1 Digital Payments & Fintech Solutions Market Trends Analysis (2020-2032)
8.9.2 Digital Payments & Fintech Solutions Market Size Estimates and Forecasts to 2032 (USD Billion)
9. GCCs in the BFSI Market Segmentation, by Company Size
9.1 Chapter Overview
9.2 Small size & Mid Size
9.2.1 Small size & Mid Size Market Trends Analysis (2020-2032)
9.2.2 Small size & Mid Size Market Size Estimates and Forecasts to 2032 (USD Billion)
9.3 Large Size
9.3.1 Large Size Market Trends Analysis (2020-2032)
9.3.2 Large Size Market Size Estimates and Forecasts to 2032 (USD Billion)
10. Regional Analysis
10.1 Chapter Overview
10.2 North America
10.2.1 Trends Analysis
10.2.2 North America GCCs in the BFSI Market Estimates and Forecasts, by Country (2020-2032) (USD Billion)
10.2.3 North America GCCs in the BFSI Market Estimates and Forecasts, by Service Type (2020-2032) (USD Billion)
10.2.4 North America GCCs in the BFSI Market Estimates and Forecasts, by Technology (2020-2032) (USD Billion)
10.2.5 North America GCCs in the BFSI Market Estimates and Forecasts, by Company Size (2020-2032) (USD Billion)
10.2.6 USA
10.2.6.1 USA GCCs in the BFSI Market Estimates and Forecasts, by Service Type (2020-2032) (USD Billion)
10.2.6.2 USA GCCs in the BFSI Market Estimates and Forecasts, by Technology (2020-2032) (USD Billion)
10.2.6.3 USA GCCs in the BFSI Market Estimates and Forecasts, by Company Size (2020-2032) (USD Billion)
10.2.7 Canada
10.2.7.1 Canada GCCs in the BFSI Market Estimates and Forecasts, by Service Type (2020-2032) (USD Billion)
10.2.7.2 Canada GCCs in the BFSI Market Estimates and Forecasts, by Technology (2020-2032) (USD Billion)
10.2.7.3 Canada GCCs in the BFSI Market Estimates and Forecasts, by Company Size (2020-2032) (USD Billion)
10.2.8 Mexico
10.2.8.1 Mexico GCCs in the BFSI Market Estimates and Forecasts, by Service Type (2020-2032) (USD Billion)
10.2.8.2 Mexico GCCs in the BFSI Market Estimates and Forecasts, by Technology (2020-2032) (USD Billion)
10.2.8.3 Mexico GCCs in the BFSI Market Estimates and Forecasts, by Company Size (2020-2032) (USD Billion)
10.3 Europe
10.3.1 Eastern Europe
10.3.1.1 Trends Analysis
10.3.1.2 Eastern Europe GCCs in the BFSI Market Estimates and Forecasts, by Country (2020-2032) (USD Billion)
10.3.1.3 Eastern Europe GCCs in the BFSI Market Estimates and Forecasts, by Service Type (2020-2032) (USD Billion)
10.3.1.4 Eastern Europe GCCs in the BFSI Market Estimates and Forecasts, by Technology (2020-2032) (USD Billion)
10.3.1.5 Eastern Europe GCCs in the BFSI Market Estimates and Forecasts, by Company Size (2020-2032) (USD Billion)
10.3.1.6 Poland
10.3.1.6.1 Poland GCCs in the BFSI Market Estimates and Forecasts, by Service Type (2020-2032) (USD Billion)
10.3.1.6.2 Poland GCCs in the BFSI Market Estimates and Forecasts, by Technology (2020-2032) (USD Billion)
10.3.1.6.3 Poland GCCs in the BFSI Market Estimates and Forecasts, by Company Size (2020-2032) (USD Billion)
10.3.1.7 Romania
10.3.1.7.1 Romania GCCs in the BFSI Market Estimates and Forecasts, by Service Type (2020-2032) (USD Billion)
10.3.1.7.2 Romania GCCs in the BFSI Market Estimates and Forecasts, by Technology (2020-2032) (USD Billion)
10.3.1.7.3 Romania GCCs in the BFSI Market Estimates and Forecasts, by Company Size (2020-2032) (USD Billion)
10.3.1.8 Hungary
10.3.1.8.1 Hungary GCCs in the BFSI Market Estimates and Forecasts, by Service Type (2020-2032) (USD Billion)
10.3.1.8.2 Hungary GCCs in the BFSI Market Estimates and Forecasts, by Technology (2020-2032) (USD Billion)
10.3.1.8.3 Hungary GCCs in the BFSI Market Estimates and Forecasts, by Company Size (2020-2032) (USD Billion)
10.3.1.9 Turkey
10.3.1.9.1 Turkey GCCs in the BFSI Market Estimates and Forecasts, by Service Type (2020-2032) (USD Billion)
10.3.1.9.2 Turkey GCCs in the BFSI Market Estimates and Forecasts, by Technology (2020-2032) (USD Billion)
10.3.1.9.3 Turkey GCCs in the BFSI Market Estimates and Forecasts, by Company Size (2020-2032) (USD Billion)
10.3.1.10 Rest of Eastern Europe
10.3.1.10.1 Rest of Eastern Europe GCCs in the BFSI Market Estimates and Forecasts, by Service Type (2020-2032) (USD Billion)
10.3.1.10.2 Rest of Eastern Europe GCCs in the BFSI Market Estimates and Forecasts, by Technology (2020-2032) (USD Billion)
10.3.1.10.3 Rest of Eastern Europe GCCs in the BFSI Market Estimates and Forecasts, by Company Size (2020-2032) (USD Billion)
10.3.2 Western Europe
10.3.2.1 Trends Analysis
10.3.2.2 Western Europe GCCs in the BFSI Market Estimates and Forecasts, by Country (2020-2032) (USD Billion)
10.3.2.3 Western Europe GCCs in the BFSI Market Estimates and Forecasts, by Service Type (2020-2032) (USD Billion)
10.3.2.4 Western Europe GCCs in the BFSI Market Estimates and Forecasts, by Technology (2020-2032) (USD Billion)
10.3.2.5 Western Europe GCCs in the BFSI Market Estimates and Forecasts, by Company Size (2020-2032) (USD Billion)
10.3.2.6 Germany
10.3.2.6.1 Germany GCCs in the BFSI Market Estimates and Forecasts, by Service Type (2020-2032) (USD Billion)
10.3.2.6.2 Germany GCCs in the BFSI Market Estimates and Forecasts, by Technology (2020-2032) (USD Billion)
10.3.2.6.3 Germany GCCs in the BFSI Market Estimates and Forecasts, by Company Size (2020-2032) (USD Billion)
10.3.2.7 France
10.3.2.7.1 France GCCs in the BFSI Market Estimates and Forecasts, by Service Type (2020-2032) (USD Billion)
10.3.2.7.2 France GCCs in the BFSI Market Estimates and Forecasts, by Technology (2020-2032) (USD Billion)
10.3.2.7.3 France GCCs in the BFSI Market Estimates and Forecasts, by Company Size (2020-2032) (USD Billion)
10.3.2.8 UK
10.3.2.8.1 UK GCCs in the BFSI Market Estimates and Forecasts, by Service Type (2020-2032) (USD Billion)
10.3.2.8.2 UK GCCs in the BFSI Market Estimates and Forecasts, by Technology (2020-2032) (USD Billion)
10.3.2.8.3 UK GCCs in the BFSI Market Estimates and Forecasts, by Company Size (2020-2032) (USD Billion)
10.3.2.9 Italy
10.3.2.9.1 Italy GCCs in the BFSI Market Estimates and Forecasts, by Service Type (2020-2032) (USD Billion)
10.3.2.9.2 Italy GCCs in the BFSI Market Estimates and Forecasts, by Technology (2020-2032) (USD Billion)
10.3.2.9.3 Italy GCCs in the BFSI Market Estimates and Forecasts, by Company Size (2020-2032) (USD Billion)
10.3.2.10 Spain
10.3.2.10.1 Spain GCCs in the BFSI Market Estimates and Forecasts, by Service Type (2020-2032) (USD Billion)
10.3.2.10.2 Spain GCCs in the BFSI Market Estimates and Forecasts, by Technology (2020-2032) (USD Billion)
10.3.2.10.3 Spain GCCs in the BFSI Market Estimates and Forecasts, by Company Size (2020-2032) (USD Billion)
10.3.2.11 Netherlands
10.3.2.11.1 Netherlands GCCs in the BFSI Market Estimates and Forecasts, by Service Type (2020-2032) (USD Billion)
10.3.2.11.2 Netherlands GCCs in the BFSI Market Estimates and Forecasts, by Technology (2020-2032) (USD Billion)
10.3.2.11.3 Netherlands GCCs in the BFSI Market Estimates and Forecasts, by Company Size (2020-2032) (USD Billion)
10.3.2.12 Switzerland
10.3.2.12.1 Switzerland GCCs in the BFSI Market Estimates and Forecasts, by Service Type (2020-2032) (USD Billion)
10.3.2.12.2 Switzerland GCCs in the BFSI Market Estimates and Forecasts, by Technology (2020-2032) (USD Billion)
10.3.2.12.3 Switzerland GCCs in the BFSI Market Estimates and Forecasts, by Company Size (2020-2032) (USD Billion)
10.3.2.13 Austria
10.3.2.13.1 Austria GCCs in the BFSI Market Estimates and Forecasts, by Service Type (2020-2032) (USD Billion)
10.3.2.13.2 Austria GCCs in the BFSI Market Estimates and Forecasts, by Technology (2020-2032) (USD Billion)
10.3.2.13.3 Austria GCCs in the BFSI Market Estimates and Forecasts, by Company Size (2020-2032) (USD Billion)
10.3.2.14 Rest of Western Europe
10.3.2.14.1 Rest of Western Europe GCCs in the BFSI Market Estimates and Forecasts, by Service Type (2020-2032) (USD Billion)
10.3.2.14.2 Rest of Western Europe GCCs in the BFSI Market Estimates and Forecasts, by Technology (2020-2032) (USD Billion)
10.3.2.14.3 Rest of Western Europe GCCs in the BFSI Market Estimates and Forecasts, by Company Size (2020-2032) (USD Billion)
10.4 Asia Pacific
10.4.1 Trends Analysis
10.4.2 Asia Pacific GCCs in the BFSI Market Estimates and Forecasts, by Country (2020-2032) (USD Billion)
10.4.3 Asia Pacific GCCs in the BFSI Market Estimates and Forecasts, by Service Type (2020-2032) (USD Billion)
10.4.4 Asia Pacific GCCs in the BFSI Market Estimates and Forecasts, by Technology (2020-2032) (USD Billion)
10.4.5 Asia Pacific GCCs in the BFSI Market Estimates and Forecasts, by Company Size (2020-2032) (USD Billion)
10.4.6 China
10.4.6.1 China GCCs in the BFSI Market Estimates and Forecasts, by Service Type (2020-2032) (USD Billion)
10.4.6.2 China GCCs in the BFSI Market Estimates and Forecasts, by Technology (2020-2032) (USD Billion)
10.4.6.3 China GCCs in the BFSI Market Estimates and Forecasts, by Company Size (2020-2032) (USD Billion)
10.4.7 India
10.4.7.1 India GCCs in the BFSI Market Estimates and Forecasts, by Service Type (2020-2032) (USD Billion)
10.4.7.2 India GCCs in the BFSI Market Estimates and Forecasts, by Technology (2020-2032) (USD Billion)
10.4.7.3 India GCCs in the BFSI Market Estimates and Forecasts, by Company Size (2020-2032) (USD Billion)
10.4.8 Japan
10.4.8.1 Japan GCCs in the BFSI Market Estimates and Forecasts, by Service Type (2020-2032) (USD Billion)
10.4.8.2 Japan GCCs in the BFSI Market Estimates and Forecasts, by Technology (2020-2032) (USD Billion)
10.4.8.3 Japan GCCs in the BFSI Market Estimates and Forecasts, by Company Size (2020-2032) (USD Billion)
10.4.9 South Korea
10.4.9.1 South Korea GCCs in the BFSI Market Estimates and Forecasts, by Service Type (2020-2032) (USD Billion)
10.4.9.2 South Korea GCCs in the BFSI Market Estimates and Forecasts, by Technology (2020-2032) (USD Billion)
10.4.9.3 South Korea GCCs in the BFSI Market Estimates and Forecasts, by Company Size (2020-2032) (USD Billion)
10.4.10 Vietnam
10.4.10.1 Vietnam GCCs in the BFSI Market Estimates and Forecasts, by Service Type (2020-2032) (USD Billion)
10.4.10.2 Vietnam GCCs in the BFSI Market Estimates and Forecasts, by Technology (2020-2032) (USD Billion)
10.4.10.3 Vietnam GCCs in the BFSI Market Estimates and Forecasts, by Company Size (2020-2032) (USD Billion)
10.4.11 Singapore
10.4.11.1 Singapore GCCs in the BFSI Market Estimates and Forecasts, by Service Type (2020-2032) (USD Billion)
10.4.11.2 Singapore GCCs in the BFSI Market Estimates and Forecasts, by Technology (2020-2032) (USD Billion)
10.4.11.3 Singapore GCCs in the BFSI Market Estimates and Forecasts, by Company Size (2020-2032) (USD Billion)
10.4.12 Australia
10.4.12.1 Australia GCCs in the BFSI Market Estimates and Forecasts, by Service Type (2020-2032) (USD Billion)
10.4.12.2 Australia GCCs in the BFSI Market Estimates and Forecasts, by Technology (2020-2032) (USD Billion)
10.4.12.3 Australia GCCs in the BFSI Market Estimates and Forecasts, by Company Size (2020-2032) (USD Billion)
10.4.13 Rest of Asia Pacific
10.4.13.1 Rest of Asia Pacific GCCs in the BFSI Market Estimates and Forecasts, by Service Type (2020-2032) (USD Billion)
10.4.13.2 Rest of Asia Pacific GCCs in the BFSI Market Estimates and Forecasts, by Technology (2020-2032) (USD Billion)
10.4.13.3 Rest of Asia Pacific GCCs in the BFSI Market Estimates and Forecasts, by Company Size (2020-2032) (USD Billion)
10.5 Middle East and Africa
10.5.1 Middle East
10.5.1.1 Trends Analysis
10.5.1.2 Middle East GCCs in the BFSI Market Estimates and Forecasts, by Country (2020-2032) (USD Billion)
10.5.1.3 Middle East GCCs in the BFSI Market Estimates and Forecasts, by Service Type (2020-2032) (USD Billion)
10.5.1.4 Middle East GCCs in the BFSI Market Estimates and Forecasts, by Technology (2020-2032) (USD Billion)
10.5.1.5 Middle East GCCs in the BFSI Market Estimates and Forecasts, by Company Size (2020-2032) (USD Billion)
10.5.1.6 UAE
10.5.1.6.1 UAE GCCs in the BFSI Market Estimates and Forecasts, by Service Type (2020-2032) (USD Billion)
10.5.1.6.2 UAE GCCs in the BFSI Market Estimates and Forecasts, by Technology (2020-2032) (USD Billion)
10.5.1.6.3 UAE GCCs in the BFSI Market Estimates and Forecasts, by Company Size (2020-2032) (USD Billion)
10.5.1.7 Egypt
10.5.1.7.1 Egypt GCCs in the BFSI Market Estimates and Forecasts, by Service Type (2020-2032) (USD Billion)
10.5.1.7.2 Egypt GCCs in the BFSI Market Estimates and Forecasts, by Technology (2020-2032) (USD Billion)
10.5.1.7.3 Egypt GCCs in the BFSI Market Estimates and Forecasts, by Company Size (2020-2032) (USD Billion)
10.5.1.8 Saudi Arabia
10.5.1.8.1 Saudi Arabia GCCs in the BFSI Market Estimates and Forecasts, by Service Type (2020-2032) (USD Billion)
10.5.1.8.2 Saudi Arabia GCCs in the BFSI Market Estimates and Forecasts, by Technology (2020-2032) (USD Billion)
10.5.1.8.3 Saudi Arabia GCCs in the BFSI Market Estimates and Forecasts, by Company Size (2020-2032) (USD Billion)
10.5.1.9 Qatar
10.5.1.9.1 Qatar GCCs in the BFSI Market Estimates and Forecasts, by Service Type (2020-2032) (USD Billion)
10.5.1.9.2 Qatar GCCs in the BFSI Market Estimates and Forecasts, by Technology (2020-2032) (USD Billion)
10.5.1.9.3 Qatar GCCs in the BFSI Market Estimates and Forecasts, by Company Size (2020-2032) (USD Billion)
10.5.1.10 Rest of Middle East
10.5.1.10.1 Rest of Middle East GCCs in the BFSI Market Estimates and Forecasts, by Service Type (2020-2032) (USD Billion)
10.5.1.10.2 Rest of Middle East GCCs in the BFSI Market Estimates and Forecasts, by Technology (2020-2032) (USD Billion)
10.5.1.10.3 Rest of Middle East GCCs in the BFSI Market Estimates and Forecasts, by Company Size (2020-2032) (USD Billion)
10.5.2 Africa
10.5.2.1 Trends Analysis
10.5.2.2 Africa GCCs in the BFSI Market Estimates and Forecasts, by Country (2020-2032) (USD Billion)
10.5.2.3 Africa GCCs in the BFSI Market Estimates and Forecasts, by Service Type (2020-2032) (USD Billion)
10.5.2.4 Africa GCCs in the BFSI Market Estimates and Forecasts, by Technology (2020-2032) (USD Billion)
10.5.2.5 Africa GCCs in the BFSI Market Estimates and Forecasts, by Company Size (2020-2032) (USD Billion)
10.5.2.6 South Africa
10.5.2.6.1 South Africa GCCs in the BFSI Market Estimates and Forecasts, by Service Type (2020-2032) (USD Billion)
10.5.2.6.2 South Africa GCCs in the BFSI Market Estimates and Forecasts, by Technology (2020-2032) (USD Billion)
10.5.2.6.3 South Africa GCCs in the BFSI Market Estimates and Forecasts, by Company Size (2020-2032) (USD Billion)
10.5.2.7 Nigeria
10.5.2.7.1 Nigeria GCCs in the BFSI Market Estimates and Forecasts, by Service Type (2020-2032) (USD Billion)
10.5.2.7.2 Nigeria GCCs in the BFSI Market Estimates and Forecasts, by Technology (2020-2032) (USD Billion)
10.5.2.7.3 Nigeria GCCs in the BFSI Market Estimates and Forecasts, by Company Size (2020-2032) (USD Billion)
10.5.2.8 Rest of Africa
10.5.2.8.1 Rest of Africa GCCs in the BFSI Market Estimates and Forecasts, by Service Type (2020-2032) (USD Billion)
10.5.2.8.2 Rest of Africa GCCs in the BFSI Market Estimates and Forecasts, by Technology (2020-2032) (USD Billion)
10.5.2.8.3 Rest of Africa GCCs in the BFSI Market Estimates and Forecasts, by Company Size (2020-2032) (USD Billion)
10.6 Latin America
10.6.1 Trends Analysis
10.6.2 Latin America GCCs in the BFSI Market Estimates and Forecasts, by Country (2020-2032) (USD Billion)
10.6.3 Latin America GCCs in the BFSI Market Estimates and Forecasts, by Service Type (2020-2032) (USD Billion)
10.6.4 Latin America GCCs in the BFSI Market Estimates and Forecasts, by Technology (2020-2032) (USD Billion)
10.6.5 Latin America GCCs in the BFSI Market Estimates and Forecasts, by Company Size (2020-2032) (USD Billion)
10.6.6 Brazil
10.6.6.1 Brazil GCCs in the BFSI Market Estimates and Forecasts, by Service Type (2020-2032) (USD Billion)
10.6.6.2 Brazil GCCs in the BFSI Market Estimates and Forecasts, by Technology (2020-2032) (USD Billion)
10.6.6.3 Brazil GCCs in the BFSI Market Estimates and Forecasts, by Company Size (2020-2032) (USD Billion)
10.6.7 Argentina
10.6.7.1 Argentina GCCs in the BFSI Market Estimates and Forecasts, by Service Type (2020-2032) (USD Billion)
10.6.7.2 Argentina GCCs in the BFSI Market Estimates and Forecasts, by Technology (2020-2032) (USD Billion)
10.6.7.3 Argentina GCCs in the BFSI Market Estimates and Forecasts, by Company Size (2020-2032) (USD Billion)
10.6.8 Colombia
10.6.8.1 Colombia GCCs in the BFSI Market Estimates and Forecasts, by Service Type (2020-2032) (USD Billion)
10.6.8.2 Colombia GCCs in the BFSI Market Estimates and Forecasts, by Technology (2020-2032) (USD Billion)
10.6.8.3 Colombia GCCs in the BFSI Market Estimates and Forecasts, by Company Size (2020-2032) (USD Billion)
10.6.9 Rest of Latin America
10.6.9.1 Rest of Latin America GCCs in the BFSI Market Estimates and Forecasts, by Service Type (2020-2032) (USD Billion)
10.6.9.2 Rest of Latin America GCCs in the BFSI Market Estimates and Forecasts, by Technology (2020-2032) (USD Billion)
10.6.9.3 Rest of Latin America GCCs in the BFSI Market Estimates and Forecasts, by Company Size (2020-2032) (USD Billion)
11. Company Profiles
11.1 Accenture
11.1.1 Company Overview
11.1.2 Financial
11.1.3 Products/ Services Offered
11.1.4 SWOT Analysis
11.2 IBM
11.2.1 Company Overview
11.2.2 Financial
11.2.3 Products/ Services Offered
11.2.4 SWOT Analysis
11.3 Deloitte
11.3.1 Company Overview
11.3.2 Financial
11.3.3 Products/ Services Offered
11.3.4 SWOT Analysis
11.4 EY
11.4.1 Company Overview
11.4.2 Financial
11.4.3 Products/ Services Offered
11.4.4 SWOT Analysis
11.5 KPMG
11.5.1 Company Overview
11.5.2 Financial
11.5.3 Products/ Services Offered
11.5.4 SWOT Analysis
11.6 FIS
11.6.1 Company Overview
11.6.2 Financial
11.6.3 Products/ Services Offered
11.6.4 SWOT Analysis
11.7 SAS
11.7.1 Company Overview
11.7.2 Financial
11.7.3 Products/ Services Offered
11.7.4 SWOT Analysis
11.8 Oracle
11.8.1 Company Overview
11.8.2 Financial
11.8.3 Products/ Services Offered
11.8.4 SWOT Analysis
11.9 SAP
11.9.1 Company Overview
11.9.2 Financial
11.9.3 Products/ Services Offered
11.9.4 SWOT Analysis
11.10 JP Morgan Chase
11.10.1 Company Overview
11.10.2 Financial
11.10.3 Products/ Services Offered
11.10.4 SWOT Analysis
12. Use Cases and Best Practices
13. Conclusion
An accurate research report requires proper strategizing as well as implementation. There are multiple factors involved in the completion of good and accurate research report and selecting the best methodology to compete the research is the toughest part. Since the research reports we provide play a crucial role in any company’s decision-making process, therefore we at SNS Insider always believe that we should choose the best method which gives us results closer to reality. This allows us to reach at a stage wherein we can provide our clients best and accurate investment to output ratio.
Each report that we prepare takes a timeframe of 350-400 business hours for production. Starting from the selection of titles through a couple of in-depth brain storming session to the final QC process before uploading our titles on our website we dedicate around 350 working hours. The titles are selected based on their current market cap and the foreseen CAGR and growth.
The 5 steps process:
Step 1: Secondary Research:
Secondary Research or Desk Research is as the name suggests is a research process wherein, we collect data through the readily available information. In this process we use various paid and unpaid databases which our team has access to and gather data through the same. This includes examining of listed companies’ annual reports, Journals, SEC filling etc. Apart from this our team has access to various associations across the globe across different industries. Lastly, we have exchange relationships with various university as well as individual libraries.

Step 2: Primary Research
When we talk about primary research, it is a type of study in which the researchers collect relevant data samples directly, rather than relying on previously collected data. This type of research is focused on gaining content specific facts that can be sued to solve specific problems. Since the collected data is fresh and first hand therefore it makes the study more accurate and genuine.
We at SNS Insider have divided Primary Research into 2 parts.
Part 1 wherein we interview the KOLs of major players as well as the upcoming ones across various geographic regions. This allows us to have their view over the market scenario and acts as an important tool to come closer to the accurate market numbers. As many as 45 paid and unpaid primary interviews are taken from both the demand and supply side of the industry to make sure we land at an accurate judgement and analysis of the market.
This step involves the triangulation of data wherein our team analyses the interview transcripts, online survey responses and observation of on filed participants. The below mentioned chart should give a better understanding of the part 1 of the primary interview.

Part 2: In this part of primary research the data collected via secondary research and the part 1 of the primary research is validated with the interviews from individual consultants and subject matter experts.
Consultants are those set of people who have at least 12 years of experience and expertise within the industry whereas Subject Matter Experts are those with at least 15 years of experience behind their back within the same space. The data with the help of two main processes i.e., FGDs (Focused Group Discussions) and IDs (Individual Discussions). This gives us a 3rd party nonbiased primary view of the market scenario making it a more dependable one while collation of the data pointers.
Step 3: Data Bank Validation
Once all the information is collected via primary and secondary sources, we run that information for data validation. At our intelligence centre our research heads track a lot of information related to the market which includes the quarterly reports, the daily stock prices, and other relevant information. Our data bank server gets updated every fortnight and that is how the information which we collected using our primary and secondary information is revalidated in real time.

Step 4: QA/QC Process
After all the data collection and validation our team does a final level of quality check and quality assurance to get rid of any unwanted or undesired mistakes. This might include but not limited to getting rid of the any typos, duplication of numbers or missing of any important information. The people involved in this process include technical content writers, research heads and graphics people. Once this process is completed the title gets uploader on our platform for our clients to read it.
Step 5: Final QC/QA Process:
This is the last process and comes when the client has ordered the study. In this process a final QA/QC is done before the study is emailed to the client. Since we believe in giving our clients a good experience of our research studies, therefore, to make sure that we do not lack at our end in any way humanly possible we do a final round of quality check and then dispatch the study to the client.
By Service Type
Core Banking Operations
Financial Services
Insurance Services
Actuarial Services
IT and Digital Services
Customer Support Services
By Technology:
Artificial Intelligence (AI) & Machine Learning (ML) in Banking
Blockchain and Distributed Ledger Technology
Robotic Process Automation (RPA) in BFSI
Big Data and Analytics for Fraud Detection & Risk Management
Cloud Computing & Digital Transformation
Cybersecurity Solutions
Digital Payments & Fintech Solutions
Small size & Mid Size
Large size
Request for Segment Customization as per your Business Requirement: Segment Customization Request
REGIONAL COVERAGE:
North America
US
Canada
Mexico
Europe
Eastern Europe
Poland
Romania
Hungary
Turkey
Rest of Eastern Europe
Western Europe
Germany
France
UK
Italy
Spain
Netherlands
Switzerland
Austria
Rest of Western Europe
Asia Pacific
China
India
Japan
South Korea
Vietnam
Singapore
Australia
Rest of Asia Pacific
Middle East & Africa
Middle East
UAE
Egypt
Saudi Arabia
Qatar
Rest of the Middle East
Africa
Nigeria
South Africa
Rest of Africa
Latin America
Brazil
Argentina
Colombia
Rest of Latin America
Request for Country Level Research Report: Country Level Customization Request
Available Customization
With the given market data, SNS Insider offers customization as per the company’s specific needs. The following customization options are available for the report:
Product Analysis
Criss-Cross segment analysis (e.g. Product X Application)
Product Matrix which gives a detailed comparison of the product portfolio of each company
Geographic Analysis
Additional countries in any of the regions
Company Information
Detailed analysis and profiling of additional market players (Up to five)
The Network Transformation Market size was valued at USD 45.93 Billion in 2023 and is expected to reach USD 1700.86 Billion by 2032 and grow at a CAGR of 49.40% over the forecast period 2024-2032.
The Data Center Infrastructure Management Market was valued at USD 2.8 billion in 2023 and is expected to reach USD 8.8 billion by 2032, growing at a CAGR of 13.51% from 2024-2032.
The Managed Learning Service Market size was valued at USD 3.59 Billion in 2023 and is expected to Reach USD 8.79 Billion by 2032 and growing at a CAGR of 10.46% over the forecast period of 2024-2032.
The Media Asset Management Market was valued at USD 1.7 billion in 2023, is expected to grow at a CAGR of 14.1% over 2024-2032 to reach USD 5.6 billion by 2032.
The Speech-To-Text API Market Size was valued at USD 3.3 Billion in 2023 and will reach USD 13.5 Billion by 2032, growing at a CAGR of 17.0% by 2032.
The 5G Network Slicing Market Size was USD 396.2 Million in 2023 & is expected to reach USD 9815.9 Million by 2032, growing at a CAGR of 42.9% by 2024-2032.

Hi! Click one of our member below to chat on Phone
© 2025 All Rights Reserved by SNS Insider Pvt Ltd


