Gas Chromatography Market Report Scope & Overview:
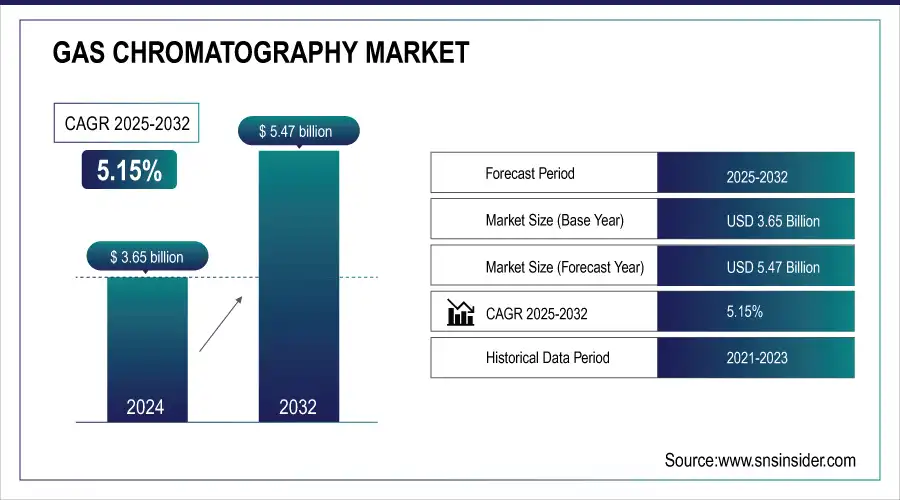
The Gas Chromatography Market Size was valued at USD 3.65 billion in 2025E and is expected to reach USD 5.47 billion by 2033 and grow at a CAGR of 5.15% over the forecast period 2026-2033.
The global gas chromatography market is expanding due to stringent regulatory standards in the pharmaceutical, environmental, and food safety sectors. Key drivers include the rising demand for drug purity testing, air and water quality monitoring, and the detection of food contaminants. Technologically, the industry is shifting toward automated systems, miniaturized portable devices for field use, and AI-driven data analytics. Additionally, laboratory sustainability initiatives are fostering a transition from helium to hydrogen as a more accessible and cost-effective carrier gas.
Market Size and Forecast:
-
Market Size in 2025E: USD 3.65 Billion
-
Market Size by 2033: USD 5.47 Billion
-
CAGR: 5.15% from 2026 to 2033
-
Base Year: 2025
-
Forecast Period: 2026–2033
-
Historical Data: 2022–2024
To Get more information on Gas Chromatography Market - Request Free Sample Report
The U.S. Gas Chromatography market size was valued at an estimated USD 1.45 billion in 2025 and is projected to reach USD 2.20 billion by 2033, growing at a CAGR of 4.9% over the forecast period 2026–2033. Market growth is driven by increasing demand for advanced analytical techniques across pharmaceuticals, biotechnology, environmental testing, food & beverage, and petrochemical industries. Rising focus on quality control, regulatory compliance, and safety standards, along with expanding applications in drug development and environmental monitoring, is accelerating market adoption. Additionally, technological advancements in chromatography systems, automation, and detector sensitivity, coupled with strong research and laboratory infrastructure in the U.S., further support the steady growth outlook of the U.S. gas chromatography market during the forecast period.
Key Gas Chromatography Market Trends
-
Rising demand for gas chromatography in pharmaceutical quality control and drug development.
-
Increasing adoption of GC in food safety testing and flavor & fragrance analysis.
-
Growing applications in environmental monitoring for air and water pollutant detection.
-
Expansion of petrochemical and natural gas analysis driving system demand.
-
Shift toward portable and compact gas chromatography systems for on-site testing.
-
Technological advancements in GC detectors and columns improving sensitivity and speed.
-
Rising concern over helium shortages fueling the adoption of hydrogen and nitrogen as carrier gases.
-
Integration of automation, robotics, and AI-driven software for high-throughput analysis.
Gas Chromatography Market Growth Drivers
-
Advancements in Technology and Rising Demand for Analytical Techniques
The rising use of gas chromatography in pharmaceuticals, environmental analysis, food safety, and petrochemical industries is a key driver for growth. For example, in the pharmaceutical industry, gas chromatography is used in drug purity analysis and regulatory affairs to ensure product safety. The food and beverage sector is also experiencing increased demand owing to stringent quality control standards and contamination detection. Moreover, the increasing emphasis on environmental monitoring, fueled by growing levels of pollution and government intervention, has accelerated the demand for sophisticated chromatographic methods. The increasing laboratory automation trend and the creation of smaller, high-performance instruments, like Agilent's newly introduced 8850 Gas Chromatograph, have further increased market efficiency. Further, rising R&D investments and growth in the biotechnology industry support the market growth. The increasing use of gas chromatography in forensic science, clinical diagnostics, and industrial analysis further contributes to the increasing demand for it. As there are continued innovations, like the use of AI and machine learning in data analysis in chromatography, the market is primed for rapid growth in the coming years.
Gas Chromatography Market Restraints
-
The gas chromatography market faces restraints due to the high cost of instruments and operational complexities.
Gas chromatography systems, particularly those coupled with modern detectors like mass spectrometry, are costly, and thus less affordable for small and medium-sized laboratories. The initial high cost, combined with maintenance expenses and the requirement of highly trained professionals to operate these advanced equipment, hinders extensive use. For example, the price of a highly efficient gas chromatograph with extended features can lie between USD 30,000 and USD 100,000, which imposes a considerable economic burden on the research institute as well as smaller laboratories. Apart from that, the use of specialized gases, columns, and consumables contributes to the cumulative operational cost. Another challenge involves the intricateness of the interpretation of data that needs highly trained experts to facilitate accurate results, which can become a limitation where there are not enough skilled people. The need for particular carrier gases, including helium, that is in low supply and high cost, is also a cause of operational constraints. Although technological improvements are enhancing efficiency, the technical complexity and costs of gas chromatography continue to be a major limitation, possibly hindering its uptake in cost-conscious industries and emerging markets.
Gas Chromatography Market Opportunities
-
Expansion in Emerging Industries and Innovations in Chromatography Techniques
The increasing need for cannabis analysis, biofuel testing, and personalized medicine opens up new growth opportunities for chromatography technology. For example, with the legalization of cannabis in many nations, the need for accurate chromatography methods to analyze potency, impurities, and terpene profiling has increased. In the energy industry, gas chromatography is being used to test biofuels and petrochemicals, ensuring regulatory requirements and product quality. Additionally, innovations in chromatography methods, including the invention of ultra-fast gas chromatography (UFGC) and micro gas chromatography, are broadening the potential of the market. The use of AI and automation in chromatographic processes is also enhancing the efficiency and accuracy of data, facilitating industries to implement these technologies. Furthermore, the increasing emphasis on environmental sustainability has raised the demand for sophisticated chromatography systems in air and water quality monitoring. Collaborations between market players and research institutions to create affordable, high-performance systems are also boosting market opportunities. As industries keep demanding higher accuracy and faster analytical capacity, the growth of gas chromatography into new areas is anticipated to fuel future growth.
Gas Chromatography Market Challenges
-
The stringent regulatory compliance and the shortage of skilled professionals required for instrument operation and data analysis.
Regulatory bodies like the U.S. Food and Drug Administration (FDA) and the European Medicines Agency (EMA) enforce rigorous regulations on chromatography testing in pharmaceuticals, environmental monitoring, and food safety. Compliance with these regulatory needs entails labor-intensive validation processes, compliance documentation, and following Good Laboratory Practices (GLP), which adds to the workload of laboratories. For instance, the drug industry requires gas chromatography techniques applied in the analysis of drugs to comply with international requirements, slowing product approval and incurring higher expenses. Moreover, the industry is hampered by inadequate skilled workers capable of operating advanced chromatography equipment and reading intricate analytical information. The gap is more obvious in developing nations, where learning institutions are not likely to specialize in analytical chemistry procedures. Lack of experts contributes to inefficiencies, data analysis errors, and longer testing times, affecting overall productivity. To overcome these challenges, automation and AI-based chromatography solutions are on the rise. However, overcoming the regulation and skill-based hurdles is still a major concern for market adoption and growth.
Gas Chromatography Market Segment Analysis
By Product
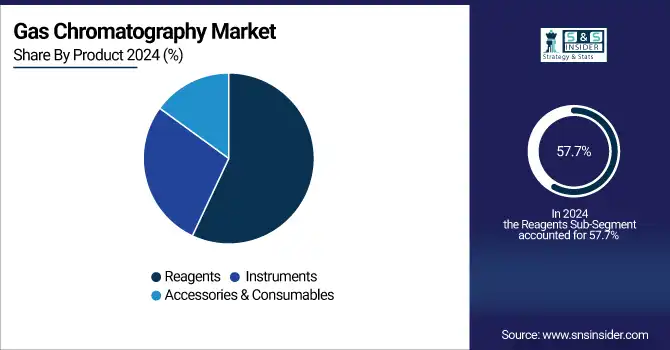
In 2025, the reagents segment accounted for the largest market revenue share of 57.7% of the overall gas chromatography market. The sector's dominance was fueled by the heavy usage of reagents in regular chromatography processes, the rising demand for high-purity solvents, and the enhanced use of sophisticated reagents in analysis-based applications in various industries. Furthermore, ongoing breakthroughs in reagent formulations have intensified detection sensitivity and precision, further increasing demand.
The accessories & consumables segment is anticipated to grow at the highest rate in the next few years. The increasing use of gas chromatography systems in various industries has created a growing demand for replacement parts, columns, vials, and other consumables. The frequent need for these parts, coupled with the advancements in chromatography consumables enhancing efficiency and lifespan, is driving the high growth rate of this segment.
By End-use
Within end-use segments, the pharmaceutical & biotechnology companies led the market in 2025 due to the widespread application of gas chromatography within drug discovery, quality assurance, and regulatory compliance tests. Growing pharmaceutical research demand for exacting analytical methods and increasing demand for chromatography application in biopharmaceutical manufacturing cemented this segment's dominance in the market.
The biotechnology & pharmaceutical segment is also expected to grow at the highest rate during the forecast period 2026-2033. The increasing emphasis on biopharmaceuticals, growth in R&D expenditure, and regulatory guidelines necessitating sophisticated analytical testing are some of the prime factors driving the growth of this segment. Additionally, the growth in personalized medicine and biologics is also anticipated to promote further use of gas chromatography in the pharmaceutical and biotechnology sectors.
Gas Chromatography Market Regional Analysis
North America Gas Chromatography Market Insights
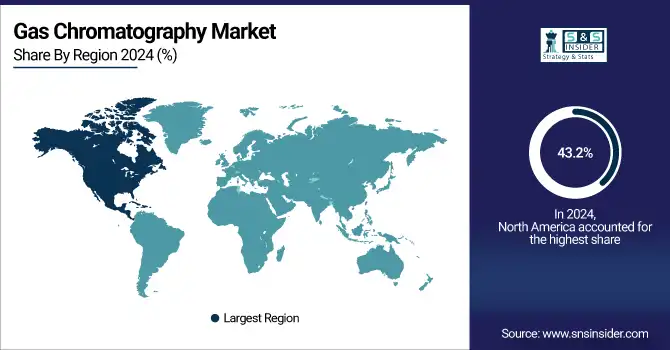
North America was the largest gas chromatography market in 2025 with a share of 43.2% due to robust demand from pharmaceutical, biotechnology, environmental testing, and food safety markets. The region has a well-established research infrastructure, high R&D expenditures, and rigorous regulatory norms that require accurate analytical methods. Having prominent industry players like Agilent Technologies, Thermo Fisher Scientific, and PerkinElmer also makes the region's market stronger. The U.S. alone possesses the largest percentage because of ongoing technological innovations, growing government investments in research, and the growing demand for quality control across industries.
Need any customization research on gas chromatography market - Enquiry Now
Asia Pacific Gas Chromatography Market Insights
Asia-Pacific is likely to experience the most rapid growth in the market for gas chromatography because of growing pharmaceutical and biotechnology sectors, growing environmental awareness, and the growing use of sophisticated analytical methods. China, India, and Japan are witnessing noteworthy investments in R&D, spurring the adoption of gas chromatography instruments and consumables. The fast industrialization and expanding food safety protocols in the country are also further fueling the growth of the market. Besides this, the rise in the base of global players and the growth of manufacturing and R&D plants in Asia-Pacific are driving the region's market share to increase, thus turning it into an important region to focus on future growth.
Europe Gas Chromatography Market Insights
Europe is expected to account for 27.8% of the global Gas Chromatography market in 2025, supported by strong demand in pharmaceuticals, food & beverage testing, and environmental monitoring. Countries like Germany, France, and the UK are leading adoption, driven by stringent regulatory frameworks such as REACH and EFSA guidelines. Increasing investments in research laboratories, academic-industry collaborations, and government-funded sustainability initiatives are also propelling demand. Moreover, Europe’s growing focus on renewable energy and biofuel quality analysis reinforces its competitive edge in the global Gas Chromatography market.
United States Gas Chromatography Market Insights
The United States dominates the global Gas Chromatography market with a 41.6% share in 2025, owing to widespread adoption in life sciences, oil & gas, and chemical industries. The U.S. benefits from a robust network of R&D institutions, advanced healthcare infrastructure, and strong regulatory oversight from bodies like the FDA and EPA. Additionally, innovation from leading companies such as Agilent Technologies, Thermo Fisher Scientific, and PerkinElmer continues to drive market growth. The increasing focus on environmental testing, forensic science, and drug discovery cements the U.S. as the global leader in Gas Chromatography adoption.
Latin America (LATAM) Gas Chromatography Market Insights
Latin America holds 11.4% of the Gas Chromatography market in 2025, driven by rising adoption in food safety, petrochemical analysis, and pharmaceuticals. Brazil and Mexico are at the forefront, with growing emphasis on ensuring compliance with international quality standards. The expansion of oil & gas exploration projects and stricter food testing regulations are also contributing to market growth. While the region is still in a developing phase compared to North America and Europe, government-backed research initiatives and private investments in laboratory infrastructure are strengthening LATAM’s role as an emerging market.
Middle East & Africa (MEA) Gas Chromatography Market Insights
The Middle East & Africa region is projected to hold 19.2% of the global Gas Chromatography market in 2025, fueled by strong investments in oil & gas analysis, environmental monitoring, and healthcare diagnostics. Countries such as Saudi Arabia, the UAE, and South Africa are adopting advanced GC technologies to support national energy diversification strategies and healthcare modernization. Government-backed smart city projects and collaborations with global analytical equipment providers are accelerating adoption. MEA’s increasing focus on sustainable energy development and enhanced quality testing standards positions the region as a high-growth market.
Competitive Landscape for Gas Chromatography Market
Shimadzu Corporation
Shimadzu Corporation is a Japan-based leader in analytical instrumentation, offering advanced gas chromatography solutions for energy, healthcare, and environmental sectors.
-
In January 2025, Shimadzu launched seven new gas chromatography systems, including the compact Brevis GC-2050, designed to support green energy initiatives and carbon neutrality goals. The launch strengthens Shimadzu’s position as an innovator in sustainable, energy-efficient analytical solutions.
Agilent Technologies
Agilent Technologies, headquartered in the U.S., is a global pioneer in life sciences and chemical analysis, with a strong portfolio of gas chromatography systems.
-
In May 2024, Agilent introduced the 8850 Gas Chromatograph, a compact yet powerful solution that enhances analytical efficiency and performance. This system delivers the full capability of Agilent’s GC technology while optimizing space utilization for modern laboratories.
Gas Chromatography Market Key Players
-
Agilent Technologies, Inc. – 7890B GC System, Intuvo 9000 GC System
-
Thermo Fisher Scientific, Inc– TRACE 1600 Series GC, AI/AS 1610 Autosampler
-
Shimadzu Corporation– Nexis GC-2030, GC-2014
-
PerkinElmer, Inc. – Clarus 590, Clarus 690
-
Restek Corporation– Rtx Columns, Super Clean Gas Filters
-
Dani Instruments S.P.A. – Master GC, Master TOF-MS
-
Chromatotec – AirmoVOC, ChromaFID
-
Merck KGAA – Supelco GC Columns, GC Accessories
-
Leco Corporation – Pegasus BT GC-TOFMS, GCxGC Systems
-
Scion Instruments – SCION 456-GC, SCION 8700 SQ GC-MS
-
Phenomenex – Zebron GC Columns, Strata-X SPE Cartridges
-
GL Sciences – GC-4000, InertCap GC Columns
-
OI Analytical – 5383 Pulsed Flame Photometric Detector, 5360X Halogen Specific Detector
-
Valco Company Instruments Inc. – Valco Valves, GC Sample Loops
-
Centurion Scientific – GC Accessories, Gas Purifiers
-
SRI Instruments – Model 8610C GC, Model 310 GC
-
Skyray Instruments – GC-6800, GC-4500
-
E ChromTech Co. Ltd. – CT-GC8000, CT-GC9000
-
Trajan Scientific – SGE Syringes, BPX GC Columns
-
Falcon Analytical – CALIDUS Ultrafast GC, UltraFast Mass Spec
| Report Attributes | Details |
|---|---|
| Market Size in 2025E | USD 3.65 billion |
| Market Size by 2033 | USD 5.47 billion |
| CAGR | CAGR of 5.15% From 2026 to 2033 |
| Base Year | 2025 |
| Forecast Period | 2026-2033 |
| Historical Data | 2022-2024 |
| Report Scope & Coverage | Market Size, Segments Analysis, Competitive Landscape, Regional Analysis, DROC & SWOT Analysis, Forecast Outlook |
| Key Segments | • By Product [Accessories & Consumables (Fittings and tubing, Auto-sampler accessories, Flow management and pressure regulator accessories, Others), Instruments (Systems, Auto-samplers, Fraction collectors, Detectors), Reagents (Analytical gas chromatography reagents, Bioprocess gas chromatography reagents)] • By End-use [Pharmaceutical & Biotechnology Company, Academic & Research Institutes, Food and Beverage, Others] |
| Regional Analysis/Coverage | North America (US, Canada), Europe (Germany, France, UK, Italy, Spain, Poland, Russsia, Rest of Europe), Asia Pacific (China, India, Japan, South Korea, Australia,ASEAN Countries, Rest of Asia Pacific), Middle East & Africa (UAE, Saudi Arabia, Qatar, Egypt, South Africa, Rest of Middle East & Africa), Latin America (Brazil, Argentina, Mexico, Colombia Rest of Latin America) |
| Company Profiles | GE Healthcare, Shimadzu Corporation, Thermo Fisher Scientific, Inc., Agilent Technologies, Inc., Bio-Rad Laboratories, Inc., Dani Instruments S.P.A., W. R. Grace & Co.-Conn, Restek Corporation, Buchi, PerkinElmer, Inc., Chromatotec, Merck KGAA, Leco Corporation, Scion Instruments, Phenomenex, GL Sciences, OI Analytical, Valco Company Instruments Inc., Centurion Scientific, SRI Instruments, Skyray Instruments, E ChromTech Co. Ltd., Trajan Scientific, Falcon Analytical. |
Frequently Asked Questions
Ans: North America dominated the Gas Chromatography Market in 2024.
Ans: The Reagents segment dominated the Gas Chromatography Market.
Ans: The The rising demand for Gas Chromatography (GC) is primarily driven by its versatility across various industries, is a significant driver for the Gas Chromatography market.
Ans: Gas Chromatography Market Size was valued at USD 3.65 billion in 2024 and is expected to reach USD 5.47 billion by 2032.
Ans: Gas Chromatography Market Size was valued at USD 3.65 billion in 2024 and is expected to reach USD 5.47 billion by 2032.
Ans :Gas Chromatography Market Size grow at a CAGR of 5.15% over the forecast period 2025-2032.
Get in touch
