image

Gaming Hardware Market Size & Overview

Gaming Hardware Market Revenue Analysis

Get More Information on Gaming Hardware Market - Request Sample Report

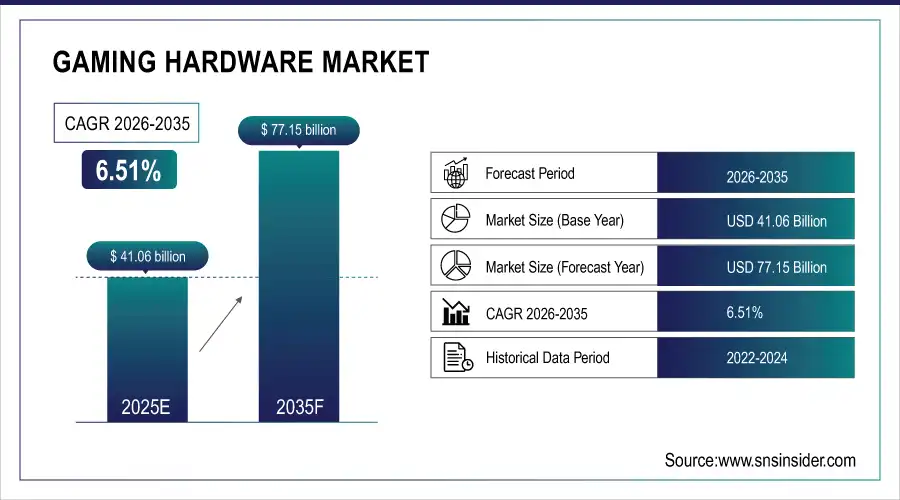
The Gaming Hardware Market Size was valued at USD 36.2 Billion in 2023 and is expected to grow to USD 63.86 Billion by 2032 and grow at a CAGR of 6.51% over the forecast period of 2024-2032.

The gaming hardware market has seen rapid growth due to increasing internet penetration and the rise of esports across key regions. Advanced multiplayer games, backed by significant public coverage and high sponsorship, are pushing gamers to invest in high-end consoles and peripherals as professional esports teams recruit players. Games with superfast frame rates and the integration of the Internet of Things (IoT) in gaming are also driving demand for premium hardware, creating new excitement among gamers. Furthermore, the desire for realistic gaming experiences, alongside advanced consoles like the PlayStation 4 Pro and Xbox One X with enhanced features, is opening up new opportunities in the global gaming market. Key components of this market include gaming consoles, high-performance PCs, laptops, graphics cards, and peripherals such as gaming keyboards, mice, and headsets. The rise in content creation and streaming has further fueled the demand for high-performance hardware. However, supply chain challenges and semiconductor shortages have created constraints, impacting both production and pricing dynamics.

The global PC-based gaming hardware market is experiencing a shift in spending patterns, with a notable decrease in consumer purchases of high-end gaming components. This trend is driven by several factors, including changing consumer priorities and increased spending on business and prosumer workstations used for demanding applications such as 3D design, rather than for gaming. While overall PC CPU shipments have seen an uptick, the market for desktop graphics cards and add-in boards has declined, largely due to their high average selling prices (ASP). As graphics cards heavily influence the ASP of gaming PCs, this shift has led to a downturn in the gaming hardware segment, especially in the first half of the year. However, market analysts remain optimistic about a rebound in the latter half of the year, as this period typically aligns with higher consumer spending on gaming hardware due to seasonal demand.

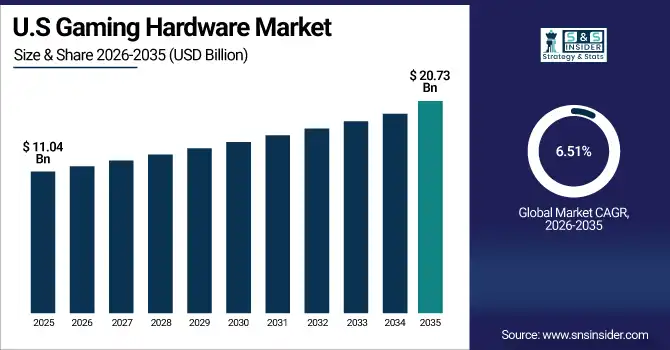
The purchasing intent of consumers plays a key role in shaping market dynamics, particularly the "Gaming Influence Factor," which tracks hardware bought specifically for gaming purposes. In 2024, this intent has seen a temporary decline as consumers opt for systems capable of both gaming and professional applications. According to data from the U.S. Department of Commerce, consumer spending on gaming hardware was projected to grow at a rate of 5.2% annually over the next few years. Furthermore, the Entertainment Software Association (ESA) reported that over 75% of American households now have at least one gamer, indicating a substantial market for gaming products. Nevertheless, the gaming hardware market is expected to recover by 2025, as discretionary spending increases and more systems are purchased with gaming as the primary focus. Over the next few years, the market is projected to grow steadily, driven by continued advancements in gaming technology, such as improved CPUs, GPUs, and displays, as well as increasing demand for immersive experiences. As new gaming titles emerge and the popularity of esports and streaming platforms continues to rise, the demand for high-performance gaming hardware is likely to regain momentum, bolstering market growth.

The gaming hardware market in the United States and Europe has undergone a considerable change, now being 30% to 50% bigger than before the pandemic. Sales of gaming PCs and accessories reached record levels during the pandemic due to increased remote work and demand for entertainment. Nevertheless, with the adaptation to the new post-pandemic environment, numerous businesses have communicated struggles with their finances. In spite of these changes, one major company has stood out as a successful example, demonstrating a significant rise in the need for its various gaming items like RGB fans, AIO coolers, keyboards, gaming chairs, and complete PC systems. The company's earnings are split between two main sectors: Gaming Components and Systems, and Gamer and Creator Peripherals. The second part has demonstrated a stronger profit margin and is projected to keep expanding as customers look for more immersive experiences and advanced features. In the future, the company aims to launch new products in 2024, including sim racing and mobile controllers. Nonetheless, there is no anticipation of significant enhancements in the gaming hardware sector until approximately 2025, when a sharp increase in the need for new GPUs is projected. This strategic position shows how the gaming hardware market continues to evolve and stay strong in response to changing consumer preferences and technological advancements, showcasing the industry's innovation and ability to adapt to new trends.

Gaming Hardware Market Dynamics

Drivers

  • Expanding Horizons Through Live Streaming of Multiplayer Gaming Events

Gaming has evolved from a niche pastime to a global entertainment phenomenon. With approximately 3.1 billion gamers worldwide in 2020 and an anticipated increase of 500 million by 2024, nearly half of the global population of 7.7 billion is engaging with video games. In 2021, the industry generated revenues of $175 billion, surpassing the combined earnings of movies, music, and books. Advancements in artificial intelligence and machine learning are driving the gaming sector to new heights, enhancing everything from network efficiency to player matchmaking. These technologies play a crucial role in nurturing new gamers, discouraging toxic behavior, optimizing monetization strategies, and creating expansive environments for players. A significant trend is the rise of live streaming for multiplayer gaming events, which has cultivated a devoted fan base and created a new generation of content consumers. This shift to live and recorded video game streaming necessitates advanced gaming hardware, such as high-quality speakers, responsive joysticks, motion controllers, and robust consoles. The increasing demand for such equipment is vital in supporting these large-scale streaming events, further propelling the growth of the gaming hardware market.

  • The Rise of Cloud-Based Gaming Driving Hardware Advancements.

The market for cloud-streamed gaming is experiencing strong growth, fueled by improved availability and adaptability to meet the needs of a variety of gaming audiences. This phenomenon is particularly noteworthy in developing countries in Latin America, the Middle East and Africa (MEA), and certain parts of Europe, where mobile devices are increasingly becoming the main choice for gaming activities. As stated by IDC's Worldwide Quarterly Gaming Tracker®, cloud-streamed gaming revenue remains strong even with the closure of platforms like Stadia, showing high demand for convenient gaming options. The rise in demand is pushing gamers to look for powerful hardware that can handle advanced streaming features. As gamers shift to cloud services, the need for strong PCs, high-quality monitors, and effective networking gear increases, as these are crucial for providing seamless, lag-free gaming experiences. Additionally, the rise of distinct and varied gaming titles offered on cloud platforms motivates users to enhance their devices for the best possible performance. The link between the rise of cloud-based gaming and the demand for high-end gaming equipment showcases how the gaming industry constantly evolves through technological advancements that improve the gaming experience.

Restraints

  • The expensive gaming hardware is hindering the growth of the market.

Although gaming provides many opportunities in different sectors, the expensive equipment and hardware continue to prevent many consumers from fully participating. The shortage of semiconductor chips essential for operating gaming laptops and consoles has worsened in various regions, adding to the challenge. Moreover, certain nations are still struggling with the economic aftermath of the pandemic, which is limiting their capacity to invest in gaming technology. In November 2021, Nintendo Co. Ltd., a major player in the gaming sector, revealed that the worldwide chip shortage compelled the company to reduce its sales projections for the Switch console, potentially hindering gaming hardware advancement. As a reaction, Nintendo is actively trying to replace components to lessen the impact of the chip shortage, modifying current designs to sustain production rates. This scenario emphasizes the double difficulty of expensive expenses and supply chain interruptions, which hinder customer access to cutting-edge gaming technologies and also affect manufacturers' capacity to create new products and meet market needs efficiently.

Segment Analysis of Gaming Hardware Market

by Type

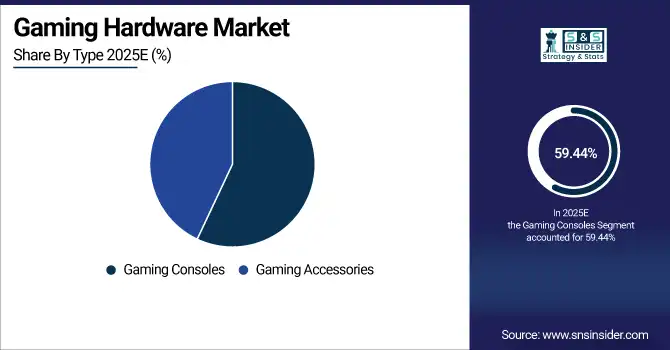
In the gaming hardware market, gaming consoles have become the top segment, obtaining a significant 59.44% of the revenue in 2023. Continuous advancements in console technology, coupled with a strong lineup of exclusive games, are the reasons behind this dominant position. Key industry contenders, like Sony and Microsoft, have played a major role in fueling this expansion by releasing their most recent console editions. The PlayStation 5 by Sony, which came out in late 2020, has revolutionized the gaming industry with its cutting-edge hardware, such as a customized SSD for quicker load speeds and improved graphics performance. Microsoft has made significant progress with the Xbox Series X by incorporating robust hardware and services such as Xbox Game Pass, offering subscribers a wide selection of games. Moreover, there is a growing emphasis on cross-platform compatibility among businesses, enabling users to have a cohesive experience on all devices. The increase in popularity of cloud gaming services, which allow gamers to stream games directly to their consoles, enhances the attractiveness of gaming consoles even more. Therefore, the gaming console industry is ready for sustained expansion, fueled by constant improvements in products and a growing gaming ecosystem that enhances the player's experience.
by End User

In 2023, residential gaming hardware remains the leading segment in the gaming hardware market, with a significant 59.56% share. This upsurge is a result of more gamers looking for immersive and high-quality gaming experiences while staying at home. Large corporations have met this need by introducing new and creative products tailored for home gamers. Nvidia's launch of the GeForce RTX 4000 series GPUs has transformed gaming performance through cutting-edge ray tracing tech and AI-driven features, making them top picks for premium gaming setups. Furthermore, Corsair and Razer have also released various accessories such as mechanical keyboards and gaming mice tailored to improve the gaming experience at home. The growth of online gaming platforms and membership services like Xbox Game Pass and PlayStation Plus has prompted more gamers to enhance their home setups. Additionally, the increase in popularity of social gaming and streaming platforms has encouraged home gamers to enhance their hardware for improved performance and visuals. Due to ongoing product innovations and changes in home entertainment, the residential gaming hardware segment is set to continue growing.

Gaming-Hardware-Market-By-End-User.

Regional Outlook of Gaming Hardware Industry

by 2023, North America has established itself as the gaming hardware market's top revenue-generating region, comprising 34.44% of the overall share. The strong influence comes from a thriving gaming community, advances in technology, and major investments from top gaming firms. Key companies like Nvidia and AMD have introduced advanced graphics cards, like the GeForce RTX 40 series and Radeon RX 7000 series, improving gaming with ray tracing and AI features. Furthermore, Sony and Microsoft have continued to push the boundaries with the PlayStation 5 and Xbox Series X consoles, providing top-notch performance and exclusive games that have further increased hardware sales. The growth of esports in the area has led to a higher need for top-quality gaming systems, causing local businesses to invest in dedicated gaming gear. Nations such as the United States and Canada lead this expansion, due to robust internet infrastructure and a sizable community of passionate gamers. As innovation flourishes in North America and consumer engagement improves, the gaming hardware market is forecasted to grow, solidifying its leading role worldwide.

In 2023, the Asia-Pacific region has emerged as the fastest-growing market for gaming hardware, driven by a surge in gaming popularity, rapid technological advancements, and an expanding middle class with disposable income. Countries such as China, Japan, and South Korea are leading this growth, fueled by a vibrant gaming culture and a large population of gamers. The increasing adoption of smartphones and high-speed internet has facilitated the rise of mobile gaming, prompting companies to launch innovative gaming hardware tailored to mobile users. Notable product releases include Tencent's new cloud gaming platform and Sony's expansion of PlayStation services in Asia, catering to the growing demand for high-quality gaming experiences. Additionally, Nvidia and AMD have introduced state-of-the-art graphics cards and gaming accessories, making high-performance gaming more accessible to a broader audience. The rise of esports in the region is further propelling the demand for specialized gaming hardware, with countries investing in gaming infrastructure and hosting international tournaments. As the Asia-Pacific region continues to innovate and attract investment, it is poised to capture an increasingly larger share of the global gaming hardware market in the coming years.

Gaming Hardware Market, Regional Analysis, 2023

Need any customization research on Gaming Hardware Market - Enquiry Now

Key Players

Here’s a list of key players in the gaming hardware market, along with notable products from some of them:

  • Microsoft Corporation (Xbox Series X/S)

  • Nintendo Co., Ltd. (Nintendo Switch)

  • NVIDIA Corporation (GeForce RTX Series)

  • Sony Corporation (PlayStation 5)

  • Logitech International S.A. (Logitech G Pro Gaming Headset)

  • Venom UK Ltd. (Venom Rechargeable Battery Pack)

  • Oculus VR (Oculus Quest 2)

  • Linden Research (Second Life - Virtual Reality)

  • Sega Games (Sega Genesis Mini)

  • Corsair Gaming, Inc. (Corsair K100 RGB Mechanical Gaming Keyboard)

  • Razer Inc. (Razer Blade Gaming Laptops)

  • Alienware (Dell Technologies) (Alienware Aurora Gaming Desktops)

  • ASUS (ROG Zephyrus Gaming Laptops)

  • Acer (Predator Gaming Monitors)

  • HP Inc. (Omen Gaming PCs)

  • SteelSeries (SteelSeries Arctis 7 Gaming Headset)

  • Others

Recent Development

  • For 2024, the gaming landscape is set for exciting developments as the PlayStation 5 and Xbox Series X remain the preferred consoles for living rooms. Anticipation is building for new, updated models from Sony and Microsoft, as well as potentially new entrants in the market. These next-generation consoles are expected to feature significantly enhanced CPUs and GPUs, enabling capabilities like faster frame rates and 4K gaming, with the possibility of 8K becoming the new standard

  • March 2023: Microsoft collaborated with cloud gaming service provider Boosteroid to increase the number of games available to consumers worldwide.

  • February 20, 2023: Microsoft and NVIDIA announced a 10-year deal to provide Xbox PC titles to the over 25 million NVIDIA users. The GeForce NOWTM cloud gaming service is accessible in over 100 countries. The collaboration will bring popular Xbox titles from Activision, such as Call of Duty and Minecraft, to the NVIDIA GeForce NOW cloud gaming service.

Gaming Hardware Market Report Scope:

Report Attributes Details
Market Size in 2023 USD 36.2 Billion
Market Size by 2032 USD 63.86 Billion
CAGR CAGR of 6.51% From 2024 to 2032
Base Year 2023
Forecast Period 2024-2032
Historical Data 2020-2022
Report Scope & Coverage Market Size, Segments Analysis, Competitive  Landscape, Regional Analysis, DROC & SWOT Analysis, Forecast Outlook
Key Segments • By Type (Gaming Consoles, Gaming Accessories)
• By End User (Commercial Gaming Hardware, Residential Gaming Hardware)
Regional Analysis/Coverage North America (US, Canada, Mexico), Europe (Eastern Europe [Poland, Romania, Hungary, Turkey, Rest of Eastern Europe] Western Europe] Germany, France, UK, Italy, Spain, Netherlands, Switzerland, Austria, Rest of Western Europe]), Asia-Pacific (China, India, Japan, South Korea, Vietnam, Singapore, Australia, Rest of Asia-Pacific), Middle East & Africa (Middle East [UAE, Egypt, Saudi Arabia, Qatar, Rest of Middle East], Africa [Nigeria, South Africa, Rest of Africa], Latin America (Brazil, Argentina, Colombia, Rest of Latin America)
Company Profiles Microsoft Corporation, Nintendo Co., Ltd., NVIDIA Corporation, Sony Corporation, Logitech International S.A., Venom UK Ltd., Oculus VR, Linden Research, Sega Games, Corsair Gaming, Inc., Razer Inc., Alienware (Dell Technologies), ASUS, Acer, and SteelSeries & Others 
Key Drivers • Expanding Horizons Through Live Streaming of Multiplayer Gaming Events
• The Rise of Cloud-Based Gaming Driving Hardware Advancements.
Restraints • The expensive gaming hardware is hindering the growth of the market.

Frequently Asked Questions

Ans: Gaming Hardware Market size was valued at USD 36.2 Billion in 2023 and is expected to grow to USD 63.86 Billion by 2032 and grow at a CAGR of 6.51% over the forecast period of 2024-2032.


Ans: The Gaming Hardware Market grow at a CAGR of 6.51% over the forecast period of 2024-2032.

Ans: North America  dominated the Gaming Hardware Market in 2023.

Ans:  A major growth factor for the Gaming Hardware Market is the increasing demand for high-performance gaming equipment driven by the popularity of competitive gaming and eSports, as well as advancements in graphics technology?

Ans: The Gaming Consoles segment dominated the Gaming Hardware Market.

Table of Content

1. Introduction

1.1 Market Definition

1.2 Scope (Inclusion and Exclusions)

1.3 Research Assumptions

2. Executive Summary

2.1 Market Overview

2.2 Regional Synopsis

2.3 Competitive Summary

3. Research Methodology

3.1 Top-Down Approach

3.2 Bottom-up Approach

3.3. Data Validation

3.4 Primary Interviews

4. Market Dynamics Impact Analysis

4.1 Market Driving Factors Analysis

4.1.2 Drivers

4.1.2 Restraints

4.1.3 Opportunities

4.1.4 Challenges

4.2 PESTLE Analysis

4.3 Porter’s Five Forces Model

5. Statistical Insights and Trends Reporting

5.1 Key Vendors and Feature Analysis, 2023

5.2 Performance Benchmarks, 2023

5.3 Integration Capabilities, by Software

5.4 Usage Statistics, 2023

6. Competitive Landscape

6.1 List of Major Companies, by Region

6.2 Market Share Analysis, by Region

6.3 Product Benchmarking

6.3.1 Product specifications and features

6.3.2 Pricing

6.4 Strategic Initiatives

6.4.1 Marketing and promotional activities

6.4.2 Distribution and supply chain strategies

6.4.3 Expansion plans and new product launches

6.4.4 Strategic partnerships and collaborations

6.5 Technological Advancements

6.6 Market Positioning and Branding

7. Gaming Hardware Market Segmentation, by Type

7.1 Chapter Overview

7.2 Gaming Consoles

7.2.1 Gaming Consoles Market Trends Analysis (2020-2032)

7.2.2 Gaming Consoles Market Size Estimates and Forecasts to 2032 (USD Billion)

7.2.3 Standard Gaming Consoles

7.2.3.1 Standard Gaming Consoles Market Trends Analysis (2020-2032)

7.2.3.2 Standard Gaming Consoles Market Size Estimates and Forecasts to 2032 (USD Billion)

             7.2.4 Handheld Gaming Consoles

7.2.4.1 Handheld Gaming Consoles Market Trends Analysis (2020-2032)

7.2.4.2 Handheld Gaming Consoles Market Size Estimates and Forecasts to 2032 (USD Million)

7.3 Gaming Accessories

7.3.1 Gaming Accessories Market Trends Analysis (2020-2032)

7.3.2 Gaming Accessories Market Size Estimates and Forecasts to 2032 (USD Million)

    7.3.3.1 Gaming Controller

   7.3.3.1 Gaming Controller Market Trends Analysis (2020-2032)

7.2.3.2 Gaming Controller Market Size Estimates and Forecasts to 2032 (USD Million)

    7.3.4 Gaming Headsets

   7.3.4.1 Gaming Headsets Market Trends Analysis (2020-2032)

7.2.4.2 Gaming Headsets Market Size Estimates and Forecasts to 2032 (USD Million)

    7.3.5 Gaming Cameras

   7.3.5.1 Gaming Cameras Market Trends Analysis (2020-2032)

7.2.5.2 Gaming Cameras Market Size Estimates and Forecasts to 2032 (USD Million)

8. Gaming Hardware Market Segmentation, by End User

8.1 Chapter Overview

8.2 Commercial Gaming Hardware

8.2.1 Commercial Gaming Hardware Market Trends Analysis (2020-2032)

8.2.2 Commercial Gaming Hardware Market Size Estimates and Forecasts to 2032 (USD Million)

8.3 Residential Gaming Hardware

8.3.1 Residential Gaming Hardware Market Trends Analysis (2020-2032)

8.3.2 Residential Gaming Hardware Market Size Estimates and Forecasts to 2032 (USD Million)

9. Regional Analysis

9.1 Chapter Overview

9.2 North America

9.2.1 Trends Analysis

9.2.2 North America Gaming Hardware Market Estimates and Forecasts, by Country (2020-2032) (USD Million)

9.2.3 North America Gaming Hardware Market Estimates and Forecasts, by Type (2020-2032) (USD Million)  

9.2.4 North America Gaming Hardware Market Estimates and Forecasts, by End User (2020-2032) (USD Million)

9.2.5 USA

9.2.5.1 USA Gaming Hardware Market Estimates and Forecasts, by Type (2020-2032) (USD Million)

9.2.5.2 USA Gaming Hardware Market Estimates and Forecasts, by End User (2020-2032) (USD Million)

9.2.6 Canada

9.2.6.1 Canada Gaming Hardware Market Estimates and Forecasts, by Type (2020-2032) (USD Million)

9.2.6.2 Canada Gaming Hardware Market Estimates and Forecasts, by End User (2020-2032) (USD Million)

9.2.7 Mexico

9.2.7.1 Mexico Gaming Hardware Market Estimates and Forecasts, by Type (2020-2032) (USD Million)

9.2.7.2 Mexico Gaming Hardware Market Estimates and Forecasts, by End User (2020-2032) (USD Million)

9.3 Europe

9.3.1 Eastern Europe

9.3.1.1 Trends Analysis

9.3.1.2 Eastern Europe Smart Irrigation Controllers Market Estimates and Forecasts, by Country (2020-2032) (USD Million)

9.3.1.3 Eastern Europe Smart Irrigation Controllers Market Estimates and Forecasts, by Type (2020-2032) (USD Million)  

9.3.1.4 Eastern Europe Smart Irrigation Controllers Market Estimates and Forecasts, by End User (2020-2032) (USD Million)

9.3.1.5 Poland

9.3.1.5.1 Poland Gaming Hardware Market Estimates and Forecasts, by Type (2020-2032) (USD Million)

9.3.1.5.2 Poland Gaming Hardware Market Estimates and Forecasts, by End User (2020-2032) (USD Million)

9.3.1.6 Romania

9.3.1.6.1 Romania Smart Irrigation Controllers Market Estimates and Forecasts, by Type (2020-2032) (USD Million)

9.3.1.6.2 Romania Smart Irrigation Controllers Market Estimates and Forecasts, by End User (2020-2032) (USD Million)

9.3.1.7 Hungary

9.3.1.7.1 Hungary Gaming Hardware Market Estimates and Forecasts, by Type (2020-2032) (USD Million)

9.3.1.7.2 Hungary Smart Irrigation Controllers Market Estimates and Forecasts, by End User (2020-2032) (USD Million)

9.3.1.8 Turkey

9.3.1.8.1 Turkey Gaming Hardware Market Estimates and Forecasts, by Type (2020-2032) (USD Million)

9.3.1.8.2 Turkey Smart Irrigation Controllers Market Estimates and Forecasts, by End User (2020-2032) (USD Million)

9.3.1.9 Rest of Eastern Europe

9.3.1.9.1 Rest of Eastern Europe Gaming Hardware Market Estimates and Forecasts, by Type (2020-2032) (USD Million)

9.3.1.9.2 Rest of Eastern Europe Smart Irrigation Controllers Market Estimates and Forecasts, by End User (2020-2032) (USD Million)

9.3.2 Western Europe

9.3.2.1 Trends Analysis

9.3.2.2 Western Europe Smart Irrigation Controllers Market Estimates and Forecasts, by Country (2020-2032) (USD Million)

9.3.2.3 Western Europe Smart Irrigation Controllers Market Estimates and Forecasts, by Type (2020-2032) (USD Million)  

9.3.2.4 Western Europe Smart Irrigation Controllers Market Estimates and Forecasts, by End User (2020-2032) (USD Million)

9.3.2.5 Germany

9.3.2.5.1 Germany Gaming Hardware Market Estimates and Forecasts, by Type (2020-2032) (USD Million)

9.3.2.5.2 Germany Gaming Hardware Market Estimates and Forecasts, by End User (2020-2032) (USD Million)

9.3.2.6 France

9.3.2.6.1 France Gaming Hardware Market Estimates and Forecasts, by Type (2020-2032) (USD Million)

9.3.2.6.2 France Gaming Hardware Market Estimates and Forecasts, by End User (2020-2032) (USD Million)

9.3.2.7 UK

9.3.2.7.1 UK Gaming Hardware Market Estimates and Forecasts, by Type (2020-2032) (USD Million)

9.3.2.7.2 UK Gaming Hardware Market Estimates and Forecasts, by End User (2020-2032) (USD Million)

9.3.2.8 Italy

9.3.2.8.1 Italy Gaming Hardware Market Estimates and Forecasts, by Type (2020-2032) (USD Million)

9.3.2.8.2 Italy Smart Irrigation Controllers Market Estimates and Forecasts, by End User (2020-2032) (USD Million)

9.3.2.9 Spain

9.3.2.9.1 Spain Gaming Hardware Market Estimates and Forecasts, by Type (2020-2032) (USD Million)

9.3.2.9.2 Spain Smart Irrigation Controllers Market Estimates and Forecasts, by End User (2020-2032) (USD Million)

9.3.2.10 Netherlands

9.3.2.10.1 Netherlands Gaming Hardware Market Estimates and Forecasts, by Type (2020-2032) (USD Million)

9.3.2.10.2 Netherlands Smart Irrigation Controllers Market Estimates and Forecasts, by End User (2020-2032) (USD Million)

9.3.2.11 Switzerland

9.3.2.11.1 Switzerland Gaming Hardware Market Estimates and Forecasts, by Type (2020-2032) (USD Million)

9.3.2.11.2 Switzerland Smart Irrigation Controllers Market Estimates and Forecasts, by End User (2020-2032) (USD Million)

9.3.2.12 Austria

9.3.2.12.1 Austria Gaming Hardware Market Estimates and Forecasts, by Type (2020-2032) (USD Million)

9.3.2.12.2 Austria Smart Irrigation Controllers Market Estimates and Forecasts, by End User (2020-2032) (USD Million)

9.3.2.13 Rest of Western Europe

9.3.2.13.1 Rest of Western Europe Gaming Hardware Market Estimates and Forecasts, by Type (2020-2032) (USD Million)

9.3.2.13.2 Rest of Western Europe Smart Irrigation Controllers Market Estimates and Forecasts, by End User (2020-2032) (USD Million)

9.4 Asia-Pacific

9.4.1 Trends Analysis

9.4.2 Asia-Pacific Gaming Hardware Market Estimates and Forecasts, by Country (2020-2032) (USD Million)

9.4.3 Asia-Pacific Gaming Hardware Market Estimates and Forecasts, by Type (2020-2032) (USD Million)  

9.4.4 Asia-Pacific Gaming Hardware Market Estimates and Forecasts, by End User (2020-2032) (USD Million)

9.4.5 China

9.4.5.1 China Gaming Hardware Market Estimates and Forecasts, by Type (2020-2032) (USD Million)

9.4.5.2 China Gaming Hardware Market Estimates and Forecasts, by End User (2020-2032) (USD Million)

9.4.6 India

9.4.5.1 India Gaming Hardware Market Estimates and Forecasts, by Type (2020-2032) (USD Million)

9.4.5.2 India Gaming Hardware Market Estimates and Forecasts, by End User (2020-2032) (USD Million)

9.4.5 Japan

9.4.5.1 Japan Gaming Hardware Market Estimates and Forecasts, by Type (2020-2032) (USD Million)

9.4.5.2 Japan Gaming Hardware Market Estimates and Forecasts, by End User (2020-2032) (USD Million)

9.4.6 South Korea

9.4.6.1 South Korea Gaming Hardware Market Estimates and Forecasts, by Type (2020-2032) (USD Million)

9.4.6.2 South Korea Gaming Hardware Market Estimates and Forecasts, by End User (2020-2032) (USD Million)

9.4.7 Vietnam

9.4.7.1 Vietnam Gaming Hardware Market Estimates and Forecasts, by Type (2020-2032) (USD Million)

9.2.7.2 Vietnam Gaming Hardware Market Estimates and Forecasts, by End User (2020-2032) (USD Million)

9.4.8 Singapore

9.4.8.1 Singapore Gaming Hardware Market Estimates and Forecasts, by Type (2020-2032) (USD Million)

9.4.8.2 Singapore Gaming Hardware Market Estimates and Forecasts, by End User (2020-2032) (USD Million)

9.4.9 Australia

9.4.9.1 Australia Gaming Hardware Market Estimates and Forecasts, by Type (2020-2032) (USD Million)

9.4.9.2 Australia Gaming Hardware Market Estimates and Forecasts, by End User (2020-2032) (USD Million)

9.4.10 Rest of Asia-Pacific

9.4.10.1 Rest of Asia-Pacific Gaming Hardware Market Estimates and Forecasts, by Type (2020-2032) (USD Million)

9.4.10.2 Rest of Asia-Pacific Gaming Hardware Market Estimates and Forecasts, by End User (2020-2032) (USD Million)

9.5 Middle East and Africa

9.5.1 Middle East

9.5.1.1 Trends Analysis

9.5.1.2 Middle East Smart Irrigation Controllers Market Estimates and Forecasts, by Country (2020-2032) (USD Million)

9.5.1.3 Middle East Smart Irrigation Controllers Market Estimates and Forecasts, by Type (2020-2032) (USD Million)  

9.5.1.4 Middle East Smart Irrigation Controllers Market Estimates and Forecasts, by End User (2020-2032) (USD Million)

9.5.1.5 UAE

9.5.1.5.1 UAE Gaming Hardware Market Estimates and Forecasts, by Type (2020-2032) (USD Million)

9.5.1.5.2 UAE Smart Irrigation Controllers Market Estimates and Forecasts, by End User (2020-2032) (USD Million)

9.5.1.6 Egypt

9.5.1.6.1 Egypt Gaming Hardware Market Estimates and Forecasts, by Type (2020-2032) (USD Million)

9.5.1.6.2 Egypt Smart Irrigation Controllers Market Estimates and Forecasts, by End User (2020-2032) (USD Million)

9.5.1.7 Saudi Arabia

9.5.1.7.1 Saudi Arabia Gaming Hardware Market Estimates and Forecasts, by Type (2020-2032) (USD Million)

9.5.1.7.2 Saudi Arabia Smart Irrigation Controllers Market Estimates and Forecasts, by End User (2020-2032) (USD Million)

9.5.1.8 Qatar

9.5.1.8.1 Qatar Gaming Hardware Market Estimates and Forecasts, by Type (2020-2032) (USD Million)

9.5.1.8.2 Qatar Smart Irrigation Controllers Market Estimates and Forecasts, by End User (2020-2032) (USD Million)

9.5.1.9 Rest of Middle East

9.5.1.9.1 Rest of Middle East Gaming Hardware Market Estimates and Forecasts, by Type (2020-2032) (USD Million)

9.5.1.9.2 Rest of Middle East Smart Irrigation Controllers Market Estimates and Forecasts, by End User (2020-2032) (USD Million)

9.5.2 Africa

9.5.2.1 Trends Analysis

9.5.2.2 Africa Smart Irrigation Controllers Market Estimates and Forecasts, by Country (2020-2032) (USD Million)

9.5.2.3 Africa Smart Irrigation Controllers Market Estimates and Forecasts, by Type (2020-2032) (USD Million)  

9.5.2.4 Africa Smart Irrigation Controllers Market Estimates and Forecasts, by End User (2020-2032) (USD Million)

9.5.2.5 South Africa

9.5.2.5.1 South Africa Gaming Hardware Market Estimates and Forecasts, by Type (2020-2032) (USD Million)

9.5.2.5.2 South Africa Smart Irrigation Controllers Market Estimates and Forecasts, by End User (2020-2032) (USD Million)

9.5.2.6 Nigeria

9.5.2.6.1 Nigeria Gaming Hardware Market Estimates and Forecasts, by Type (2020-2032) (USD Million)

9.5.2.6.2 Nigeria Smart Irrigation Controllers Market Estimates and Forecasts, by End User (2020-2032) (USD Million)

9.5.2.7 Rest of Africa

9.5.2.7.1 Rest of Africa Gaming Hardware Market Estimates and Forecasts, by Type (2020-2032) (USD Million)

9.5.2.7.2 Rest of Africa Gaming Hardware Market Estimates and Forecasts, by End User (2020-2032) (USD Million)

9.6 Latin America

9.6.1 Trends Analysis

9.6.2 Latin America Gaming Hardware Market Estimates and Forecasts, by Country (2020-2032) (USD Million)

9.6.3 Latin America Gaming Hardware Market Estimates and Forecasts, by Type (2020-2032) (USD Million)  

9.6.4 Latin America Gaming Hardware Market Estimates and Forecasts, by End User (2020-2032) (USD Million)

9.6.5 Brazil

9.6.5.1 Brazil Gaming Hardware Market Estimates and Forecasts, by Type (2020-2032) (USD Million)

9.6.5.2 Brazil Gaming Hardware Market Estimates and Forecasts, by End User (2020-2032) (USD Million)

9.6.6 Argentina

9.6.6.1 Argentina Gaming Hardware Market Estimates and Forecasts, by Type (2020-2032) (USD Million)

9.6.6.2 Argentina Gaming Hardware Market Estimates and Forecasts, by End User (2020-2032) (USD Million)

9.6.7 Colombia

9.6.7.1 Colombia Gaming Hardware Market Estimates and Forecasts, by Type (2020-2032) (USD Million)

9.6.7.2 Colombia Gaming Hardware Market Estimates and Forecasts, by End User (2020-2032) (USD Million)

9.6.8 Rest of Latin America

9.6.8.1 Rest of Latin America Gaming Hardware Market Estimates and Forecasts, by Type (2020-2032) (USD Million)

9.6.8.2 Rest of Latin America Gaming Hardware Market Estimates and Forecasts, by End User (2020-2032) (USD Million)

10. Company Profiles

10.1 Microsoft Corporation

10.1.1 Company Overview

10.1.2 Financial

10.1.3 Products/ Services Offered

110.1.4 SWOT Analysis

10.2 Nintendo Co., Ltd.

10.2.1 Company Overview

10.2.2 Financial

10.2.3 Products/ Services Offered

10.2.4 SWOT Analysis

10.3 NVIDIA Corporation

10.3.1 Company Overview

10.3.2 Financial

10.3.3 Products/ Services Offered

10.3.4 SWOT Analysis

10.4 Sony Corporation

10.4.1 Company Overview

10.4.2 Financial

10.4.3 Products/ Services Offered

10.4.4 SWOT Analysis

10.5 Logitech International S.A.

10.5.1 Company Overview

10.5.2 Financial

10.5.3 Products/ Services Offered

10.5.4 SWOT Analysis

10.6 Venom UK Ltd.

10.6.1 Company Overview

10.6.2 Financial

10.6.3 Products/ Services Offered

10.6.4 SWOT Analysis

10.7 Oculus VR

10.7.1 Company Overview

10.7.2 Financial

10.7.3 Products/ Services Offered

10.7.4 SWOT Analysis

10.8 Linden Research

10.8.1 Company Overview

10.8.2 Financial

10.8.3 Products/ Services Offered

10.8.4 SWOT Analysis

10.9 Sega Games

10.9.1 Company Overview

10.9.2 Financial

10.9.3 Products/ Services Offered

10.9.4 SWOT Analysis

10.10 Corsair Gaming, Inc.

             10.9.1 Company Overview

10.9.2 Financial

10.9.3 Products/ Services Offered

10.9.4 SWOT Analysis

11. Use Cases and Best Practices

12. Conclusion

An accurate research report requires proper strategizing as well as implementation. There are multiple factors involved in the completion of good and accurate research report and selecting the best methodology to compete the research is the toughest part. Since the research reports we provide play a crucial role in any company’s decision-making process, therefore we at SNS Insider always believe that we should choose the best method which gives us results closer to reality. This allows us to reach at a stage wherein we can provide our clients best and accurate investment to output ratio.

Each report that we prepare takes a timeframe of 350-400 business hours for production. Starting from the selection of titles through a couple of in-depth brain storming session to the final QC process before uploading our titles on our website we dedicate around 350 working hours. The titles are selected based on their current market cap and the foreseen CAGR and growth.


The 5 steps process:

Step 1: Secondary Research:

Secondary Research or Desk Research is as the name suggests is a research process wherein, we collect data through the readily available information. In this process we use various paid and unpaid databases which our team has access to and gather data through the same. This includes examining of listed companies’ annual reports, Journals, SEC filling etc. Apart from this our team has access to various associations across the globe across different industries. Lastly, we have exchange relationships with various university as well as individual libraries.

Secondary Research

Step 2: Primary Research

When we talk about primary research, it is a type of study in which the researchers collect relevant data samples directly, rather than relying on previously collected data.  This type of research is focused on gaining content specific facts that can be sued to solve specific problems. Since the collected data is fresh and first hand therefore it makes the study more accurate and genuine.

We at SNS Insider have divided Primary Research into 2 parts.

Part 1 wherein we interview the KOLs of major players as well as the upcoming ones across various geographic regions. This allows us to have their view over the market scenario and acts as an important tool to come closer to the accurate market numbers. As many as 45 paid and unpaid primary interviews are taken from both the demand and supply side of the industry to make sure we land at an accurate judgement and analysis of the market.

This step involves the triangulation of data wherein our team analyses the interview transcripts, online survey responses and observation of on filed participants. The below mentioned chart should give a better understanding of the part 1 of the primary interview.

Primary Research

Part 2: In this part of primary research the data collected via secondary research and the part 1 of the primary research is validated with the interviews from individual consultants and subject matter experts.

Consultants are those set of people who have at least 12 years of experience and expertise within the industry whereas Subject Matter Experts are those with at least 15 years of experience behind their back within the same space. The data with the help of two main processes i.e., FGDs (Focused Group Discussions) and IDs (Individual Discussions). This gives us a 3rd party nonbiased primary view of the market scenario making it a more dependable one while collation of the data pointers.

Step 3: Data Bank Validation

Once all the information is collected via primary and secondary sources, we run that information for data validation. At our intelligence centre our research heads track a lot of information related to the market which includes the quarterly reports, the daily stock prices, and other relevant information. Our data bank server gets updated every fortnight and that is how the information which we collected using our primary and secondary information is revalidated in real time.

Data Bank Validation

Step 4: QA/QC Process

After all the data collection and validation our team does a final level of quality check and quality assurance to get rid of any unwanted or undesired mistakes. This might include but not limited to getting rid of the any typos, duplication of numbers or missing of any important information. The people involved in this process include technical content writers, research heads and graphics people. Once this process is completed the title gets uploader on our platform for our clients to read it.

Step 5: Final QC/QA Process:

This is the last process and comes when the client has ordered the study. In this process a final QA/QC is done before the study is emailed to the client. Since we believe in giving our clients a good experience of our research studies, therefore, to make sure that we do not lack at our end in any way humanly possible we do a final round of quality check and then dispatch the study to the client.

MARKET SEGMENTATION

By Type

  • Gaming Consoles

  • Standard Gaming Consoles

  • Handheld Gaming Consoles

  • Gaming Accessories

  • Gaming Controller

  • Gaming Headsets

  • Gaming Cameras

By End User

  • Commercial Gaming Hardware

  • Residential Gaming Hardware

Request for Segment Customization as per your Business Requirement: Segment Customization Request

REGIONAL COVERAGE:

North America

  • US

  • Canada

  • Mexico

Europe

  • Eastern Europe

    • Poland

    • Romania

    • Hungary

    • Turkey

    • Rest of Eastern Europe

  • Western Europe

    • Germany

    • France

    • UK

    • Italy

    • Spain

    • Netherlands

    • Switzerland

    • Austria

    • Rest of Western Europe

Asia Pacific

  • China

  • India

  • Japan

  • South Korea

  • Vietnam

  • Singapore

  • Australia

  • Rest of Asia Pacific

Middle East & Africa

  • Middle East

    • UAE

    • Egypt

    • Saudi Arabia

    • Qatar

    • Rest of the Middle East

  • Africa

    • Nigeria

    • South Africa

    • Rest of Africa

Latin America

  • Brazil

  • Argentina

  • Colombia

Request for Country Level Research Report: Country Level Customization Request

Available Customization

With the given market data, SNS Insider offers customization as per the company’s specific needs. The following customization options are available for the report:

  • Product Analysis

  • Criss-Cross segment analysis (e.g. Product X Application)

  • Product Matrix which gives a detailed comparison of product portfolio of each company

  • Geographic Analysis

  • Additional countries in any of the regions

  • Company Information

  • Detailed analysis and profiling of additional market players (Up to five)


  •            5000 (33% Discount)


  •            8950 (40% Discount)


  •            3050 (23% Discount)

Start a Conversation

Hi! Click one of our member below to chat on Phone