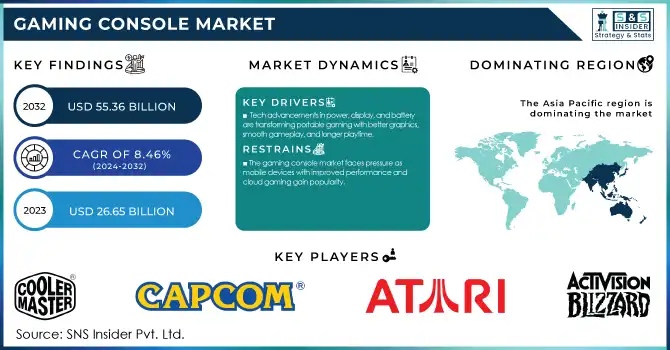
The Gaming Console Market Size was valued at USD 26.65 billion in 2023 and is expected to grow to USD 55.36 billion by 2032 and grow at a CAGR of 8.46% over the forecast period of 2024-2032.
The gaming console market has seen significant growth driven by the rise of online multiplayer games and e-sports, which have fostered a competitive, engaged community. Improved internet connectivity and the expansion of cloud gaming have broadened the reach of console gaming, making it more accessible.
Get E-PDF Sample Report on Gaming Console Market - Request Sample Report
Additionally, the integration of consoles with streaming services and multimedia functionalities has transformed them into all-in-one entertainment hubs, appealing to a wider demographic. Leading vendors such as Sony and Microsoft are capitalizing on this trend by launching high-performance consoles tailored to the needs of hardcore gamers. Both companies are preparing to release new-generation consoles, utilizing strategic pricing and marketing to maintain their dominance. The evolution of gaming hardware, with iterative console models like Sony’s PlayStation 4 (PS4), PlayStation 4 Pro, and PlayStation Slim, alongside Microsoft's Xbox One S, reflects the industry's shift towards more advanced and versatile devices. Furthermore, advancements in virtual and augmented reality (VR/AR) technologies are reshaping the gaming experience, attracting both existing players and newcomers. The demand for home consoles has also surged as modern games require powerful hardware, and the added appeal of 4K TVs enhances the overall experience. Collaborations like Amazon and Microsoft’s integration of Xbox cloud gaming into Fire TV devices further expand accessibility to premium gaming content, with popular titles such as Starfield, Fallout 4, and Forza Horizon 5 available through the Xbox Game Pass Ultimate subscription. However, growth in the gaming console market is hindered by challenges such as high development costs, supply chain issues, semiconductor shortages, and intense competition from mobile and PC gaming. The increasing shift toward cloud gaming and streaming services, combined with economic uncertainties, presents additional challenges. Despite these hurdles, the continued development of immersive VR/AR technologies is expected to drive further growth, with game developers creating exclusive experiences for advanced consoles and VR/AR peripherals like headsets playing a key role in market expansion.
Drivers
Tech advancements in power, display, and battery are transforming portable gaming with better graphics, smooth gameplay, and longer playtime.
Technological advancements are transforming the portable gaming console market, driving the demand for more powerful, immersive, and user-centric systems. Among these innovations, improvements in hardware, display technology, and battery life have become crucial in addressing the evolving needs of gamers. One of the most notable trends is the substantial boost in processing power. Modern consoles now feature high-performance processors and GPUs that offer smooth, high-quality graphics, even for demanding games, enabling portable systems to rival traditional home consoles.Display technology has significantly advanced, with portable gaming consoles now equipped with high refresh rates and features like Variable Refresh Rate (VRR), ensuring a fluid, lag-free gaming experience. This is particularly vital for fast-paced games, where smooth visuals directly impact gameplay. Additionally, advancements in battery life are helping portable systems to support longer gaming sessions without the frequent need to recharge, a common limitation of previous models.The latest models now feature powerful processors, such as AMD Ryzen and high-performance GPUs, capable of handling graphically intense games at 1080p with high frame rates. The display technology has also evolved, with consoles boasting 120Hz refresh rates and VRR support to ensure smooth, immersive visuals with minimal screen tearing. This is particularly important for fast-paced games, where fluidity in visual rendering can enhance the overall experience. The advancements in battery life, with powerful 72Wh batteries, enable gamers to enjoy extended gaming sessions without the constant need for recharging. The integration of capacitive joystick technology provides better precision and durability, making these consoles suitable for both casual and competitive gamers. These combined features showcase how portable gaming systems are meeting the growing demand for high-performance, on-the-go gaming experiences that balance power and portability. As the gaming industry embraces more mobile and cloud-based experiences, these innovations signal a new era for portable gaming consoles.
Restraints
The gaming console market faces pressure as mobile devices with improved performance and cloud gaming gain popularity.
The gaming console market is facing significant challenges due to competition from mobile devices, which are rapidly enhancing their gaming capabilities. Smartphones and tablets, equipped with powerful processors, high-quality displays, and an expanding library of gaming apps, provide a convenient and versatile alternative to traditional gaming consoles. The increasing performance of mobile devices, including advanced cooling systems and improved graphics, is narrowing the gap between them and dedicated gaming consoles, making them more attractive to consumers. Companies like Samsung and RedMagic are also developing gaming smartphones that can serve as full-fledged gaming systems, further intensifying competition. Additionally, the rise of cloud gaming has made it easier for players to access console-quality games directly on their mobile devices, further diminishing the need for traditional gaming hardware. PC gaming is also gaining momentum, now accounting for 53% of non-mobile gaming sales, which adds to the pressure on the console market. Developers are increasingly prioritizing mobile platforms, with 90% of them planning to develop for iOS and 75% for Android, while only 15% are focusing on Windows Phone. This trend underscores the growing shift towards mobile-first gaming, and as mobile gaming devices continue to improve, established gaming console brands like Nintendo, Sony, and Valve face mounting pressure to innovate in order to remain competitive.
By Type
In 2023, the home console segment led the gaming console market, holding a 63% share. This includes popular consoles like PlayStation, Xbox, and Nintendo Switch, designed for stationary use with a TV or monitor. Home consoles remain dominant due to their ability to deliver high-performance gaming, superior graphics, and fast processing speeds, alongside extensive game libraries. Console-exclusive titles, such as The Last of Us, Halo, and Zelda, build strong brand loyalty, influencing consumer choices. Additionally, home consoles offer immersive experiences for both single-player and multiplayer games, which mobile devices and PCs struggle to replicate. They also provide robust online services like PlayStation Network and Xbox Live, supporting multiplayer gaming and exclusive content. The affordability and broad accessibility of home consoles appeal to both casual and serious gamers.
The handheld console segment is projected to see the fastest growth in the gaming console market from 2024 to 2032. Devices like the Nintendo Switch, PlayStation Vita, and upcoming models from companies like AOKZOE offer the advantage of gaming on the go, making them increasingly popular among gamers seeking portability. The segment’s growth is driven by advancements in hardware, such as faster processors, improved GPUs, and higher resolution displays, enabling handheld consoles to deliver experiences similar to traditional home consoles. Additionally, battery life improvements are addressing one of the main limitations of portable devices, allowing for longer gaming sessions. As these devices continue to evolve, they offer both casual and serious gamers a compelling alternative to home consoles and mobile gaming.
By Application
In 2023, the gaming segment dominated the gaming console market, accounting for approximately 79% of total market revenue. This dominance is driven by the widespread demand for high-quality gaming experiences, with consoles like PlayStation, Xbox, and Nintendo Switch leading the charge. The gaming segment remains the primary focus for console manufacturers, as these devices offer immersive gameplay, advanced graphics, and large game libraries that cater to both casual and hardcore gamers. The continuous innovation in gaming technology, including faster processors, enhanced graphics, and exclusive titles, further boosts the appeal of gaming consoles. The growing popularity of online multiplayer gaming and virtual reality experiences has contributed to the sustained growth of the gaming segment, making it the dominant revenue-generating application in the gaming console market.
The non-gaming segment is expected to be the fastest-growing segment in the gaming console market from 2024 to 2032. This growth is largely driven by the increasing adoption of consoles for entertainment purposes beyond gaming, such as streaming services, media consumption, and interactive applications. Devices like PlayStation and Xbox are now equipped with features that support video streaming, music, and even fitness apps, making them multifunctional entertainment hubs. The rise of cloud gaming and services such as Xbox Game Pass and PlayStation Plus, offering access to a library of games and additional entertainment content, is also contributing to this trend. As consumers increasingly seek all-in-one devices for entertainment, the non-gaming segment is expanding rapidly, pushing the gaming consoles to serve as versatile home entertainment systems.
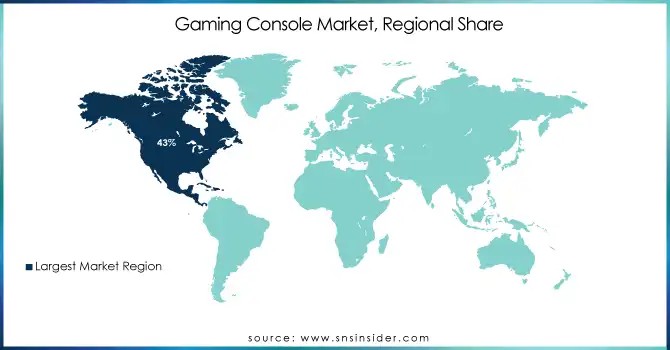
North America dominated the gaming console market in 2023, accounting for approximately 43% of the global market share. This dominance is driven by a combination of factors, including strong consumer demand, high disposable incomes, and the rapid adoption of gaming technologies. The U.S. and Canada are key contributors to this growth, with leading gaming companies like Sony, Microsoft, and Nintendo having a significant presence in the region. The region benefits from a large, engaged gaming population, including both casual and hardcore gamers. Additionally, the continuous technological advancements in hardware and gaming ecosystems, along with growing interest in online multiplayer gaming and esports, have contributed to the sustained growth of the gaming console market in North America, solidifying its leadership position.
Asia-Pacific is expected to be the fastest-growing region in the gaming console market over the forecast period from 2024 to 2032. This growth is driven by rapid technological advancements, increasing disposable income, and a large, youthful population with a growing interest in gaming. Key markets such as China, Japan, South Korea, and India are at the forefront of this expansion. China, with its massive gaming community and rising middle class, is a significant contributor to the region’s growth. Japan and South Korea, home to major gaming companies like Sony and Nintendo, continue to innovate in gaming hardware and software, strengthening their market presence. India’s expanding digital infrastructure and increasing smartphone penetration are also influencing gaming adoption, making Asia-Pacific a hub for gaming console market expansion.
Get Customized Report as Per Your Business Requirement - Request For Customized Report
Some of the major key Players in Gaming Console Market with their product:
Activision Blizzard (Games: Call of Duty, Overwatch, World of Warcraft)
Atari Inc. (Retro Consoles: Atari VCS)
Capcom Co. Ltd. (Games: Resident Evil, Street Fighter, Monster Hunter)
Cooler Master Co. Ltd. (Gaming Peripherals: Cooling Systems, Cases, Keyboards)
Corsair Components Inc. (Gaming Peripherals: Headsets, Keyboards, Mice, Memory Modules)
Dell Technologies (Alienware Gaming PCs and Peripherals)
Gameloft SE (Mobile and Console Games: Asphalt Series, Disney Magic Kingdoms)
Hyperkin Inc. (Retro Gaming Accessories: RetroN Series Consoles, Controllers)
HyperX (Gaming Headsets, Keyboards, Memory Products)
Logitech Inc. (Gaming Peripherals: Keyboards, Mice, Racing Wheels)
Mad Catz Global Ltd. (Gaming Accessories: Arcade Sticks, Controllers, Keyboards)
Microsoft Corp. (Consoles: Xbox Series X/S, Games: Halo, Forza Horizon)
Nintendo Co. Ltd. (Consoles: Nintendo Switch, Games: Mario, Zelda, Pokémon)
NVIDIA Corporation (Gaming Hardware: GeForce GPUs, SHIELD TV)
Ouya Inc. (Subsidiary of Razer) (Console: Ouya Android Gaming Console)
PlayJam (Smart TV Gaming Platforms and Micro-Consoles: GameStick)
Razer Inc. (Gaming Peripherals: Keyboards, Mice, Laptops, Razer Kishi)
Redragon (Gaming Peripherals: Keyboards, Mice, Headsets)
Republic of Gamers (ROG) (ASUS Brand) (Gaming Laptops, Desktops, Accessories)
Rockstar Games Inc. (Games: Grand Theft Auto, Red Dead Redemption, Max Payne)
Sega Holdings Co. Ltd. (Games: Sonic the Hedgehog, Yakuza Series, Retro Consoles)
Sony Corp. (Consoles: PlayStation Series, Games: God of War, The Last of Us)
SteelSeries (Gaming Peripherals: Headsets, Mice, Keyboards, Controllers)
Tencent Games (Games: PUBG Mobile, Honor of Kings, Call of Duty Mobile)
Ubisoft Entertainment SA (Games: Assassin’s Creed, Far Cry, Watch Dogs)
Valve Corp. (Games and Hardware: Steam Deck, Half-Life, Dota 2, Steam Platform)
List of suppliers for the gaming console market, which provide components, technology, or services critical to the development and manufacturing of gaming consoles:
Foxconn Technology Group
Pegatron Corporation
Wistron Corporation
Samsung Electronics Co., Ltd.
Micron Technology, Inc.
NVIDIA Corporation
AMD (Advanced Micro Devices, Inc.)
MediaTek Inc.
Murata Manufacturing Co., Ltd.
Nidec Corporation
3 Dec 2024: Sony CEO Hermen Hulst highlighted AI's transformative impact on gaming, enabling dynamic experiences but emphasized that human creativity remains irreplaceable in storytelling. Sony also marked 30 years of PlayStation, celebrating over 450 million units sold since its 1994 launch.
November 13, 2024: Microsoft Gaming CEO Phil Spencer confirmed plans for an Xbox handheld device, currently in prototype stages, aiming to support both local and cloud gaming.
January 17, 2025: Nintendo announced the Nintendo Switch 2, set to launch in 2025 with backward compatibility for most original Switch games, but investor concerns over the extended timeline led to a 5% drop in its shares.
Report Attributes | Details |
Market Size in 2023 | USD 26.65 Billion |
Market Size by 2032 | USD 55.36 Billion |
CAGR | CAGR of 8.46% From 2024 to 2032 |
Base Year | 2023 |
Forecast Period | 2024-2032 |
Historical Data | 2020-2022 |
Report Scope & Coverage | Market Size, Segments Analysis, Competitive Landscape, Regional Analysis, DROC & SWOT Analysis, Forecast Outlook |
Key Segments | • By Type (Home Console, Handheld Console [Portable, Non-Portable]) • By Application (Gaming, Non-Gaming) • By End Use (Residential, Commercial) |
Regional Analysis/Coverage | North America (US, Canada, Mexico), Europe (Eastern Europe [Poland, Romania, Hungary, Turkey, Rest of Eastern Europe] Western Europe] Germany, France, UK, Italy, Spain, Netherlands, Switzerland, Austria, Rest of Western Europe]), Asia Pacific (China, India, Japan, South Korea, Vietnam, Singapore, Australia, Rest of Asia Pacific), Middle East & Africa (Middle East [UAE, Egypt, Saudi Arabia, Qatar, Rest of Middle East], Africa [Nigeria, South Africa, Rest of Africa], Latin America (Brazil, Argentina, Colombia, Rest of Latin America) |
Company Profiles | Activision Blizzard, Atari, Capcom, Cooler Master, Corsair, Dell Technologies, Gameloft, Hyperkin, HyperX, Logitech, Mad Catz, Microsoft, Nintendo, NVIDIA, Ouya, PlayJam, Razer, Redragon, Republic of Gamers (ASUS), Rockstar Games, Sega, Sony, SteelSeries, Tencent Games, Ubisoft, and Valve |
Key Drivers | • Tech advancements in power, display, and battery are transforming portable gaming with better graphics, smooth gameplay, and longer playtime. |
Restraints | • The gaming console market faces pressure as mobile devices with improved performance and cloud gaming gain popularity. |
Ans: Gaming Console Market is anticipated to expand by 8.46% from 2024 to 2032.
Ans: The market size was expected to be USD 26.65 billion in 2023.
Ans: North America held the largest market share in the market.
Ans: The home console category dominates the segment in the market.
Ans: The Gaming category had the largest market share in the market.
1. Introduction
1.1 Market Definition
1.2 Scope (Inclusion and Exclusions)
1.3 Research Assumptions
2. Executive Summary
2.1 Market Overview
2.2 Regional Synopsis
2.3 Competitive Summary
3. Research Methodology
3.1 Top-Down Approach
3.2 Bottom-up Approach
3.3. Data Validation
3.4 Primary Interviews
4. Market Dynamics Impact Analysis
4.1 Market Driving Factors Analysis
4.1.1 Drivers
4.1.2 Restraints
4.2 PESTLE Analysis
4.3 Porter’s Five Forces Model
5. Statistical Insights and Trends Reporting
5.1 Consumer Behavior by Region
5.2 Technology Trends by Region
5.3 Environmental Impact Metrics by Region
5.4 Innovation and R&D
6. Competitive Landscape
6.1 List of Major Companies, By Region
6.2 Market Share Analysis, By Region
6.3 Product Benchmarking
6.3.1 Product specifications and features
6.3.2 Pricing
6.4 Strategic Initiatives
6.4.1 Marketing and promotional activities
6.4.2 Distribution and supply chain strategies
6.4.3 Expansion plans and new product launches
6.4.4 Strategic partnerships and collaborations
6.5 Technological Advancements
6.6 Market Positioning and Branding
7. Gaming Console Market Segmentation, by Type
7.1 Chapter Overview
7.2 Home Console
7.2.1 Home Console Market Trends Analysis (2020-2032)
7.2.2 Home Console Market Size Estimates and Forecasts to 2032 (USD Billion)
7.3 Handheld Console
7.3.1 Handheld Console Market Trends Analysis (2020-2032)
7.3.2 Handheld Console Market Size Estimates and Forecasts to 2032 (USD Billion)
7.3.3 Portable
7.3.3.1 Portable Market Trends Analysis (2020-2032)
7.3.3.2 Portable Market Size Estimates and Forecasts to 2032 (USD Billion)
7.3.4 Non-Portable
7.3.4.1 Non-Portable Market Trends Analysis (2020-2032)
7.3.4.2 Non-Portable Market Size Estimates and Forecasts to 2032 (USD Billion)
8. Gaming Console Market Segmentation, by Application
8.1 Chapter Overview
8.2 Gaming
8.2.1 Gaming Market Trends Analysis (2020-2032)
8.2.2 Gaming Market Size Estimates and Forecasts to 2032 (USD Billion)
8.3 Non-Gaming
8.3.1 Non-Gaming Market Trends Analysis (2020-2032)
8.3.2 Non-Gaming Market Size Estimates and Forecasts to 2032 (USD Billion)
9. Gaming Console Market Segmentation, by End Use
9.1 Chapter Overview
9.2 Residential
9.2.1 Residential Market Trends Analysis (2020-2032)
9.2.2 Residential Market Size Estimates and Forecasts to 2032 (USD Billion)
9.3 Commercial
9.3.1 Commercial Market Trends Analysis (2020-2032)
9.3.2 Commercial Market Size Estimates and Forecasts to 2032 (USD Billion)
10. Regional Analysis
10.1 Chapter Overview
10.2 North America
10.2.1 Trends Analysis
10.2.2 North America Gaming Console Market Estimates and Forecasts, by Country (2020-2032) (USD Billion)
10.2.3 North America Gaming Console Market Estimates and Forecasts, by Type (2020-2032) (USD Billion)
10.2.4 North America Gaming Console Market Estimates and Forecasts, by Application (2020-2032) (USD Billion)
10.2.5 North America Gaming Console Market Estimates and Forecasts, by End Use (2020-2032) (USD Billion)
10.2.6 USA
10.2.6.1 USA Gaming Console Market Estimates and Forecasts, by Type (2020-2032) (USD Billion)
10.2.6.2 USA Gaming Console Market Estimates and Forecasts, by Application (2020-2032) (USD Billion)
10.2.6.3 USA Gaming Console Market Estimates and Forecasts, by End Use (2020-2032) (USD Billion)
10.2.7 Canada
10.2.7.1 Canada Gaming Console Market Estimates and Forecasts, by Type (2020-2032) (USD Billion)
10.2.7.2 Canada Gaming Console Market Estimates and Forecasts, by Application (2020-2032) (USD Billion)
10.2.7.3 Canada Gaming Console Market Estimates and Forecasts, by End Use (2020-2032) (USD Billion)
10.2.8 Mexico
10.2.8.1 Mexico Gaming Console Market Estimates and Forecasts, by Type (2020-2032) (USD Billion)
10.2.8.2 Mexico Gaming Console Market Estimates and Forecasts, by Application (2020-2032) (USD Billion)
10.2.8.3 Mexico Gaming Console Market Estimates and Forecasts, by End Use (2020-2032) (USD Billion)
10.3 Europe
10.3.1 Eastern Europe
10.3.1.1 Trends Analysis
10.3.1.2 Eastern Europe Gaming Console Market Estimates and Forecasts, by Country (2020-2032) (USD Billion)
10.3.1.3 Eastern Europe Gaming Console Market Estimates and Forecasts, by Type (2020-2032) (USD Billion)
10.3.1.4 Eastern Europe Gaming Console Market Estimates and Forecasts, by Application (2020-2032) (USD Billion)
10.3.1.5 Eastern Europe Gaming Console Market Estimates and Forecasts, by End Use (2020-2032) (USD Billion)
10.3.1.6 Poland
10.3.1.6.1 Poland Gaming Console Market Estimates and Forecasts, by Type (2020-2032) (USD Billion)
10.3.1.6.2 Poland Gaming Console Market Estimates and Forecasts, by Application (2020-2032) (USD Billion)
10.3.1.6.3 Poland Gaming Console Market Estimates and Forecasts, by End Use (2020-2032) (USD Billion)
10.3.1.7 Romania
10.3.1.7.1 Romania Gaming Console Market Estimates and Forecasts, by Type (2020-2032) (USD Billion)
10.3.1.7.2 Romania Gaming Console Market Estimates and Forecasts, by Application (2020-2032) (USD Billion)
10.3.1.7.3 Romania Gaming Console Market Estimates and Forecasts, by End Use (2020-2032) (USD Billion)
10.3.1.8 Hungary
10.3.1.8.1 Hungary Gaming Console Market Estimates and Forecasts, by Type (2020-2032) (USD Billion)
10.3.1.8.2 Hungary Gaming Console Market Estimates and Forecasts, by Application (2020-2032) (USD Billion)
10.3.1.8.3 Hungary Gaming Console Market Estimates and Forecasts, by End Use (2020-2032) (USD Billion)
10.3.1.9 Turkey
10.3.1.9.1 Turkey Gaming Console Market Estimates and Forecasts, by Type (2020-2032) (USD Billion)
10.3.1.9.2 Turkey Gaming Console Market Estimates and Forecasts, by Application (2020-2032) (USD Billion)
10.3.1.9.3 Turkey Gaming Console Market Estimates and Forecasts, by End Use (2020-2032) (USD Billion)
10.3.1.10 Rest of Eastern Europe
10.3.1.10.1 Rest of Eastern Europe Gaming Console Market Estimates and Forecasts, by Type (2020-2032) (USD Billion)
10.3.1.10.2 Rest of Eastern Europe Gaming Console Market Estimates and Forecasts, by Application (2020-2032) (USD Billion)
10.3.1.10.3 Rest of Eastern Europe Gaming Console Market Estimates and Forecasts, by End Use (2020-2032) (USD Billion)
10.3.2 Western Europe
10.3.2.1 Trends Analysis
10.3.2.2 Western Europe Gaming Console Market Estimates and Forecasts, by Country (2020-2032) (USD Billion)
10.3.2.3 Western Europe Gaming Console Market Estimates and Forecasts, by Type (2020-2032) (USD Billion)
10.3.2.4 Western Europe Gaming Console Market Estimates and Forecasts, by Application (2020-2032) (USD Billion)
10.3.2.5 Western Europe Gaming Console Market Estimates and Forecasts, by End Use (2020-2032) (USD Billion)
10.3.2.6 Germany
10.3.2.6.1 Germany Gaming Console Market Estimates and Forecasts, by Type (2020-2032) (USD Billion)
10.3.2.6.2 Germany Gaming Console Market Estimates and Forecasts, by Application (2020-2032) (USD Billion)
10.3.2.6.3 Germany Gaming Console Market Estimates and Forecasts, by End Use (2020-2032) (USD Billion)
10.3.2.7 France
10.3.2.7.1 France Gaming Console Market Estimates and Forecasts, by Type (2020-2032) (USD Billion)
10.3.2.7.2 France Gaming Console Market Estimates and Forecasts, by Application (2020-2032) (USD Billion)
10.3.2.7.3 France Gaming Console Market Estimates and Forecasts, by End Use (2020-2032) (USD Billion)
10.3.2.8 UK
10.3.2.8.1 UK Gaming Console Market Estimates and Forecasts, by Type (2020-2032) (USD Billion)
10.3.2.8.2 UK Gaming Console Market Estimates and Forecasts, by Application (2020-2032) (USD Billion)
10.3.2.8.3 UK Gaming Console Market Estimates and Forecasts, by End Use (2020-2032) (USD Billion)
10.3.2.9 Italy
10.3.2.9.1 Italy Gaming Console Market Estimates and Forecasts, by Type (2020-2032) (USD Billion)
10.3.2.9.2 Italy Gaming Console Market Estimates and Forecasts, by Application (2020-2032) (USD Billion)
10.3.2.9.3 Italy Gaming Console Market Estimates and Forecasts, by End Use (2020-2032) (USD Billion)
10.3.2.10 Spain
10.3.2.10.1 Spain Gaming Console Market Estimates and Forecasts, by Type (2020-2032) (USD Billion)
10.3.2.10.2 Spain Gaming Console Market Estimates and Forecasts, by Application (2020-2032) (USD Billion)
10.3.2.10.3 Spain Gaming Console Market Estimates and Forecasts, by End Use (2020-2032) (USD Billion)
10.3.2.11 Netherlands
10.3.2.11.1 Netherlands Gaming Console Market Estimates and Forecasts, by Type (2020-2032) (USD Billion)
10.3.2.11.2 Netherlands Gaming Console Market Estimates and Forecasts, by Application (2020-2032) (USD Billion)
10.3.2.11.3 Netherlands Gaming Console Market Estimates and Forecasts, by End Use (2020-2032) (USD Billion)
10.3.2.12 Switzerland
10.3.2.12.1 Switzerland Gaming Console Market Estimates and Forecasts, by Type (2020-2032) (USD Billion)
10.3.2.12.2 Switzerland Gaming Console Market Estimates and Forecasts, by Application (2020-2032) (USD Billion)
10.3.2.12.3 Switzerland Gaming Console Market Estimates and Forecasts, by End Use (2020-2032) (USD Billion)
10.3.2.13 Austria
10.3.2.13.1 Austria Gaming Console Market Estimates and Forecasts, by Type (2020-2032) (USD Billion)
10.3.2.13.2 Austria Gaming Console Market Estimates and Forecasts, by Application (2020-2032) (USD Billion)
10.3.2.13.3 Austria Gaming Console Market Estimates and Forecasts, by End Use (2020-2032) (USD Billion)
10.3.2.14 Rest of Western Europe
10.3.2.14.1 Rest of Western Europe Gaming Console Market Estimates and Forecasts, by Type (2020-2032) (USD Billion)
10.3.2.14.2 Rest of Western Europe Gaming Console Market Estimates and Forecasts, by Application (2020-2032) (USD Billion)
10.3.2.14.3 Rest of Western Europe Gaming Console Market Estimates and Forecasts, by End Use (2020-2032) (USD Billion)
10.4 Asia-Pacific
10.4.1 Trends Analysis
10.4.2 Asia-Pacific Gaming Console Market Estimates and Forecasts, by Country (2020-2032) (USD Billion)
10.4.3 Asia-Pacific Gaming Console Market Estimates and Forecasts, by Type (2020-2032) (USD Billion)
10.4.4 Asia-Pacific Gaming Console Market Estimates and Forecasts, by Application (2020-2032) (USD Billion)
10.4.5 Asia-Pacific Gaming Console Market Estimates and Forecasts, by End Use (2020-2032) (USD Billion)
10.4.6 China
10.4.6.1 China Gaming Console Market Estimates and Forecasts, by Type (2020-2032) (USD Billion)
10.4.6.2 China Gaming Console Market Estimates and Forecasts, by Application (2020-2032) (USD Billion)
10.4.6.3 China Gaming Console Market Estimates and Forecasts, by End Use (2020-2032) (USD Billion)
10.4.7 India
10.4.7.1 India Gaming Console Market Estimates and Forecasts, by Type (2020-2032) (USD Billion)
10.4.7.2 India Gaming Console Market Estimates and Forecasts, by Application (2020-2032) (USD Billion)
10.4.7.3 India Gaming Console Market Estimates and Forecasts, by End Use (2020-2032) (USD Billion)
10.4.8 Japan
10.4.8.1 Japan Gaming Console Market Estimates and Forecasts, by Type (2020-2032) (USD Billion)
10.4.8.2 Japan Gaming Console Market Estimates and Forecasts, by Application (2020-2032) (USD Billion)
10.4.8.3 Japan Gaming Console Market Estimates and Forecasts, by End Use (2020-2032) (USD Billion)
10.4.9 South Korea
10.4.9.1 South Korea Gaming Console Market Estimates and Forecasts, by Type (2020-2032) (USD Billion)
10.4.9.2 South Korea Gaming Console Market Estimates and Forecasts, by Application (2020-2032) (USD Billion)
10.4.9.3 South Korea Gaming Console Market Estimates and Forecasts, by End Use (2020-2032) (USD Billion)
10.4.10 Vietnam
10.4.10.1 Vietnam Gaming Console Market Estimates and Forecasts, by Type (2020-2032) (USD Billion)
10.4.10.2 Vietnam Gaming Console Market Estimates and Forecasts, by Application (2020-2032) (USD Billion)
10.4.10.3 Vietnam Gaming Console Market Estimates and Forecasts, by End Use (2020-2032) (USD Billion)
10.4.11 Singapore
10.4.11.1 Singapore Gaming Console Market Estimates and Forecasts, by Type (2020-2032) (USD Billion)
10.4.11.2 Singapore Gaming Console Market Estimates and Forecasts, by Application (2020-2032) (USD Billion)
10.4.11.3 Singapore Gaming Console Market Estimates and Forecasts, by End Use (2020-2032) (USD Billion)
10.4.12 Australia
10.4.12.1 Australia Gaming Console Market Estimates and Forecasts, by Type (2020-2032) (USD Billion)
10.4.12.2 Australia Gaming Console Market Estimates and Forecasts, by Application (2020-2032) (USD Billion)
10.4.12.3 Australia Gaming Console Market Estimates and Forecasts, by End Use (2020-2032) (USD Billion)
10.4.13 Rest of Asia-Pacific
10.4.13.1 Rest of Asia-Pacific Gaming Console Market Estimates and Forecasts, by Type (2020-2032) (USD Billion)
10.4.13.2 Rest of Asia-Pacific Gaming Console Market Estimates and Forecasts, by Application (2020-2032) (USD Billion)
10.4.13.3 Rest of Asia-Pacific Gaming Console Market Estimates and Forecasts, by End Use (2020-2032) (USD Billion)
10.5 Middle East and Africa
10.5.1 Middle East
10.5.1.1 Trends Analysis
10.5.1.2 Middle East Gaming Console Market Estimates and Forecasts, by Country (2020-2032) (USD Billion)
10.5.1.3 Middle East Gaming Console Market Estimates and Forecasts, by Type (2020-2032) (USD Billion)
10.5.1.4 Middle East Gaming Console Market Estimates and Forecasts, by Application (2020-2032) (USD Billion)
10.5.1.5 Middle East Gaming Console Market Estimates and Forecasts, by End Use (2020-2032) (USD Billion)
10.5.1.6 UAE
10.5.1.6.1 UAE Gaming Console Market Estimates and Forecasts, by Type (2020-2032) (USD Billion)
10.5.1.6.2 UAE Gaming Console Market Estimates and Forecasts, by Application (2020-2032) (USD Billion)
10.5.1.6.3 UAE Gaming Console Market Estimates and Forecasts, by End Use (2020-2032) (USD Billion)
10.5.1.7 Egypt
10.5.1.7.1 Egypt Gaming Console Market Estimates and Forecasts, by Type (2020-2032) (USD Billion)
10.5.1.7.2 Egypt Gaming Console Market Estimates and Forecasts, by Application (2020-2032) (USD Billion)
10.5.1.7.3 Egypt Gaming Console Market Estimates and Forecasts, by End Use (2020-2032) (USD Billion)
10.5.1.8 Saudi Arabia
10.5.1.8.1 Saudi Arabia Gaming Console Market Estimates and Forecasts, by Type (2020-2032) (USD Billion)
10.5.1.8.2 Saudi Arabia Gaming Console Market Estimates and Forecasts, by Application (2020-2032) (USD Billion)
10.5.1.8.3 Saudi Arabia Gaming Console Market Estimates and Forecasts, by End Use (2020-2032) (USD Billion)
10.5.1.9 Qatar
10.5.1.9.1 Qatar Gaming Console Market Estimates and Forecasts, by Type (2020-2032) (USD Billion)
10.5.1.9.2 Qatar Gaming Console Market Estimates and Forecasts, by Application (2020-2032) (USD Billion)
10.5.1.9.3 Qatar Gaming Console Market Estimates and Forecasts, by End Use (2020-2032) (USD Billion)
10.5.1.10 Rest of Middle East
10.5.1.10.1 Rest of Middle East Gaming Console Market Estimates and Forecasts, by Type (2020-2032) (USD Billion)
10.5.1.10.2 Rest of Middle East Gaming Console Market Estimates and Forecasts, by Application (2020-2032) (USD Billion)
10.5.1.10.3 Rest of Middle East Gaming Console Market Estimates and Forecasts, by End Use (2020-2032) (USD Billion)
10.5.2 Africa
10.5.2.1 Trends Analysis
10.5.2.2 Africa Gaming Console Market Estimates and Forecasts, by Country (2020-2032) (USD Billion)
10.5.2.3 Africa Gaming Console Market Estimates and Forecasts, by Type (2020-2032) (USD Billion)
10.5.2.4 Africa Gaming Console Market Estimates and Forecasts, by Application (2020-2032) (USD Billion)
10.5.2.5 Africa Gaming Console Market Estimates and Forecasts, by End Use (2020-2032) (USD Billion)
10.5.2.6 South Africa
10.5.2.6.1 South Africa Gaming Console Market Estimates and Forecasts, by Type (2020-2032) (USD Billion)
10.5.2.6.2 South Africa Gaming Console Market Estimates and Forecasts, by Application (2020-2032) (USD Billion)
10.5.2.6.3 South Africa Gaming Console Market Estimates and Forecasts, by End Use (2020-2032) (USD Billion)
10.5.2.7 Nigeria
10.5.2.7.1 Nigeria Gaming Console Market Estimates and Forecasts, by Type (2020-2032) (USD Billion)
10.5.2.7.2 Nigeria Gaming Console Market Estimates and Forecasts, by Application (2020-2032) (USD Billion)
10.5.2.7.3 Nigeria Gaming Console Market Estimates and Forecasts, by End Use (2020-2032) (USD Billion)
10.5.2.8 Rest of Africa
10.5.2.8.1 Rest of Africa Gaming Console Market Estimates and Forecasts, by Type (2020-2032) (USD Billion)
10.5.2.8.2 Rest of Africa Gaming Console Market Estimates and Forecasts, by Application (2020-2032) (USD Billion)
10.5.2.8.3 Rest of Africa Gaming Console Market Estimates and Forecasts, by End Use (2020-2032) (USD Billion)
10.6 Latin America
10.6.1 Trends Analysis
10.6.2 Latin America Gaming Console Market Estimates and Forecasts, by Country (2020-2032) (USD Billion)
10.6.3 Latin America Gaming Console Market Estimates and Forecasts, by Type (2020-2032) (USD Billion)
10.6.4 Latin America Gaming Console Market Estimates and Forecasts, by Application (2020-2032) (USD Billion)
10.6.5 Latin America Gaming Console Market Estimates and Forecasts, by End Use (2020-2032) (USD Billion)
10.6.6 Brazil
10.6.6.1 Brazil Gaming Console Market Estimates and Forecasts, by Type (2020-2032) (USD Billion)
10.6.6.2 Brazil Gaming Console Market Estimates and Forecasts, by Application (2020-2032) (USD Billion)
10.6.6.3 Brazil Gaming Console Market Estimates and Forecasts, by End Use (2020-2032) (USD Billion)
10.6.7 Argentina
10.6.7.1 Argentina Gaming Console Market Estimates and Forecasts, by Type (2020-2032) (USD Billion)
10.6.7.2 Argentina Gaming Console Market Estimates and Forecasts, by Application (2020-2032) (USD Billion)
10.6.7.3 Argentina Gaming Console Market Estimates and Forecasts, by End Use (2020-2032) (USD Billion)
10.6.8 Colombia
10.6.8.1 Colombia Gaming Console Market Estimates and Forecasts, by Type (2020-2032) (USD Billion)
10.6.8.2 Colombia Gaming Console Market Estimates and Forecasts, by Application (2020-2032) (USD Billion)
10.6.8.3 Colombia Gaming Console Market Estimates and Forecasts, by End Use (2020-2032) (USD Billion)
10.6.9 Rest of Latin America
10.6.9.1 Rest of Latin America Gaming Console Market Estimates and Forecasts, by Type (2020-2032) (USD Billion)
10.6.9.2 Rest of Latin America Gaming Console Market Estimates and Forecasts, by Application (2020-2032) (USD Billion)
10.6.9.3 Rest of Latin America Gaming Console Market Estimates and Forecasts, by End Use (2020-2032) (USD Billion)
11. Company Profiles
11.1 Activision Blizzard
11.1.1 Company Overview
11.1.2 Financial
11.1.3 Products/ Services Offered
11.1.4 SWOT Analysis
11.2 Atari Inc.
11.2.1 Company Overview
11.2.2 Financial
11.2.3 Products/ Services Offered
11.2.4 SWOT Analysis
11.3 Capcom Co. Ltd.
11.3.1 Company Overview
11.3.2 Financial
11.3.3 Products/ Services Offered
11.3.4 SWOT Analysis
11.4 Cooler Master Co. Ltd.
11.4.1 Company Overview
11.4.2 Financial
11.4.3 Products/ Services Offered
11.4.4 SWOT Analysis
11.5 Corsair Components Inc.
11.5.1 Company Overview
11.5.2 Financial
11.5.3 Products/ Services Offered
11.5.4 SWOT Analysis
11.6 Dell Technologies
11.6.1 Company Overview
11.6.2 Financial
11.6.3 Products/ Services Offered
11.6.4 SWOT Analysis
11.7 Gameloft SE
11.7.1 Company Overview
11.7.2 Financial
11.7.3 Products/ Services Offered
11.7.4 SWOT Analysis
11.8 Hyperkin Inc.
11.8.1 Company Overview
11.8.2 Financial
11.8.3 Products/ Services Offered
11.8.4 SWOT Analysis
11.9 HyperX
11.9.1 Company Overview
11.9.2 Financial
11.9.3 Products/ Services Offered
11.9.4 SWOT Analysis
11.10 Logitech Inc
11.10.1 Company Overview
11.10.2 Financial
11.10.3 Products/ Services Offered
11.10.4 SWOT Analysis
12. Use Cases and Best Practices
13. Conclusion
An accurate research report requires proper strategizing as well as implementation. There are multiple factors involved in the completion of good and accurate research report and selecting the best methodology to compete the research is the toughest part. Since the research reports we provide play a crucial role in any company’s decision-making process, therefore we at SNS Insider always believe that we should choose the best method which gives us results closer to reality. This allows us to reach at a stage wherein we can provide our clients best and accurate investment to output ratio.
Each report that we prepare takes a timeframe of 350-400 business hours for production. Starting from the selection of titles through a couple of in-depth brain storming session to the final QC process before uploading our titles on our website we dedicate around 350 working hours. The titles are selected based on their current market cap and the foreseen CAGR and growth.
The 5 steps process:
Step 1: Secondary Research:
Secondary Research or Desk Research is as the name suggests is a research process wherein, we collect data through the readily available information. In this process we use various paid and unpaid databases which our team has access to and gather data through the same. This includes examining of listed companies’ annual reports, Journals, SEC filling etc. Apart from this our team has access to various associations across the globe across different industries. Lastly, we have exchange relationships with various university as well as individual libraries.
Step 2: Primary Research
When we talk about primary research, it is a type of study in which the researchers collect relevant data samples directly, rather than relying on previously collected data. This type of research is focused on gaining content specific facts that can be sued to solve specific problems. Since the collected data is fresh and first hand therefore it makes the study more accurate and genuine.
We at SNS Insider have divided Primary Research into 2 parts.
Part 1 wherein we interview the KOLs of major players as well as the upcoming ones across various geographic regions. This allows us to have their view over the market scenario and acts as an important tool to come closer to the accurate market numbers. As many as 45 paid and unpaid primary interviews are taken from both the demand and supply side of the industry to make sure we land at an accurate judgement and analysis of the market.
This step involves the triangulation of data wherein our team analyses the interview transcripts, online survey responses and observation of on filed participants. The below mentioned chart should give a better understanding of the part 1 of the primary interview.
Part 2: In this part of primary research the data collected via secondary research and the part 1 of the primary research is validated with the interviews from individual consultants and subject matter experts.
Consultants are those set of people who have at least 12 years of experience and expertise within the industry whereas Subject Matter Experts are those with at least 15 years of experience behind their back within the same space. The data with the help of two main processes i.e., FGDs (Focused Group Discussions) and IDs (Individual Discussions). This gives us a 3rd party nonbiased primary view of the market scenario making it a more dependable one while collation of the data pointers.
Step 3: Data Bank Validation
Once all the information is collected via primary and secondary sources, we run that information for data validation. At our intelligence centre our research heads track a lot of information related to the market which includes the quarterly reports, the daily stock prices, and other relevant information. Our data bank server gets updated every fortnight and that is how the information which we collected using our primary and secondary information is revalidated in real time.
Step 4: QA/QC Process
After all the data collection and validation our team does a final level of quality check and quality assurance to get rid of any unwanted or undesired mistakes. This might include but not limited to getting rid of the any typos, duplication of numbers or missing of any important information. The people involved in this process include technical content writers, research heads and graphics people. Once this process is completed the title gets uploader on our platform for our clients to read it.
Step 5: Final QC/QA Process:
This is the last process and comes when the client has ordered the study. In this process a final QA/QC is done before the study is emailed to the client. Since we believe in giving our clients a good experience of our research studies, therefore, to make sure that we do not lack at our end in any way humanly possible we do a final round of quality check and then dispatch the study to the client.
By Type
Home Console
Handheld Console
Portable
Non-Portable
By Application
Gaming
Non-Gaming
By End Use
Residential
Commercial
Request for Segment Customization as per your Business Requirement: Segment Customization Request
REGIONAL COVERAGE:
North America
US
Canada
Mexico
Europe
Eastern Europe
Poland
Romania
Hungary
Turkey
Rest of Eastern Europe
Western Europe
Germany
France
UK
Italy
Spain
Netherlands
Switzerland
Austria
Rest of Western Europe
Asia-Pacific
China
India
Japan
South Korea
Vietnam
Singapore
Australia
Rest of Asia Pacific
Middle East & Africa
Middle East
UAE
Egypt
Saudi Arabia
Qatar
Rest of the Middle East
Africa
Nigeria
South Africa
Rest of Africa
Latin America
Brazil
Argentina
Colombia
Rest of Latin America
Request for Country Level Research Report: Country Level Customization Request
Available Customization
With the given market data, SNS Insider offers customization as per the company’s specific needs. The following customization options are available for the report:
Product Analysis
Criss-Cross segment analysis (e.g. Product X Application)
Product Matrix which gives a detailed comparison of the product portfolio of each company
Geographic Analysis
Additional countries in any of the regions
Company Information
Detailed analysis and profiling of additional market players (Up to five)
The Traffic Sensor Market size was valued at USD 627.4 million in 2023 and is expected to grow at a CAGR of 8.5 % from 2024 to 2032, and is projected to reach US$ 1307.4 million by 2032.
The 8K technology market size was valued at USD 12.29 billion in 2023 and is expected to grow to USD 197.70 billion by 2032 and grow at a CAGR Of 36.2 % over the forecast period of 2024-2032.
The Vertical Farming Market Size was valued at USD 5.81 Billion in 2023. It is estimated to grow at a CAGR of 22.42% to reach USD 35.76 Billion by 2032
The Metamaterials Market size was valued at USD 779.6 Million in 2023, and expected to reach USD 3680.9 Million by 2032, growing at a CAGR of 18.82 % during 2024-2032.
The Leak Detection Market Size was valued at USD 4.58 billion in 2023 and is expected to grow at a CAGR of 5.31% to reach USD 7.26 billion by 2032.
The Image Sensor Market size was valued at USD 25.12 billion in 2023 and is expected to grow to USD 50.77 billion by 2032 and grow at a CAGR of 8.13% over the forecast period of 2024-2032
Hi! Click one of our member below to chat on Phone