Get More Information on Game Streaming Market - Request Sample Report
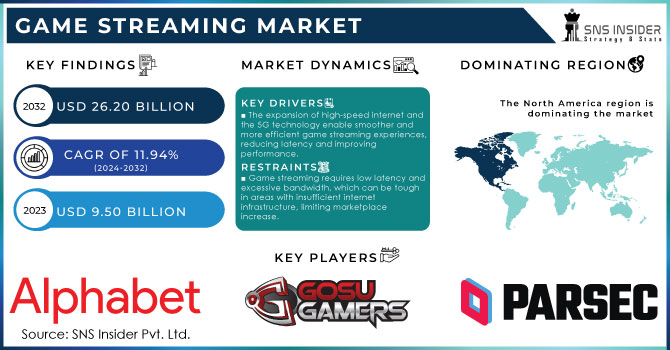
Game Streaming Market size was valued at USD 9.50 Billion in 2023. It is expected to Reach USD 26.20 Billion by 2032 and grow at a CAGR of 11.94% over the forecast period of 2024-2032.
The rise of smartphones and portable devices fuels the mobile gaming industry, prompting game streaming services to adapt. The companies are developing specialized mobile apps for easy access, optimizing streaming technology to reduce latency on mobile networks, and modifying their platforms to enhance mobile gaming. They are also leveraging mobile-specific features like accelerometer inputs and touch controllers to enhance gameplay. Live streaming has increased in popularity, with Twitch at the forefront. Originally focused on gaming, Twitch is now increasing into music, talk shows, and creative content to remain competitive against opponents like Facebook Gaming and YouTube Gaming. Twitch's strong monetization options for streamers reinforce its market position. To enhance user experience, these platforms are incorporating interactive features like chatbots and polls to boost audience engagement. For instance, according to recent data, Twitch remains the dominant platform with over 2.5 million concurrent viewers daily. YouTube Gaming follows with around 1.4 million viewers. This indicates a high engagement rate, reflecting a strong audience base.
Game streaming platforms are diversifying revenue streams beyond traditional subscriptions. They are adopting microtransactions, in-game purchases, and virtual goods sales, allowing users to customize their experiences and support developers. Hybrid models combining free-to-play content with premium subscriptions or ad-supported features cater to a wider audience. Online platforms are also placing importance on accessibility and compatibility across different platforms, allowing players to stream games through web browsers without needing to download applications, thus broadening access to high-quality gaming experiences. For example, the average time users spent watching game streaming platforms rose by 12% in 2023, reaching 2.5 hours per day. This demonstrates an increase in user interaction and consumption of content. In the video game industry, more than 3 billion active gamers globally, more than 50% of gamers globally are male, and they are taking their hobby to the next level by subscribing to at least one gaming service. The rise of esports is another indicator of the popularity of gaming, with the USA its boasting over 3,000 active esports players.
Market Dynamics
Drivers
The expansion of high-speed internet and the 5G technology enable smoother and more efficient game streaming experiences, reducing latency and improving performance.
The increase in the number of gamers and the growing availability of affordable gaming devices and mobile gaming boosts the demand for game streaming.
Continuous improvements in AI, machine learning, and other technologies are enhancing game streaming high-quality and experience, attracting more users.
The increasing high-speed internet deployment and 5G technology drastically drive the game streaming market. Fast internet allows for smooth streaming and seamless gaming experiences by minimizing latency and buffering issues. By 2024, the global average broadband speeds have increased to around 100 Mbps, with certain areas like South Korea and Hong Kong offering speeds over 200 Mbps. This increase in internet velocity directly improves game streaming by decreasing lag and enhancing responsiveness.
5G technology is predicted to similarly revolutionize game streaming. According to the latest study, 5G connections are projected to reach 2.3 billion by 2025, with 5G coverage increasing unexpectedly. The low latency and excessive data transfer rates of 5G, with theoretical speed up to 10 Gbps, offer a large development over preceding generations of mobile networks. This development supports high-definition game streaming and real-time interactions, making cloud gaming greater accessible and exciting. The improved network infrastructure, pushed by way of both high-pace broadband and 5G, as a consequence, plays an important role in improving the fine and attraction of game streaming services, fuelling the market.
Restraints
Game streaming requires low latency and excessive bandwidth, which can be tough in areas with insufficient internet infrastructure, limiting marketplace increase.
Users are regularly worried about the security of their private data and the ability for cyberattacks, that can deter them from adopting recreation streaming services.
Some game streaming services may have a limited selection of games compared to standard gaming platforms, which may reduce their attractiveness to gamers.
High latency and massive bandwidth requirements are great restraints in the game streaming market. Game streaming offerings rely on fast, consistent internet connections to deliver a smooth gaming experience. Based on a report from 2024, online gaming works best with latencies below 40 milliseconds, but some areas experience latencies exceeding 100 milliseconds, leading to gameplay interruptions. Moreover, for optimal performance, high bandwidth is necessary for streaming high-definition games, typically ranging from 20-30 Mbps for 1080p quality and up to 50 Mbps for 4K resolution. In regions with slower internet speeds or unstable connections, users may additionally encounter frequent buffering and quality degradation. The global average speed of broadband is around 100 Mbps, however, it varies drastically by region, with many growing regions lagging. This disparity in internet quality limits the adoption of game streaming services in areas with inadequate infrastructure, restraining overall marketplace growth.
By Solutions
The web-based segment held the largest share of the market in 2023 and accounted for 59.89% of the revenue share. Various online gaming streaming services have adopted subscription-based models, offering a wide game library for a monthly or yearly charge. This method corresponds to what consumers prefer in terms of subscription services, providing gamers with a cost-efficient and convenient option to play different games without buying each game separately. Subscription models offer platform providers and game developers a consistent and lasting source of revenue.
The app-based game streaming segment is also expanding, prompting developers and platform providers to optimize the gaming experience for mobile platforms. This involves making user interfaces intuitive and responsive on smaller screens, integrating tailored input methods such as touch controls and gamepad support, and ensuring smooth performance across various mobile hardware configurations and network conditions. Additionally, optimizing for diverse mobile ecosystems like iOS and Android, each with its unique capabilities and limitations, is critical for delivering a consistent and high-quality gaming experience across different devices. These efforts are essential for meeting the growing demand for mobile game streaming and ensuring a positive user experience.
By Platform Solutions
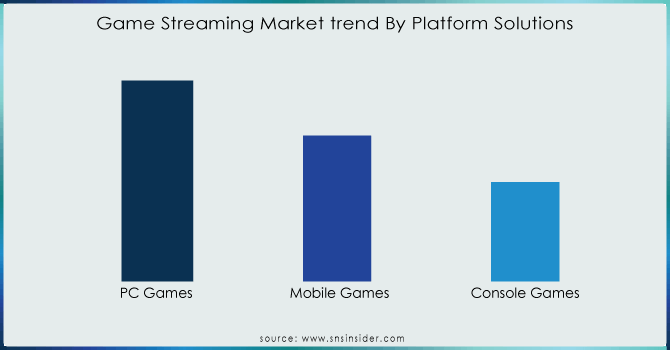
In 2023, the PC games segment led the market with the highest share of revenue 47%. PC gaming is essential to the e-sports scene, providing famous titles like League of Legends, Counterstrike Global Offensive, and Dota 2. Streaming structures allow enthusiasts to look at excessive-degree competitive play, boosting interest and engagement. The e-sports activities industry is significantly growing, with sponsorships, advertising, and merchandise sales reaping rewards for each player and streamer, and also increasing the worldwide profile of PC gaming.
The mobile games segment grew with an annual growth rate of 12.01% during the forecast period, mobile games including PUBG Mobile, Clash Royale, and Free Fire are also making tremendous strides in the e-sports area, attracting more audiences and players. Prize pools within the mobile gaming e-sports atmosphere exceed $5 million. Additionally, mobile game streamers are exploring new strategies such as in-stream ads and viewer donations. Streamers can earn revenue by displaying ads for the duration of their broadcast or receiving tips from their audience, top streamers earning up to $100,000 annually. This trend allows streamers to create sustainable income streams while supplying visitors with ways to aid their preferred content material creators. The developing e-sports scene in both PC and mobile gaming continues to drive market boom and innovation.
Need any customization research on Game Streaming Market - Enquiry Now
Regional analysis
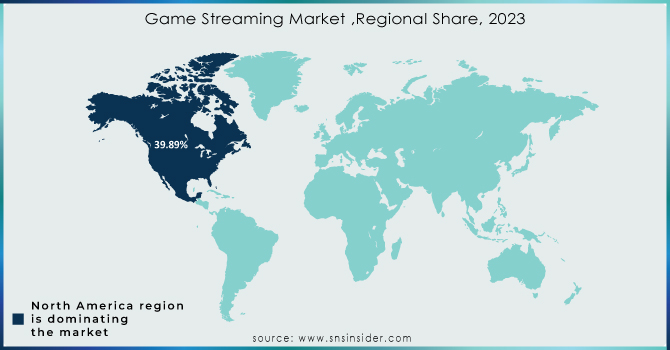
North America region dominated the game streaming market and held larges revenue share of 39.89% in 2023. North American streamers focus on making strong groups by using interacting with visitors in chat, creating Discord servers for discussions, and organizing community events, fostering viewer loyalty and engagement. In the U.S. game streaming market has experienced a tremendous boom due to platforms like Twitch, YouTube Gaming, and Facebook Gaming, which attract millions of visitors and content material creators. Major e-sports events and tournaments are frequently streamed on that platform, driving their growth.
Asia Pacific game streaming market is anticipated to grow with the fastest CAGR of about 12.05% from 2024-2032. This growth is driven by cloud gaming offerings like Google Stadia, which permit users to play high-demand video games without powerful hardware. In China, major platforms like Douyu, Huya, and Bilibili are famous. India’s market is developing due to the increasing adoption of smartphones and the affordable cost of mobile data, with cellular e-sports tournaments gaining recognition. Japan's market remains motivated by traditional gaming culture, with a focus on retro and nostalgia-driven content. In Europe, The UK market is growing with numerous monetization strategies, along with subscriptions and virtual item income. France specializes in accessible gaming experiences through cloud services and device optimization. Germany has come to be a significant e-sports hub, a website hosting fundamental tournaments and attracting huge audiences and investments.
The Major players in the market are Meta Platforms Inc., Parsec Cloud Inc., GosuGamers, Alphabet Inc. (Youtube), Amazon.com Inc., NVIDIA Corp., AfreecaTV Corp., Apple Inc., Genvid Holdings Inc., Huya, Sony Group Corp., others in the final report.
Recent Developments
In January 2024, AfreecaTV announced its plans to launch a beta model of a brand-new live-streaming platform known as SOOP in the first 1/2 of the year. This move demonstrates AfreecaTV's determination to creating a dynamic and inclusive area where customers, streamers, and partners can actively make contributions to the evolution of the live-streaming network.
In August 2023, GeForce NOW launched the Ultimate KovvaK's Challenge, designed to assist gamers improve their aim while presenting a limited-time Steam discount. Utilizing its GPUs and superior software, GeForce NOW enhances customers' gaming experiences by excellent graphics quality. GeForce Experience, one of the offerings, is a gaming software that optimizes PC settings for individual packages, permitting gamers to capture and share their gameplay effects.
Report Attributes | Details |
---|---|
Market Size in 2023 | USD 9.50 Billion |
Market Size by 2032 | USD 26.20 Billion |
CAGR | CAGR of 11.94% From 2024 to 2032 |
Base Year | 2023 |
Forecast Period | 2024-2032 |
Historical Data | 2020-2022 |
Report Scope & Coverage | Market Size, Segments Analysis, Competitive Landscape, Regional Analysis, DROC & SWOT Analysis, Forecast Outlook |
Key Segments | • By Solutions (Web-based, App based) • By Revenue Model (Subscription, Advertisement, Others {Donations, Merchandise, Brand deals and sponsorships}) • By Platform Solutions (PC Games, Mobile Games, Console Games |
Regional Analysis/Coverage | North America (US, Canada, Mexico), Europe (Eastern Europe [Poland, Romania, Hungary, Turkey, Rest of Eastern Europe] Western Europe] Germany, France, UK, Italy, Spain, Netherlands, Switzerland, Austria, Rest of Western Europe]), Asia Pacific (China, India, Japan, South Korea, Vietnam, Singapore, Australia, Rest of Asia Pacific), Middle East & Africa (Middle East [UAE, Egypt, Saudi Arabia, Qatar, Rest of Middle East], Africa [Nigeria, South Africa, Rest of Africa], Latin America (Brazil, Argentina, Colombia, Rest of Latin America) |
Company Profiles | Apple Inc., Practo, Google, Netflix, Inc., Meta Platforms Inc., Parsec Cloud Inc., GosuGamers, Alphabet Inc. (Youtube), Amazon.com Inc., NVIDIA Corp., AfreecaTV Corp., Apple Inc., Genvid Holdings Inc., Huya, Sony Group Corp. |
Key Drivers | • The expansion of high-speed internet and the 5G technology enable smoother and more efficient game streaming experiences, reducing latency and improving performance. • The increase in the number of gamers and the growing availability of affordable gaming devices and mobile gaming boosts the demand for game streaming. |
RESTRAINTS | • Game streaming requires low latency and excessive bandwidth, which can be tough in areas with insufficient internet infrastructure, limiting marketplace increase. |
Ans. The projected market size for the Game Streaming Market is USD 26.20 billion by 2032.
Ans: The North American region dominated the market in 2023, with a 39.89% share.
Ans: The PC platform solution segment dominated the Game Streaming Market.
Ans. The CAGR of the Game Streaming Market is 11.94% During the forecast period of 2024-2032.
Ans: Yes, you can customize the report as per your requirements.
TABLE OF CONTENTS
1. Introduction
1.1 Market Definition
1.2 Scope
1.3 Research Assumptions
2. Industry Flowchart
3. Research Methodology
4. Market Dynamics
4.1 Drivers
4.2 Restraints
4.3 Opportunities
4.4 Challenges
5. Porter’s 5 Forces Model
6. Pest Analysis
7. Game Streaming Market Segmentation, by Solutions
7.1 Introduction
7.2 Web-based
7.3 App based
8. Game Streaming Market Segmentation, by Revenue Model
8.1 Introduction
8.2 Subscription
8.3 Advertisement
8.4 Others (Donations, Merchandise, Brand deals and sponsorships)
9. Game Streaming Market Segmentation, by Platform Solutions
9.1 Introduction
9.2 PC Games
9.3 Mobile Games
9.4 Console Games
10. Regional Analysis
10.1 Introduction
10.2 North America
10.2.1 Trend Analysis
10.2.2 North America Game Streaming Market by Country
10.2.3 North America Game Streaming Market by Solutions
10.2.4 North America Game Streaming Market by Revenue Model
10.2.5 North America Game Streaming Market by Platform Solutions
10.2.6 USA
10.2.6.1 USA Game Streaming Market by Solutions
10.2.6.2 USA Game Streaming Market by Revenue Model
10.2.6.3 USA Game Streaming Market by Platform Solutions
10.2.7 Canada
10.2.7.1 Canada Game Streaming Market by Solutions
10.2.7.2 Canada Game Streaming Market by Revenue Model
10.2.7.3 Canada Game Streaming Market by Platform Solutions
10.2.8 Mexico
10.2.8.1 Mexico Game Streaming Market by Solutions
10.2.8.2 Mexico Game Streaming Market by Revenue Model
10.2.8.3 Mexico Game Streaming Market by Platform Solutions
10.3 Europe
10.3.1 Trend Analysis
10.3.2 Eastern Europe
10.3.2.1 Eastern Europe Game Streaming Market by Country
10.3.2.2 Eastern Europe Game Streaming Market by Solutions
10.3.2.3 Eastern Europe Game Streaming Market by Revenue Model
10.3.2.4 Eastern Europe Game Streaming Market by Platform Solutions
10.3.2.5 Poland
10.3.2.5.1 Poland Game Streaming Market by Solutions
10.3.2.5.2 Poland Game Streaming Market by Revenue Model
10.3.2.5.3 Poland Game Streaming Market by Platform Solutions
10.3.2.6 Romania
10.3.2.6.1 Romania Game Streaming Market by Solutions
10.3.2.6.2 Romania Game Streaming Market by Revenue Model
10.3.2.6.4 Romania Game Streaming Market by Platform Solutions
10.3.2.7 Hungary
10.3.2.7.1 Hungary Game Streaming Market by Solutions
10.3.2.7.2 Hungary Game Streaming Market by Revenue Model
10.3.2.7.3 Hungary Game Streaming Market by Platform Solutions
10.3.2.8 Turkey
10.3.2.8.1 Turkey Game Streaming Market by Solutions
10.3.2.8.2 Turkey Game Streaming Market by Revenue Model
10.3.2.8.3 Turkey Game Streaming Market by Platform Solutions
10.3.2.9 Rest of Eastern Europe
10.3.2.9.1 Rest of Eastern Europe Game Streaming Market by Solutions
10.3.2.9.2 Rest of Eastern Europe Game Streaming Market by Revenue Model
10.3.2.9.3 Rest of Eastern Europe Game Streaming Market by Platform Solutions
10.3.3 Western Europe
10.3.3.1 Western Europe Game Streaming Market by Country
10.3.3.2 Western Europe Game Streaming Market by Solutions
10.3.3.3 Western Europe Game Streaming Market by Revenue Model
10.3.3.4 Western Europe Game Streaming Market by Platform Solutions
10.3.3.5 Germany
10.3.3.5.1 Germany Game Streaming Market by Solutions
10.3.3.5.2 Germany Game Streaming Market by Revenue Model
10.3.3.5.3 Germany Game Streaming Market by Platform Solutions
10.3.3.6 France
10.3.3.6.1 France Game Streaming Market by Solutions
10.3.3.6.2 France Game Streaming Market by Revenue Model
10.3.3.6.3 France Game Streaming Market by Platform Solutions
10.3.3.7 UK
10.3.3.7.1 UK Game Streaming Market by Solutions
10.3.3.7.2 UK Game Streaming Market by Revenue Model
10.3.3.7.3 UK Game Streaming Market by Platform Solutions
10.3.3.8 Italy
10.3.3.8.1 Italy Game Streaming Market by Solutions
10.3.3.8.2 Italy Game Streaming Market by Revenue Model
10.3.3.8.3 Italy Game Streaming Market by Platform Solutions
10.3.3.9 Spain
10.3.3.9.1 Spain Game Streaming Market by Solutions
10.3.3.9.2 Spain Game Streaming Market by Revenue Model
10.3.3.9.3 Spain Game Streaming Market by Platform Solutions
10.3.3.10 Netherlands
10.3.3.10.1 Netherlands Game Streaming Market by Solutions
10.3.3.10.2 Netherlands Game Streaming Market by Revenue Model
10.3.3.10.3 Netherlands Game Streaming Market by Platform Solutions
10.3.3.11 Switzerland
10.3.3.11.1 Switzerland Game Streaming Market by Solutions
10.3.3.11.2 Switzerland Game Streaming Market by Revenue Model
10.3.3.11.3 Switzerland Game Streaming Market by Platform Solutions
10.3.3.12 Austria
10.3.3.12.1 Austria Game Streaming Market by Solutions
10.3.3.12.2 Austria Game Streaming Market by Revenue Model
10.3.3.12.3 Austria Game Streaming Market by Platform Solutions
10.3.3.13 Rest of Western Europe
10.3.3.13.1 Rest of Western Europe Game Streaming Market by Solutions
10.3.3.13.2 Rest of Western Europe Game Streaming Market by Revenue Model
10.3.3.13.3 Rest of Western Europe Game Streaming Market by Platform Solutions
10.4 Asia-Pacific
10.4.1 Trend Analysis
10.4.2 Asia-Pacific Game Streaming Market by Country
10.4.3 Asia-Pacific Game Streaming Market by Solutions
10.4.4 Asia-Pacific Game Streaming Market by Revenue Model
10.4.5 Asia-Pacific Game Streaming Market by Platform Solutions
10.4.6 China
10.4.6.1 China Game Streaming Market by Solutions
10.4.6.2 China Game Streaming Market by Revenue Model
10.4.6.3 China Game Streaming Market by Platform Solutions
10.4.7 India
10.4.7.1 India Game Streaming Market by Solutions
10.4.7.2 India Game Streaming Market by Revenue Model
10.4.7.3 India Game Streaming Market by Platform Solutions
10.4.8 Japan
10.4.8.1 Japan Game Streaming Market by Solutions
10.4.8.2 Japan Game Streaming Market by Revenue Model
10.4.8.3 Japan Game Streaming Market by Platform Solutions
10.4.9 South Korea
10.4.9.1 South Korea Game Streaming Market by Solutions
10.4.9.2 South Korea Game Streaming Market by Revenue Model
10.4.9.3 South Korea Game Streaming Market by Platform Solutions
10.4.10 Vietnam
10.4.10.1 Vietnam Game Streaming Market by Solutions
10.4.10.2 Vietnam Game Streaming Market by Revenue Model
10.4.10.3 Vietnam Game Streaming Market by Platform Solutions
10.4.11 Singapore
10.4.11.1 Singapore Game Streaming Market by Solutions
10.4.11.2 Singapore Game Streaming Market by Revenue Model
10.4.11.3 Singapore Game Streaming Market by Platform Solutions
10.4.12 Australia
10.4.12.1 Australia Game Streaming Market by Solutions
10.4.12.2 Australia Game Streaming Market by Revenue Model
10.4.12.3 Australia Game Streaming Market by Platform Solutions
10.4.13 Rest of Asia-Pacific
10.4.13.1 Rest of Asia-Pacific Game Streaming Market by Solutions
10.4.13.2 Rest of Asia-Pacific Game Streaming Market by Revenue Model
10.4.13.3 Rest of Asia-Pacific Game Streaming Market by Platform Solutions
10.5 Middle East & Africa
10.5.1 Trend Analysis
10.5.2 Middle East
10.5.2.1 Middle East Game Streaming Market by Country
10.5.2.2 Middle East Game Streaming Market by Solutions
10.5.2.3 Middle East Game Streaming Market by Revenue Model
10.5.2.4 Middle East Game Streaming Market by Platform Solutions
10.5.2.5 UAE
10.5.2.5.1 UAE Game Streaming Market by Solutions
10.5.2.5.2 UAE Game Streaming Market by Revenue Model
10.5.2.5.3 UAE Game Streaming Market by Platform Solutions
10.5.2.6 Egypt
10.5.2.6.1 Egypt Game Streaming Market by Solutions
10.5.2.6.2 Egypt Game Streaming Market by Revenue Model
10.5.2.6.3 Egypt Game Streaming Market by Platform Solutions
10.5.2.7 Saudi Arabia
10.5.2.7.1 Saudi Arabia Game Streaming Market by Solutions
10.5.2.7.2 Saudi Arabia Game Streaming Market by Revenue Model
10.5.2.7.3 Saudi Arabia Game Streaming Market by Platform Solutions
10.5.2.8 Qatar
10.5.2.8.1 Qatar Game Streaming Market by Solutions
10.5.2.8.2 Qatar Game Streaming Market by Revenue Model
10.5.2.8.3 Qatar Game Streaming Market by Platform Solutions
10.5.2.9 Rest of Middle East
10.5.2.9.1 Rest of Middle East Game Streaming Market by Solutions
10.5.2.9.2 Rest of Middle East Game Streaming Market by Revenue Model
10.5.2.9.3 Rest of Middle East Game Streaming Market by Platform Solutions
10.5.3 Africa
10.5.3.1 Africa Game Streaming Market by Country
10.5.3.2 Africa Game Streaming Market by Solutions
10.5.3.3 Africa Game Streaming Market by Revenue Model
10.5.3.4 Africa Game Streaming Market by Platform Solutions
10.5.3.5 Nigeria
10.5.3.5.1 Nigeria Game Streaming Market by Solutions
10.5.3.5.2 Nigeria Game Streaming Market by Revenue Model
10.5.3.5.3 Nigeria Game Streaming Market by Platform Solutions
10.5.3.6 South Africa
10.5.3.6.1 South Africa Game Streaming Market by Solutions
10.5.3.6.2 South Africa Game Streaming Market by Revenue Model
10.5.3.6.3 South Africa Game Streaming Market by Platform Solutions
10.5.3.7 Rest of Africa
10.5.3.7.1 Rest of Africa Game Streaming Market by Solutions
10.5.3.7.2 Rest of Africa Game Streaming Market by Revenue Model
10.5.3.7.3 Rest of Africa Game Streaming Market by Platform Solutions
10.6 Latin America
10.6.1 Trend Analysis
10.6.2 Latin America Game Streaming Market by country
10.6.3 Latin America Game Streaming Market by Solutions
10.6.4 Latin America Game Streaming Market by Revenue Model
10.6.5 Latin America Game Streaming Market by Platform Solutions
10.6.6 Brazil
10.6.6.1 Brazil Game Streaming Market by Solutions
10.6.6.2 Brazil Game Streaming Market by Revenue Model
10.6.6.3 Brazil Game Streaming Market by Platform Solutions
10.6.7 Argentina
10.6.7.1 Argentina Game Streaming Market by Solutions
10.6.7.2 Argentina Game Streaming Market by Revenue Model
10.6.7.3 Argentina Game Streaming Market by Platform Solutions
10.6.8 Colombia
10.6.8.1 Colombia Game Streaming Market by Solutions
10.6.8.2 Colombia Game Streaming Market by Revenue Model
10.6.8.3 Colombia Game Streaming Market by Platform Solutions
10.6.9 Rest of Latin America
10.6.9.1 Rest of Latin America Game Streaming Market by Solutions
10.6.9.2 Rest of Latin America Game Streaming Market by Revenue Model
10.6.9.3 Rest of Latin America Game Streaming Market by Platform Solutions
11. Company Profiles
11.1 Meta Platforms Inc.
11.1.1 Company Overview
11.1.2 Financial
11.1.3 Products/ Services Offered
11.1.4 The SNS View
11.2 Parsec Cloud Inc.
11.2.1 Company Overview
11.2.2 Financial
11.2.3 Products/ Services Offered
11.2.4 The SNS View
11.3 GosuGamers
11.3.1 Company Overview
11.3.2 Financial
11.3.3 Products/ Services Offered
11.3.4 The SNS View
11.4 Alphabet Inc. (Youtube)
11.4.1 Company Overview
11.4.2 Financial
11.4.3 Products/ Services Offered
11.4.4 The SNS View
11.5 Amazon.com Inc.
11.5.1 Company Overview
11.5.2 Financial
11.5.3 Products/ Services Offered
11.5.4 The SNS View
11.6 NVIDIA Corp.
11.6.1 Company Overview
11.6.2 Financial
11.6.3 Products/ Services Offered
11.6.4 The SNS View
11.7 AfreecaTV Corp.
11.7.1 Company Overview
11.7.2 Financial
11.7.3 Products/ Services Offered
11.7.4 The SNS View
11.8 Apple Inc.
11.8.1 Company Overview
11.8.2 Financial
11.8.3 Products/ Services Offered
11.8.4 The SNS View
11.9 Genvid Holdings Inc.
11.9.1 Company Overview
11.9.2 Financial
11.9.3 Products/ Services Offered
11.9.4 The SNS View
11.10 Sony Group Corp.
11.10.1 Company Overview
11.10.2 Financial
11.10.3 Products/ Services Offered
11.10.4 The SNS View
12. Competitive Landscape
12.1 Competitive Benchmarking
12.2 Market Share Analysis
12.3 Recent Developments
12.3.1 Industry News
12.3.2 Company News
12.3.3 Mergers & Acquisitions
13. Use Case and Best Practices
14. Conclusion
An accurate research report requires proper strategizing as well as implementation. There are multiple factors involved in the completion of good and accurate research report and selecting the best methodology to compete the research is the toughest part. Since the research reports we provide play a crucial role in any company’s decision-making process, therefore we at SNS Insider always believe that we should choose the best method which gives us results closer to reality. This allows us to reach at a stage wherein we can provide our clients best and accurate investment to output ratio.
Each report that we prepare takes a timeframe of 350-400 business hours for production. Starting from the selection of titles through a couple of in-depth brain storming session to the final QC process before uploading our titles on our website we dedicate around 350 working hours. The titles are selected based on their current market cap and the foreseen CAGR and growth.
The 5 steps process:
Step 1: Secondary Research:
Secondary Research or Desk Research is as the name suggests is a research process wherein, we collect data through the readily available information. In this process we use various paid and unpaid databases which our team has access to and gather data through the same. This includes examining of listed companies’ annual reports, Journals, SEC filling etc. Apart from this our team has access to various associations across the globe across different industries. Lastly, we have exchange relationships with various university as well as individual libraries.
Step 2: Primary Research
When we talk about primary research, it is a type of study in which the researchers collect relevant data samples directly, rather than relying on previously collected data. This type of research is focused on gaining content specific facts that can be sued to solve specific problems. Since the collected data is fresh and first hand therefore it makes the study more accurate and genuine.
We at SNS Insider have divided Primary Research into 2 parts.
Part 1 wherein we interview the KOLs of major players as well as the upcoming ones across various geographic regions. This allows us to have their view over the market scenario and acts as an important tool to come closer to the accurate market numbers. As many as 45 paid and unpaid primary interviews are taken from both the demand and supply side of the industry to make sure we land at an accurate judgement and analysis of the market.
This step involves the triangulation of data wherein our team analyses the interview transcripts, online survey responses and observation of on filed participants. The below mentioned chart should give a better understanding of the part 1 of the primary interview.
Part 2: In this part of primary research the data collected via secondary research and the part 1 of the primary research is validated with the interviews from individual consultants and subject matter experts.
Consultants are those set of people who have at least 12 years of experience and expertise within the industry whereas Subject Matter Experts are those with at least 15 years of experience behind their back within the same space. The data with the help of two main processes i.e., FGDs (Focused Group Discussions) and IDs (Individual Discussions). This gives us a 3rd party nonbiased primary view of the market scenario making it a more dependable one while collation of the data pointers.
Step 3: Data Bank Validation
Once all the information is collected via primary and secondary sources, we run that information for data validation. At our intelligence centre our research heads track a lot of information related to the market which includes the quarterly reports, the daily stock prices, and other relevant information. Our data bank server gets updated every fortnight and that is how the information which we collected using our primary and secondary information is revalidated in real time.
Step 4: QA/QC Process
After all the data collection and validation our team does a final level of quality check and quality assurance to get rid of any unwanted or undesired mistakes. This might include but not limited to getting rid of the any typos, duplication of numbers or missing of any important information. The people involved in this process include technical content writers, research heads and graphics people. Once this process is completed the title gets uploader on our platform for our clients to read it.
Step 5: Final QC/QA Process:
This is the last process and comes when the client has ordered the study. In this process a final QA/QC is done before the study is emailed to the client. Since we believe in giving our clients a good experience of our research studies, therefore, to make sure that we do not lack at our end in any way humanly possible we do a final round of quality check and then dispatch the study to the client.
Key Segments:
By Solutions
Web based
App based
By Revenue Model
Subscription
Advertisement
Others (Donations, Merchandise, Brand deals and sponsorships)
By Platform Solutions
PC Games
Mobile Games
Console Games
Request for Segment Customization as per your Business Requirement: Segment Customization Request
Regional Coverage:
North America
US
Canada
Mexico
Europe
Eastern Europe
Poland
Romania
Hungary
Turkey
Rest of Eastern Europe
Western Europe
Germany
France
UK
Italy
Spain
Netherlands
Switzerland
Austria
Rest of Western Europe
Asia Pacific
China
India
Japan
South Korea
Vietnam
Singapore
Australia
Rest of Asia Pacific
Middle East & Africa
Middle East
UAE
Egypt
Saudi Arabia
Qatar
Rest of the Middle East
Africa
Nigeria
South Africa
Rest of Africa
Latin America
Brazil
Argentina
Colombia
Rest of Latin America
Request for Country Level Research Report: Country Level Customization Request
Available Customization
With the given market data, SNS Insider offers customization as per the company’s specific needs. The following customization options are available for the report:
Product Analysis
Criss-Cross segment analysis (e.g. Product X Application)
Product Matrix which gives a detailed comparison of product portfolio of each company
Geographic Analysis
Additional countries in any of the regions
Company Information
Detailed analysis and profiling of additional market players (Up to five)
The Tokenization Market size was valued at USD 2.9 billion in 2023 & is expected to grow to USD 16.6 billion by 2032 & grow at a CAGR of 21.5 % by 2032.
The Decentralized Finance (DeFi) Market Size was valued at USD 17.1 Billion in 2023 and is expected to reach USD 531.5 Billion by 2032, growing at a CAGR of 46.5% over the forecast period 2024-2032.
The global online trading platform market, valued at USD 9.58 Billion in 2023, is projected to reach USD 18.80 Billion by 2032, growing at a compound annual growth rate (CAGR) of 8.18% during the forecast period.
Certificate Authority Market size was valued at USD 167.7 Million in 2023 and will grow to USD 442.2 Million by 2032 and grow at a CAGR of 11.4% by 2032.
Network Attached Storage Market was worth USD 31.71 billion in 2023 and is predicted to be worth USD 109.72 billion by 2032, growing at a CAGR of 14.82% between 2024 and 2032.
Accounts Receivable Automation Market was valued at USD 3.5 billion in 2023 and is expected to reach USD 10.5 billion by 2032 and grow at a CAGR of 13.1% from 2024- 2032.
Hi! Click one of our member below to chat on Phone