image

Fusion Splicer Market Report Scope & Overview:

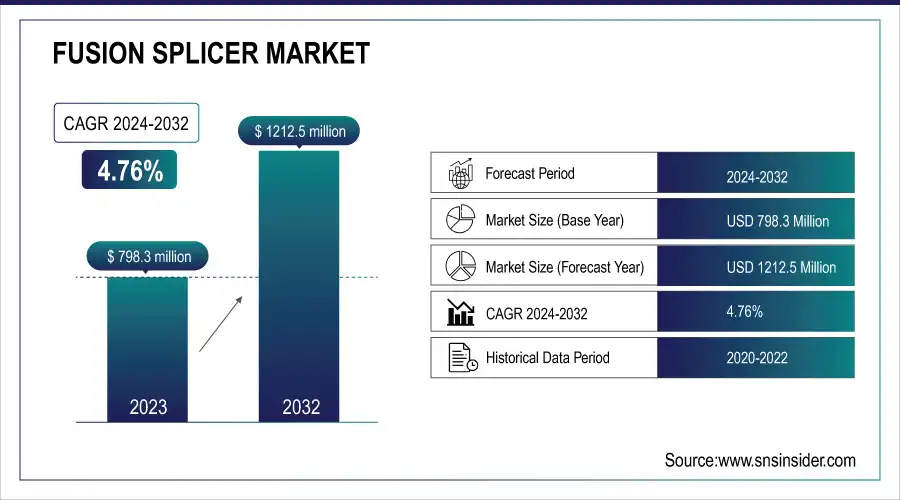
The Fusion Splicer Market was valued at USD 798.3 Million in 2023 and is projected to reach USD 1212.5 Million by 2032, growing at a CAGR of 4.76% from 2024 to 2032. A key driver for this growth is the rapid adoption of 5G networks, which is accelerating the demand for fiber optic infrastructure, boosting the need for fusion splicing technology. In addition, sustainability trends are driving the development of eco-friendly splicing solutions, emphasizing energy efficiency and the use of recyclable materials. Cost-efficiency is another important factor, with advancements in fusion splicing technology leading to lower operational costs and greater affordability for businesses. Furthermore, the demand for skilled professionals in fusion splicing is rising as the workforce adapts to the growing complexity of fiber optic installations. 
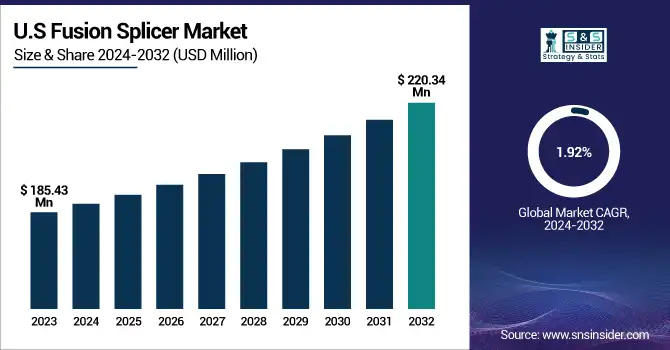
In the U.S., the market was valued at USD 185.43 million in 2023 and is expected to reach USD 220.34 million by 2032, growing at a CAGR of 1.92%. These trends reflect a strong and steady demand for fusion splicing solutions across industries, driven by technological advancements, infrastructure growth, and workforce development.

Fusion Splicer Market Dynamics:

Drivers:

  • Expansion of Fiber Optic Networks and Advancements in Splicing Technology Driving Fusion Splicer Market Growth

The fusion splicer market is expanding due to increased government funding for fiber optic networks, especially in developing regions, which has fueled the demand for high-speed broadband and telecommunication services. The rise in fiber-to-the-home (FTTH) deployments has further supported this growth, providing more opportunities for the widespread use of fusion splicers. The telecommunication sector plays a major role in advancing fiber optic technologies, while a shift from mechanical splicing to fusion splicing has accelerated the market's development. Despite challenges like high equipment costs and the need for a continuous power supply, these obstacles present opportunities for new market players to introduce competitively-priced products. Additionally, the growing demand for minimal splice loss, especially in the cable TV industry, has led to innovations in core alignment splicers to meet industry standards.

Restraints:

  • Impact of Maintenance and Calibration Costs on Fusion Splicer Market Adoption

Maintenance and calibration costs are significant restraints for the fusion splicer market. Fusion splicing equipment requires regular maintenance to ensure optimal performance and extend its lifespan. Over time, components such as electrodes, fiber holders, and other parts may wear out or lose precision, requiring replacement or adjustment. Additionally, the calibration of the splicer is crucial to maintain splice quality and minimize losses, which requires periodic checks by skilled professionals. These recurring costs can add up over time and increase the overall cost of ownership for business, and especially small business with limited budgets. This can be a potential deterrent for some users from employing fusion splicing technology, especially in those regions with limited financial resources, as companies have to include a budget for maintenance and calibration.

Opportunities:

  • Expansion of Telecommunications Infrastructure Increasing Demand for Fusion Splicing Technology

The continued global expansion of telecommunications networks, particularly in emerging markets, presents a significant opportunity for the fusion splicer market. As countries invest in modernizing and expanding their telecom infrastructures, the demand for fiber optic networks and high-speed connectivity is growing. In these regions, the deployment of fiber optics is essential to support advancements in mobile networks, broadband services, and 5G rollout. As this expansion continues to accelerate, efficient and effective fusion splicing technology will be critical in guaranteeing maximum network performance across a minimum of signal loss. The growing adoption of fiber optics for building strong and scalable infrastructure is also driving up demand for fusion splicing equipment, as telecommunications companies upgrade their networks to meet market demands for better capabilities. The rapid development of smart technologies in emerging markets, either the update of telecom infrastructure or building from scratch, is creating a potential customer base for fusion splicing technology.

Challenges:

  • Dependency on Stable Power Supply Challenges Fusion Splicer Adoption in Remote Areas.

Fusion splicers rely on a stable power supply to function effectively, making them less suitable for areas with unreliable or inconsistent electricity infrastructure. In remote or underdeveloped regions, where power outages or fluctuations are common, this dependency becomes a significant challenge. Users in these areas may experience operational delays or equipment malfunction, reducing the overall efficiency of fiber optic installation and maintenance projects. The need for a continuous power source can also drive up costs for users who must invest in backup power solutions, such as generators or uninterruptible power supplies (UPS). This limitation can deter potential customers in regions where the power grid is not reliable, affecting the market penetration of fusion splicing technology in these areas.

Fusion Splicer Market Segment Analysis:

By Offering

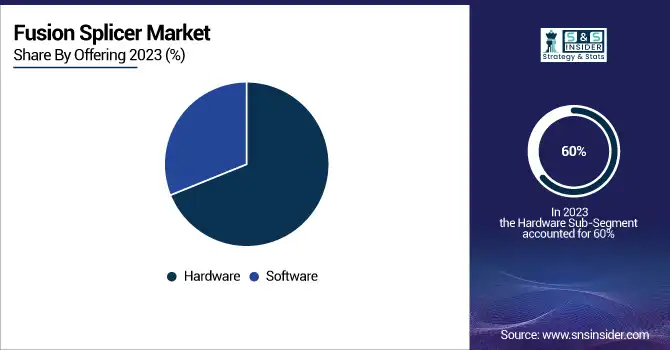
The hardware segment holds the largest share in the fusion splicer market, accounting for approximately 60% of the total market in 2023. This dominance is driven by the continued demand for high-performance fusion splicing machines that are essential for fiber optic network installation and maintenance. Hardware, which includes the actual splicing equipment and related components such as electrodes, fiber holders, and splicing machines, forms the backbone of the industry. These machines are designed for precision and reliability, ensuring minimal splice loss and high-speed connectivity, which are crucial for the expanding telecommunications and broadband infrastructure. As the need for fiber optic networks grows, especially with the rise of 5G and FTTH deployments, the demand for advanced hardware solutions in the fusion splicer market is expected to remain robust, sustaining its dominant position throughout the forecast period.

The software segment in the fusion splicer market is expected to experience significant growth over the period from 2024 to 2032. Growth in the market persists as fusion splicing equipment is incorporating more software solutions to provide improved performance, efficiency, and automation. More sophisticated software functions that include real-time monitoring, error detection, splice loss analysis, and data management are also rapidly becoming the norm if the splicing process is to be optimized. Advancement of fusion splicing technology, as well as the application of software ensures that operation is easier, precision is optimized and integration with other network systems is seamless. The growing need for smart and automated solutions in telecom and broadband network deployments is driving the adoption of software-driven fusion splicers, which will help drive the segment’s robust growth during the forecast period.

By Alignment Type

The core alignment segment dominated the fusion splicer market with a substantial share of approximately 69% in 2023. This dominance is primarily due to the superior precision and minimal splice loss offered by core alignment splicers, making them the preferred choice for high-performance applications. Core alignment technology ensures that the fiber cores are precisely aligned, which is crucial for achieving low splice loss, especially in demanding industries such as telecommunications and cable TV. These splicers are essential for applications requiring high-quality connections and are widely used in the installation and maintenance of fiber optic networks. As the demand for reliable, high-speed fiber optic communication continues to grow, particularly with the expansion of 5G networks and FTTH deployments, the core alignment segment is expected to maintain its dominant position in the market.

The cladding alignment segment is expected to experience the fastest revenue growth from 2024 to 2032 in the fusion splicer market. This growth is being fueled by the rising need for affordable solutions in less intricate splicing tasks, whereby ultra-low splice loss is not as important. Cladding alignment splicers thus align the cladding of the fiber and are the more cost-effective solution in comparison to core alignment splicers. They are QUITE popular in applications NOT needing the precision required by high-bandwidth telecommunication networks. Cladding alignment splicers, which are viewed in many circles as more efficient and lower cost splicing options, are seeing their adoption numbers rise with the expansion of fiber optic networks, especially inizing markets, as they become the splicer of choice in designs where prices are less available. This will augur well for segment which is projected to witness strong market growth during the coming years.

By Application

The Telecommunications segment dominated the fusion splicer market, accounting for around 41% of the total revenue in 2023. This predominance is fueled by the rising need for high-speed internet and the proliferation of fiber optic infrastructure worldwide, particularly with 5G technology and fiber-to-the-home (FTTH) rollouts. Fusion splicing is essential to the proper operation of these networks, providing low-loss, high-performance fiber joints. Telecom companies are rapidly investing billions of dollars in expanding bulk fiber optic infrastructure to meet growing bandwidth requirements of different consumers and businesses, which will bolster the demand for fusion splicing in telecommunications industry over the forecast period.

The Cable TV and Enterprise segments are expected to experience significant growth over the period from 2024 to 2032 in the fusion splicer market. This growth is fueled by the contemporary demand for superior, dependable fiber optic connections to facilitate the development of cable TV networks and business-grade communications. With the increasing number of high-definition and ultra-high-definition content available at Cable TV, it has become more urgent to develop low-loss splicing technology. Likewise, when it comes to enterprises, they make use of fiber networks for improved communication, speed, reliable data transfer and various, additional benefits. Core alignment splicing through fusion splicing, in particular, is critical when it comes to maintaining high-quality connections in these industries. Cable TV and enterprise networking are also adopting fibre optics at a increasingly high rate, fuelling these segments with strong demand for fusion splicing solutions over Forecast period.

Fusion Splicer Market Regional Analysis:

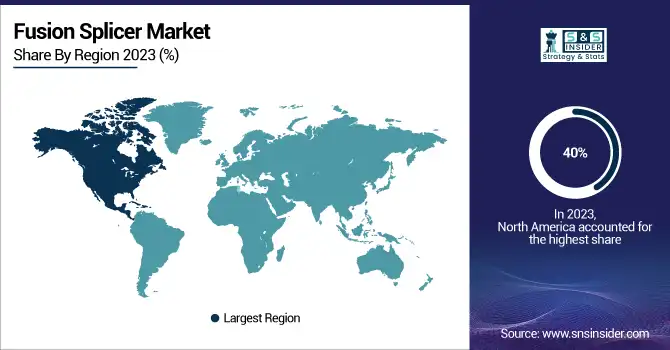
North America dominated the fusion splicer market with a share of around 40% in 2023. This leadership is attributed to the region's advanced telecommunication infrastructure and the rapid adoption of fiber optic networks, particularly with the expansion of 5G and fiber-to-the-home (FTTH) services. The strong demand for high-speed internet and reliable connectivity across industries, coupled with significant investments in telecom and broadband sectors, fuels the growth of fusion splicing solutions. Additionally, North America's technological advancements and established market players contribute to its dominant position in the market. As the region continues to lead in the development of cutting-edge fiber optic networks, the demand for fusion splicers is expected to remain robust throughout the forecast period.

The Asia-Pacific region is projected to be the fastest-growing market for fusion splicers from 2024 to 2032. This growth is driven by increasing telecommunications infrastructure in developing regions like China, India, and Southeast Asia. As the demand for high-speed internet continues to rise, alongside the rollout of 5G networks and the increasing deployment of fiber-to-the-home (FTTH) connections, the importance of effective fusion splicing technology is also being recognized. Market growth is attributed to end-user investments in telecom and broadband services in the region and the increasing adoption of fiber optics to meet consumer demand for reliable connectivity. The growth will keep on over the few years due to the emerging opportunities in the fusion splicer market as the digital infrastructure expands across Asia-Pacific region.

Fusion Splicer Market Key Players:

Some of the Major Players in Fusion Splicer Market along with their Products:

  • Fujikura (Japan) – Fusion splicers, optical fiber cables, test equipment.

  • Sumitomo Electric (Japan) – Fusion splicers, fiber optic components, cables.

  • Tektronix (USA) – Optical test and measurement equipment, fusion splicer testing tools.

  • Huawei (China) – Optical fiber equipment, fusion splicers, networking hardware.

  • Fiberhome (China) – Optical fiber solutions, fusion splicers, network equipment.

  • Ribbon Communications (USA) – Telecom equipment, fiber optic networking solutions.

  • Corning (USA) – Optical fiber, fusion splicers, telecommunications equipment.

  • Yokogawa Electric (Japan) – Test equipment for fiber optics, splicing tools.

  • Optotec (Italy) – Optical splicing solutions, fiber optic components.

  • Nokia (Finland) – Telecommunications hardware, fusion splicers, networking solutions.

  • Nexans (France) – Fiber optic cables, splicing tools, networking infrastructure.

  • 3M (USA) – Optical fiber splice closures, fiber optic tools, adhesives.

  • Northrop Grumman (USA) – Fiber optic technology for defense applications, splicing equipment.

  • INNO Instrument (South Korea) – Core alignment fusion splicers, OTDRs, optical fiber testing equipment.

  • Furukawa Electric Co. Ltd. (Japan) – Fiber optic cables, fusion splicers, splicing tools.

  • Fiberfox (China) – Fusion splicers, testing equipment, fiber optic tools.

  • Comway Technology LLC (USA) – Fusion splicing solutions, telecom tools.

  • Multicom Inc. (USA) – Fiber optic splicing tools, cables, connectors.

  • Emerson Electric Co. (USA) – Fusion splicing equipment, fiber optic testing tools.

  • China Electronic Technology Instruments Co. Ltd. (China) – Fusion splicing and test equipment for optical fibers.

List of suppliers for raw materials and components for the Fusion Splicer Market:

  • Corning Inc.

  • Fujikura Ltd.

  • Sumitomo Electric Industries Ltd.

  • The Prysmian Group

  • Nexans

  • 3M

  • Emerson Electric Co.

  • Rohde & Schwarz

  • Yokogawa Electric Corporation

  • Fiberhome

  • OFS Fitel

  • Inno Instrument

  • TE Connectivity

  • Broadcom

  • Amphenol

Recent Development:

  • 01 Aug 2024 , Fujikura 45S Fusion Splicer – Pioneering Precision, Efficiency in Fibre-Optic Technology, IC Logistix proudly announces the launch of the Fujikura 45S Fusion Splicer, designed to revolutionize fibre-optic splicing with faster heating, simultaneous fibre preparation, and advanced AI-powered management for increased operational efficiency.

  • 01, Jun 2024, Huawei introduces ODN 3.0, leveraging uneven optical splitters and pre-connection technologies to enhance fiber network coverage, reduce costs, and improve efficiency for FTTH deployments, revolutionizing optical distribution networks.

Fusion Splicer Market Report Scope:

Report Attributes Details
Market Size in 2023 USD 798.3 Billion 
Market Size by 2032 USD 1212.5 Billion 
CAGR CAGR of 4.76% From 2024 to 2032
Base Year 2023
Forecast Period 2024-2032
Historical Data 2020-2022
Report Scope & Coverage Market Size, Segments Analysis, Competitive  Landscape, Regional Analysis, DROC & SWOT Analysis, Forecast Outlook
Key Segments • By Offering (Hardware, Software & Services)
• By Alignment Type (Core Alignment, Cladding Alignment)
• By Application (Telecommunication, Cable TV, Enterprise, Aerospace & Defense, Specialty)
Regional Analysis/Coverage North America (US, Canada, Mexico), Europe (Eastern Europe [Poland, Romania, Hungary, Turkey, Rest of Eastern Europe] Western Europe] Germany, France, UK, Italy, Spain, Netherlands, Switzerland, Austria, Rest of Western Europe]), Asia-Pacific (China, India, Japan, South Korea, Vietnam, Singapore, Australia, Rest of Asia-Pacific), Middle East & Africa (Middle East [UAE, Egypt, Saudi Arabia, Qatar, Rest of Middle East], Africa [Nigeria, South Africa, Rest of Africa], Latin America (Brazil, Argentina, Colombia, Rest of Latin America)
Company Profiles Fujikura (Japan), Sumitomo Electric (Japan), Tektronix (USA), Huawei (China), Fiberhome (China), Ribbon Communications (USA), Corning (USA), Yokogawa Electric (Japan), Optotec (Italy), Nokia (Finland), Nexans (France), 3M (USA), Northrop Grumman (USA), INNO Instrument (South Korea), Furukawa Electric Co. Ltd. (Japan), Fiberfox (China), Comway Technology LLC (USA), Multicom Inc. (USA), Emerson Electric Co. (USA), China Electronic Technology Instruments Co. Ltd. (China).

Frequently Asked Questions

Ans:  The Fusion Splicer Market is expected to grow at a CAGR of 4.76% during 2024-2032.

Ans: The Fusion Splicer was USD 798.3 Million in 2023 and is expected to Reach USD 1212.5 Million by 2032.

Ans: Growing demand for high-speed internet, advancements in telecommunication infrastructure, and the expansion of fiber optic networks.

Ans: The “Hardware” segment dominated the Fusion Splicer Market.

Ans: North America dominated the Fusion Splicer in 2023.

Table of Content

1. Introduction

1.1 Market Definition

1.2 Scope (Inclusion and Exclusions)

1.3 Research Assumptions

2. Executive Summary

2.1 Market Overview

2.2 Regional Synopsis

2.3 Competitive Summary

3. Research Methodology

3.1 Top-Down Approach

3.2 Bottom-up Approach

3.3. Data Validation

3.4 Primary Interviews

4. Market Dynamics Impact Analysis

4.1 Market Driving Factors Analysis

4.1.1 Drivers

4.1.2 Restraints

4.1.3 Opportunities

4.1.4 Challenges

4.2 PESTLE Analysis

4.3 Porter’s Five Forces Model

5. Statistical Insights and Trends Reporting

5.1 Adoption of 5G Networks

5.2 Sustainability Trends

5.3 Cost-Efficiency Metrics

5.4 Skillset and Workforce Demand:

6. Competitive Landscape

6.1 List of Major Companies, By Region

6.2 Market Share Analysis, By Region

6.3 Product Benchmarking

6.3.1 Product specifications and features

6.3.2 Pricing

6.4 Strategic Initiatives

6.4.1 Marketing and promotional activities

6.4.2 Distribution and supply chain strategies

6.4.3 Expansion plans and new product launches

6.4.4 Strategic partnerships and collaborations

6.5 Technological Advancements

6.6 Market Positioning and Branding

7. Fusion Splicer Market Segmentation, by Type

7.1 Chapter Overview

7.2 Hardware

7.2.1 Hardware Market Trends Analysis (2020-2032)

7.2.2 Hardware Market Size Estimates and Forecasts to 2032 (USD Million)

7.3 Software & Services

7.3.1 Software & Services Market Trends Analysis (2020-2032)

7.3.2 Software & Services Market Size Estimates and Forecasts to 2032 (USD Million)

8. Fusion Splicer Market Segmentation, by Alignment Type

8.1 Chapter Overview

8.2 Core Alignment

8.2.1 Core Alignment Market Trends Analysis (2020-2032)

8.2.2 Core Alignment Market Size Estimates and Forecasts to 2032 (USD Million)

8.3 Cladding Alignment

8.3.1 Cladding Alignment Market Trends Analysis (2020-2032)

8.3.2 Cladding Alignment Market Size Estimates and Forecasts to 2032 (USD Million)

9. Fusion Splicer Market Segmentation, by Application

9.1 Chapter Overview

9.2 Telecommunication

9.2.1 Telecommunication Market Trends Analysis (2020-2032)

9.2.2 Telecommunication Market Size Estimates and Forecasts to 2032 (USD Million)

9.3 Cable TV

9.3.1 Cable TV Market Trends Analysis (2020-2032)

9.3.2 Cable TV Market Size Estimates and Forecasts to 2032 (USD Million)

9.4 Enterprise

9.4.1 Enterprise Market Trends Analysis (2020-2032)

9.4.2 Enterprise Market Size Estimates and Forecasts to 2032 (USD Million)

9.5 Aerospace & Defense

9.5.1 Aerospace & Defense Market Trends Analysis (2020-2032)

9.5.2 Aerospace & Defense Market Size Estimates and Forecasts to 2032 (USD Million)

9.6 Specialty

9.6.1 Specialty Market Trends Analysis (2020-2032)

9.6.2 Specialty Market Size Estimates and Forecasts to 2032 (USD Million)

10. Regional Analysis

10.1 Chapter Overview

10.2 North America

10.2.1 Trends Analysis

10.2.2 North America Fusion Splicer Market Estimates and Forecasts, by Country (2020-2032) (USD Million)

10.2.3 North America Fusion Splicer Market Estimates and Forecasts, by Offering (2020-2032) (USD Million) 

10.2.4 North America Fusion Splicer Market Estimates and Forecasts, by Alignment Type  (2020-2032) (USD Million)

10.2.5 North America Fusion Splicer Market Estimates and Forecasts, by Application  (2020-2032) (USD Million)

10.2.6 USA

10.2.6.1 USA Fusion Splicer Market Estimates and Forecasts, by Offering (2020-2032) (USD Million)

10.2.6.2 USA Fusion Splicer Market Estimates and Forecasts, by Alignment Type  (2020-2032) (USD Million)

10.2.6.3 USA Fusion Splicer Market Estimates and Forecasts, by Application  (2020-2032) (USD Million)

10.2.7 Canada

10.2.7.1 Canada Fusion Splicer Market Estimates and Forecasts, by Offering (2020-2032) (USD Million)

10.2.7.2 Canada Fusion Splicer Market Estimates and Forecasts, by Alignment Type  (2020-2032) (USD Million)

10.2.7.3 Canada Fusion Splicer Market Estimates and Forecasts, by Application  (2020-2032) (USD Million)

10.2.8 Mexico

10.2.8.1 Mexico Fusion Splicer Market Estimates and Forecasts, by Offering (2020-2032) (USD Million)

10.2.8.2 Mexico Fusion Splicer Market Estimates and Forecasts, by Alignment Type  (2020-2032) (USD Million)

10.2.8.3 Mexico Fusion Splicer Market Estimates and Forecasts, by Application  (2020-2032) (USD Million)

10.3 Europe

10.3.1 Eastern Europe

10.3.1.1 Trends Analysis

10.3.1.2 Eastern Europe Fusion Splicer Market Estimates and Forecasts, by Country (2020-2032) (USD Million)

10.3.1.3 Eastern Europe Fusion Splicer Market Estimates and Forecasts, by Offering (2020-2032) (USD Million) 

10.3.1.4 Eastern Europe Fusion Splicer Market Estimates and Forecasts, by Alignment Type  (2020-2032) (USD Million)

10.3.1.5 Eastern Europe Fusion Splicer Market Estimates and Forecasts, by Application  (2020-2032) (USD Million)

10.3.1.6 Poland

10.3.1.6.1 Poland Fusion Splicer Market Estimates and Forecasts, by Offering (2020-2032) (USD Million)

10.3.1.6.2 Poland Fusion Splicer Market Estimates and Forecasts, by Alignment Type  (2020-2032) (USD Million)

10.3.1.6.3 Poland Fusion Splicer Market Estimates and Forecasts, by Application  (2020-2032) (USD Million)

10.3.1.7 Romania

10.3.1.7.1 Romania Fusion Splicer Market Estimates and Forecasts, by Offering (2020-2032) (USD Million)

10.3.1.7.2 Romania Fusion Splicer Market Estimates and Forecasts, by Alignment Type  (2020-2032) (USD Million)

10.3.1.7.3 Romania Fusion Splicer Market Estimates and Forecasts, by Application  (2020-2032) (USD Million)

10.3.1.8 Hungary

10.3.1.8.1 Hungary Fusion Splicer Market Estimates and Forecasts, by Offering (2020-2032) (USD Million)

10.3.1.8.2 Hungary Fusion Splicer Market Estimates and Forecasts, by Alignment Type  (2020-2032) (USD Million)

10.3.1.8.3 Hungary Fusion Splicer Market Estimates and Forecasts, by Application  (2020-2032) (USD Million)

10.3.1.9 Turkey

10.3.1.9.1 Turkey Fusion Splicer Market Estimates and Forecasts, by Offering (2020-2032) (USD Million)

10.3.1.9.2 Turkey Fusion Splicer Market Estimates and Forecasts, by Alignment Type  (2020-2032) (USD Million)

10.3.1.9.3 Turkey Fusion Splicer Market Estimates and Forecasts, by Application  (2020-2032) (USD Million)

10.3.1.10 Rest of Eastern Europe

10.3.1.10.1 Rest of Eastern Europe Fusion Splicer Market Estimates and Forecasts, by Offering (2020-2032) (USD Million)

10.3.1.10.2 Rest of Eastern Europe Fusion Splicer Market Estimates and Forecasts, by Alignment Type  (2020-2032) (USD Million)

10.3.1.10.3 Rest of Eastern Europe Fusion Splicer Market Estimates and Forecasts, by Application  (2020-2032) (USD Million)

10.3.2 Western Europe

10.3.2.1 Trends Analysis

10.3.2.2 Western Europe Fusion Splicer Market Estimates and Forecasts, by Country (2020-2032) (USD Million)

10.3.2.3 Western Europe Fusion Splicer Market Estimates and Forecasts, by Offering (2020-2032) (USD Million) 

10.3.2.4 Western Europe Fusion Splicer Market Estimates and Forecasts, by Alignment Type  (2020-2032) (USD Million)

10.3.2.5 Western Europe Fusion Splicer Market Estimates and Forecasts, by Application  (2020-2032) (USD Million)

10.3.2.6 Germany

10.3.2.6.1 Germany Fusion Splicer Market Estimates and Forecasts, by Offering (2020-2032) (USD Million)

10.3.2.6.2 Germany Fusion Splicer Market Estimates and Forecasts, by Alignment Type  (2020-2032) (USD Million)

10.3.2.6.3 Germany Fusion Splicer Market Estimates and Forecasts, by Application  (2020-2032) (USD Million)

10.3.2.7 France

10.3.2.7.1 France Fusion Splicer Market Estimates and Forecasts, by Offering (2020-2032) (USD Million)

10.3.2.7.2 France Fusion Splicer Market Estimates and Forecasts, by Alignment Type  (2020-2032) (USD Million)

10.3.2.7.3 France Fusion Splicer Market Estimates and Forecasts, by Application  (2020-2032) (USD Million)

10.3.2.8 UK

10.3.2.8.1 UK Fusion Splicer Market Estimates and Forecasts, by Offering (2020-2032) (USD Million)

10.3.2.8.2 UK Fusion Splicer Market Estimates and Forecasts, by Alignment Type  (2020-2032) (USD Million)

10.3.2.8.3 UK Fusion Splicer Market Estimates and Forecasts, by Application  (2020-2032) (USD Million)

10.3.2.9 Italy

10.3.2.9.1 Italy Fusion Splicer Market Estimates and Forecasts, by Offering (2020-2032) (USD Million)

10.3.2.9.2 Italy Fusion Splicer Market Estimates and Forecasts, by Alignment Type  (2020-2032) (USD Million)

10.3.2.9.3 Italy Fusion Splicer Market Estimates and Forecasts, by Application  (2020-2032) (USD Million)

10.3.2.10 Spain

10.3.2.10.1 Spain Fusion Splicer Market Estimates and Forecasts, by Offering (2020-2032) (USD Million)

10.3.2.10.2 Spain Fusion Splicer Market Estimates and Forecasts, by Alignment Type  (2020-2032) (USD Million)

10.3.2.10.3 Spain Fusion Splicer Market Estimates and Forecasts, by Application  (2020-2032) (USD Million)

10.3.2.11 Netherlands

10.3.2.11.1 Netherlands Fusion Splicer Market Estimates and Forecasts, by Offering (2020-2032) (USD Million)

10.3.2.11.2 Netherlands Fusion Splicer Market Estimates and Forecasts, by Alignment Type  (2020-2032) (USD Million)

10.3.2.11.3 Netherlands Fusion Splicer Market Estimates and Forecasts, by Application  (2020-2032) (USD Million)

10.3.2.12 Switzerland

10.3.2.12.1 Switzerland Fusion Splicer Market Estimates and Forecasts, by Offering (2020-2032) (USD Million)

10.3.2.12.2 Switzerland Fusion Splicer Market Estimates and Forecasts, by Alignment Type  (2020-2032) (USD Million)

10.3.2.12.3 Switzerland Fusion Splicer Market Estimates and Forecasts, by Application  (2020-2032) (USD Million)

10.3.2.13 Austria

10.3.2.13.1 Austria Fusion Splicer Market Estimates and Forecasts, by Offering (2020-2032) (USD Million)

10.3.2.13.2 Austria Fusion Splicer Market Estimates and Forecasts, by Alignment Type  (2020-2032) (USD Million)

10.3.2.13.3 Austria Fusion Splicer Market Estimates and Forecasts, by Application  (2020-2032) (USD Million)

10.3.2.14 Rest of Western Europe

10.3.2.14.1 Rest of Western Europe Fusion Splicer Market Estimates and Forecasts, by Offering (2020-2032) (USD Million)

10.3.2.14.2 Rest of Western Europe Fusion Splicer Market Estimates and Forecasts, by Alignment Type  (2020-2032) (USD Million)

10.3.2.14.3 Rest of Western Europe Fusion Splicer Market Estimates and Forecasts, by Application  (2020-2032) (USD Million)

10.4 Asia Pacific

10.4.1 Trends Analysis

10.4.2 Asia Pacific Fusion Splicer Market Estimates and Forecasts, by Country (2020-2032) (USD Million)

10.4.3 Asia Pacific Fusion Splicer Market Estimates and Forecasts, by Offering (2020-2032) (USD Million) 

10.4.4 Asia Pacific Fusion Splicer Market Estimates and Forecasts, by Alignment Type  (2020-2032) (USD Million)

10.4.5 Asia Pacific Fusion Splicer Market Estimates and Forecasts, by Application  (2020-2032) (USD Million)

10.4.6 China

10.4.6.1 China Fusion Splicer Market Estimates and Forecasts, by Offering (2020-2032) (USD Million)

10.4.6.2 China Fusion Splicer Market Estimates and Forecasts, by Alignment Type  (2020-2032) (USD Million)

10.4.6.3 China Fusion Splicer Market Estimates and Forecasts, by Application  (2020-2032) (USD Million)

10.4.7 India

10.4.7.1 India Fusion Splicer Market Estimates and Forecasts, by Offering (2020-2032) (USD Million)

10.4.7.2 India Fusion Splicer Market Estimates and Forecasts, by Alignment Type  (2020-2032) (USD Million)

10.4.7.3 India Fusion Splicer Market Estimates and Forecasts, by Application  (2020-2032) (USD Million)

10.4.8 Japan

10.4.8.1 Japan Fusion Splicer Market Estimates and Forecasts, by Offering (2020-2032) (USD Million)

10.4.8.2 Japan Fusion Splicer Market Estimates and Forecasts, by Alignment Type  (2020-2032) (USD Million)

10.4.8.3 Japan Fusion Splicer Market Estimates and Forecasts, by Application  (2020-2032) (USD Million)

10.4.9 South Korea

10.4.9.1 South Korea Fusion Splicer Market Estimates and Forecasts, by Offering (2020-2032) (USD Million)

10.4.9.2 South Korea Fusion Splicer Market Estimates and Forecasts, by Alignment Type  (2020-2032) (USD Million)

10.4.9.3 South Korea Fusion Splicer Market Estimates and Forecasts, by Application  (2020-2032) (USD Million)

10.4.10 Vietnam

10.4.10.1 Vietnam Fusion Splicer Market Estimates and Forecasts, by Offering (2020-2032) (USD Million)

10.4.10.2 Vietnam Fusion Splicer Market Estimates and Forecasts, by Alignment Type  (2020-2032) (USD Million)

10.4.10.3 Vietnam Fusion Splicer Market Estimates and Forecasts, by Application  (2020-2032) (USD Million)

10.4.11 Singapore

10.4.11.1 Singapore Fusion Splicer Market Estimates and Forecasts, by Offering (2020-2032) (USD Million)

10.4.11.2 Singapore Fusion Splicer Market Estimates and Forecasts, by Alignment Type  (2020-2032) (USD Million)

10.4.11.3 Singapore Fusion Splicer Market Estimates and Forecasts, by Application  (2020-2032) (USD Million)

10.4.12 Australia

10.4.12.1 Australia Fusion Splicer Market Estimates and Forecasts, by Offering (2020-2032) (USD Million)

10.4.12.2 Australia Fusion Splicer Market Estimates and Forecasts, by Alignment Type  (2020-2032) (USD Million)

10.4.12.3 Australia Fusion Splicer Market Estimates and Forecasts, by Application  (2020-2032) (USD Million)

10.4.13 Rest of Asia Pacific

10.4.13.1 Rest of Asia Pacific Fusion Splicer Market Estimates and Forecasts, by Offering (2020-2032) (USD Million)

10.4.13.2 Rest of Asia Pacific Fusion Splicer Market Estimates and Forecasts, by Alignment Type  (2020-2032) (USD Million)

10.4.13.3 Rest of Asia Pacific Fusion Splicer Market Estimates and Forecasts, by Application  (2020-2032) (USD Million)

10.5 Middle East and Africa

10.5.1 Middle East

10.5.1.1 Trends Analysis

10.5.1.2 Middle East Fusion Splicer Market Estimates and Forecasts, by Country (2020-2032) (USD Million)

10.5.1.3 Middle East Fusion Splicer Market Estimates and Forecasts, by Offering (2020-2032) (USD Million) 

10.5.1.4 Middle East Fusion Splicer Market Estimates and Forecasts, by Alignment Type  (2020-2032) (USD Million)

10.5.1.5 Middle East Fusion Splicer Market Estimates and Forecasts, by Application  (2020-2032) (USD Million)

10.5.1.6 UAE

10.5.1.6.1 UAE Fusion Splicer Market Estimates and Forecasts, by Offering (2020-2032) (USD Million)

10.5.1.6.2 UAE Fusion Splicer Market Estimates and Forecasts, by Alignment Type  (2020-2032) (USD Million)

10.5.1.6.3 UAE Fusion Splicer Market Estimates and Forecasts, by Application  (2020-2032) (USD Million)

10.5.1.7 Egypt

10.5.1.7.1 Egypt Fusion Splicer Market Estimates and Forecasts, by Offering (2020-2032) (USD Million)

10.5.1.7.2 Egypt Fusion Splicer Market Estimates and Forecasts, by Alignment Type  (2020-2032) (USD Million)

10.5.1.7.3 Egypt Fusion Splicer Market Estimates and Forecasts, by Application  (2020-2032) (USD Million)

10.5.1.8 Saudi Arabia

10.5.1.8.1 Saudi Arabia Fusion Splicer Market Estimates and Forecasts, by Offering (2020-2032) (USD Million)

10.5.1.8.2 Saudi Arabia Fusion Splicer Market Estimates and Forecasts, by Alignment Type  (2020-2032) (USD Million)

10.5.1.8.3 Saudi Arabia Fusion Splicer Market Estimates and Forecasts, by Application  (2020-2032) (USD Million)

10.5.1.9 Qatar

10.5.1.9.1 Qatar Fusion Splicer Market Estimates and Forecasts, by Offering (2020-2032) (USD Million)

10.5.1.9.2 Qatar Fusion Splicer Market Estimates and Forecasts, by Alignment Type  (2020-2032) (USD Million)

10.5.1.9.3 Qatar Fusion Splicer Market Estimates and Forecasts, by Application  (2020-2032) (USD Million)

10.5.1.10 Rest of Middle East

10.5.1.10.1 Rest of Middle East Fusion Splicer Market Estimates and Forecasts, by Offering (2020-2032) (USD Million)

10.5.1.10.2 Rest of Middle East Fusion Splicer Market Estimates and Forecasts, by Alignment Type  (2020-2032) (USD Million)

10.5.1.10.3 Rest of Middle East Fusion Splicer Market Estimates and Forecasts, by Application  (2020-2032) (USD Million)

10.5.2 Africa

10.5.2.1 Trends Analysis

10.5.2.2 Africa Fusion Splicer Market Estimates and Forecasts, by Country (2020-2032) (USD Million)

10.5.2.3 Africa Fusion Splicer Market Estimates and Forecasts, by Offering (2020-2032) (USD Million) 

10.5.2.4 Africa Fusion Splicer Market Estimates and Forecasts, by Alignment Type  (2020-2032) (USD Million)

10.5.2.5 Africa Fusion Splicer Market Estimates and Forecasts, by Application  (2020-2032) (USD Million)

10.5.2.6 South Africa

10.5.2.6.1 South Africa Fusion Splicer Market Estimates and Forecasts, by Offering (2020-2032) (USD Million)

10.5.2.6.2 South Africa Fusion Splicer Market Estimates and Forecasts, by Alignment Type  (2020-2032) (USD Million)

10.5.2.6.3 South Africa Fusion Splicer Market Estimates and Forecasts, by Application  (2020-2032) (USD Million)

10.5.2.7 Nigeria

10.5.2.7.1 Nigeria Fusion Splicer Market Estimates and Forecasts, by Offering (2020-2032) (USD Million)

10.5.2.7.2 Nigeria Fusion Splicer Market Estimates and Forecasts, by Alignment Type  (2020-2032) (USD Million)

10.5.2.7.3 Nigeria Fusion Splicer Market Estimates and Forecasts, by Application  (2020-2032) (USD Million)

10.5.2.8 Rest of Africa

10.5.2.8.1 Rest of Africa Fusion Splicer Market Estimates and Forecasts, by Offering (2020-2032) (USD Million)

10.5.2.8.2 Rest of Africa Fusion Splicer Market Estimates and Forecasts, by Alignment Type  (2020-2032) (USD Million)

10.5.2.8.3 Rest of Africa Fusion Splicer Market Estimates and Forecasts, by Application  (2020-2032) (USD Million)

10.6 Latin America

10.6.1 Trends Analysis

10.6.2 Latin America Fusion Splicer Market Estimates and Forecasts, by Country (2020-2032) (USD Million)

10.6.3 Latin America Fusion Splicer Market Estimates and Forecasts, by Offering (2020-2032) (USD Million) 

10.6.4 Latin America Fusion Splicer Market Estimates and Forecasts, by Alignment Type  (2020-2032) (USD Million)

10.6.5 Latin America Fusion Splicer Market Estimates and Forecasts, by Application  (2020-2032) (USD Million)

10.6.6 Brazil

10.6.6.1 Brazil Fusion Splicer Market Estimates and Forecasts, by Offering (2020-2032) (USD Million)

10.6.6.2 Brazil Fusion Splicer Market Estimates and Forecasts, by Alignment Type  (2020-2032) (USD Million)

10.6.6.3 Brazil Fusion Splicer Market Estimates and Forecasts, by Application  (2020-2032) (USD Million)

10.6.7 Argentina

10.6.7.1 Argentina Fusion Splicer Market Estimates and Forecasts, by Offering (2020-2032) (USD Million)

10.6.7.2 Argentina Fusion Splicer Market Estimates and Forecasts, by Alignment Type  (2020-2032) (USD Million)

10.6.7.3 Argentina Fusion Splicer Market Estimates and Forecasts, by Application  (2020-2032) (USD Million)

10.6.8 Colombia

10.6.8.1 Colombia Fusion Splicer Market Estimates and Forecasts, by Offering (2020-2032) (USD Million)

10.6.8.2 Colombia Fusion Splicer Market Estimates and Forecasts, by Alignment Type  (2020-2032) (USD Million)

10.6.8.3 Colombia Fusion Splicer Market Estimates and Forecasts, by Application  (2020-2032) (USD Million)

10.6.9 Rest of Latin America

10.6.9.1 Rest of Latin America Fusion Splicer Market Estimates and Forecasts, by Offering (2020-2032) (USD Million)

10.6.9.2 Rest of Latin America Fusion Splicer Market Estimates and Forecasts, by Alignment Type  (2020-2032) (USD Million)

10.6.9.3 Rest of Latin America Fusion Splicer Market Estimates and Forecasts, by Application  (2020-2032) (USD Million)

11. Company Profiles

11.1 Fujikura

11.1.1 Company Overview

11.1.2 Financial

11.1.3 Products/ Services Offered

11.1.4 SWOT Analysis

11.2 Sumitomo Electric

11.2.1 Company Overview

11.2.2 Financial

11.2.3 Products/ Services Offered

11.2.4 SWOT Analysis

11.3 Tektronix

11.3.1 Company Overview

11.3.2 Financial

11.3.3 Products/ Services Offered

11.3.4 SWOT Analysis

11.4 Huawei

11.4.1 Company Overview

11.4.2 Financial

11.4.3 Products/ Services Offered

11.4.4 SWOT Analysis

11.5 Fiberhome

11.5.1 Company Overview

11.5.2 Financial

11.5.3 Products/ Services Offered

11.5.4 SWOT Analysis

11.6 Ribbon Communications

11.6.1 Company Overview

11.6.2 Financial

11.6.3 Products/ Services Offered

11.6.4 SWOT Analysis

11.7 Corning

11.7.1 Company Overview

11.7.2 Financial

11.7.3 Products/ Services Offered

11.7.4 SWOT Analysis

11.8 Yokogawa Electric

11.8.1 Company Overview

11.8.2 Financial

11.8.3 Products/ Services Offered

11.8.4 SWOT Analysis

11.9 Optotec

11.9.1 Company Overview

11.9.2 Financial

11.9.3 Products/ Services Offered

11.9.4 SWOT Analysis

11.10 Optotec

11.10.1 Company Overview

11.10.2 Financial

11.10.3 Products/ Services Offered

11.10.4 SWOT Analysis

12. Use Cases and Best Practices

13. Conclusion

An accurate research report requires proper strategizing as well as implementation. There are multiple factors involved in the completion of good and accurate research report and selecting the best methodology to compete the research is the toughest part. Since the research reports we provide play a crucial role in any company’s decision-making process, therefore we at SNS Insider always believe that we should choose the best method which gives us results closer to reality. This allows us to reach at a stage wherein we can provide our clients best and accurate investment to output ratio.

Each report that we prepare takes a timeframe of 350-400 business hours for production. Starting from the selection of titles through a couple of in-depth brain storming session to the final QC process before uploading our titles on our website we dedicate around 350 working hours. The titles are selected based on their current market cap and the foreseen CAGR and growth.


The 5 steps process:

Step 1: Secondary Research:

Secondary Research or Desk Research is as the name suggests is a research process wherein, we collect data through the readily available information. In this process we use various paid and unpaid databases which our team has access to and gather data through the same. This includes examining of listed companies’ annual reports, Journals, SEC filling etc. Apart from this our team has access to various associations across the globe across different industries. Lastly, we have exchange relationships with various university as well as individual libraries.

Secondary Research

Step 2: Primary Research

When we talk about primary research, it is a type of study in which the researchers collect relevant data samples directly, rather than relying on previously collected data.  This type of research is focused on gaining content specific facts that can be sued to solve specific problems. Since the collected data is fresh and first hand therefore it makes the study more accurate and genuine.

We at SNS Insider have divided Primary Research into 2 parts.

Part 1 wherein we interview the KOLs of major players as well as the upcoming ones across various geographic regions. This allows us to have their view over the market scenario and acts as an important tool to come closer to the accurate market numbers. As many as 45 paid and unpaid primary interviews are taken from both the demand and supply side of the industry to make sure we land at an accurate judgement and analysis of the market.

This step involves the triangulation of data wherein our team analyses the interview transcripts, online survey responses and observation of on filed participants. The below mentioned chart should give a better understanding of the part 1 of the primary interview.

Primary Research

Part 2: In this part of primary research the data collected via secondary research and the part 1 of the primary research is validated with the interviews from individual consultants and subject matter experts.

Consultants are those set of people who have at least 12 years of experience and expertise within the industry whereas Subject Matter Experts are those with at least 15 years of experience behind their back within the same space. The data with the help of two main processes i.e., FGDs (Focused Group Discussions) and IDs (Individual Discussions). This gives us a 3rd party nonbiased primary view of the market scenario making it a more dependable one while collation of the data pointers.

Step 3: Data Bank Validation

Once all the information is collected via primary and secondary sources, we run that information for data validation. At our intelligence centre our research heads track a lot of information related to the market which includes the quarterly reports, the daily stock prices, and other relevant information. Our data bank server gets updated every fortnight and that is how the information which we collected using our primary and secondary information is revalidated in real time.

Data Bank Validation

Step 4: QA/QC Process

After all the data collection and validation our team does a final level of quality check and quality assurance to get rid of any unwanted or undesired mistakes. This might include but not limited to getting rid of the any typos, duplication of numbers or missing of any important information. The people involved in this process include technical content writers, research heads and graphics people. Once this process is completed the title gets uploader on our platform for our clients to read it.

Step 5: Final QC/QA Process:

This is the last process and comes when the client has ordered the study. In this process a final QA/QC is done before the study is emailed to the client. Since we believe in giving our clients a good experience of our research studies, therefore, to make sure that we do not lack at our end in any way humanly possible we do a final round of quality check and then dispatch the study to the client.

Key Segments:

By Offering

  • Hardware

  • Software & Services

By Alignment Type

  • Core Alignment

  • Cladding Alignment

By Application

  • Telecommunication

  • Cable TV

  • Enterprise

  • Aerospace & Defense

  • Specialty

Request for Segment Customization as per your Business Requirement: Segment Customization Request

Regional Coverage:

North America

  • US

  • Canada

  • Mexico

Europe

  • Eastern Europe

    • Poland

    • Romania

    • Hungary

    • Turkey

    • Rest of Eastern Europe

  • Western Europe

    • Germany

    • France

    • UK

    • Italy

    • Spain

    • Netherlands

    • Switzerland

    • Austria

    • Rest of Western Europe

Asia Pacific

  • China

  • India

  • Japan

  • South Korea

  • Vietnam

  • Singapore

  • Australia

  • Rest of Asia Pacific

Middle East & Africa

  • Middle East

    • UAE

    • Egypt

    • Saudi Arabia

    • Qatar

    • Rest of Middle East

  • Africa

    • Nigeria

    • South Africa

    • Rest of Africa

Latin America

  • Brazil

  • Argentina

  • Colombia

  • Rest of Latin America

Request for Country Level Research Report: Country Level Customization Request

Available Customization

With the given market data, SNS Insider offers customization as per the company’s specific needs. The following customization options are available for the report:

  • Detailed Volume Analysis

  • Criss-Cross segment analysis (e.g. Product X Application)

  • Competitive Product Benchmarking

  • Geographic Analysis

  • Additional countries in any of the regions

  • Customized Data Representation

  • Detailed analysis and profiling of additional market players


  •            5000 (33% Discount)


  •            8950 (40% Discount)


  •            3050 (23% Discount)

Start a Conversation

Hi! Click one of our member below to chat on Phone