image

Furandicarboxylic Acid Market Size:

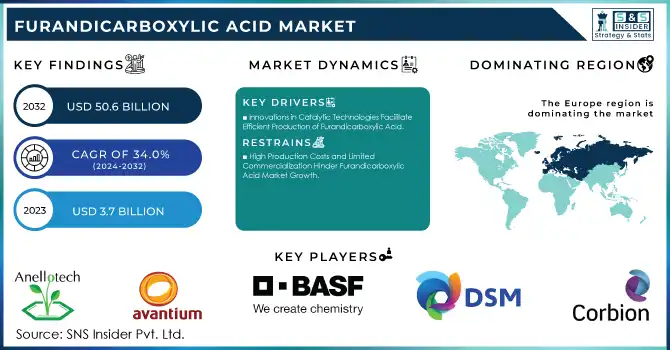
The Furandicarboxylic Acid Market Size was valued at USD 3.7 Billion in 2023 and is expected to reach USD 50.6 Billion by 2032 and grow at a CAGR of 34.0% over the forecast period 2024-2032.
Furandicarboxylic Acid Market Revenue Analysis

To get more information on Furandicarboxylic Acid Market - Request Free Sample Report

The Furandicarboxylic Acid market is experiencing a surge in growth, driven by increasing demand for sustainable and bio-based alternatives to traditional petrochemical-based products. Furandicarboxylic Acid is gaining significant traction due to its application in producing poly (ethylene furanoate) (PEF), a 100% bio-based polymer with superior barrier properties compared to PET. The push towards reducing carbon footprints and achieving environmental sustainability has propelled innovations and investments in Furandicarboxylic Acid production. Recent technological advancements and collaborative agreements underscore the market's dynamic nature. Key developments include the establishment of new production facilities and long-term partnerships aimed at expanding the adoption of Furandicarboxylic Acid in various end-use industries such as packaging, textiles, and coatings.

In October 2024, Avantium inaugurated a biobased Furandicarboxylic Acid production plant in the Netherlands, a milestone showcasing its commitment to scaling sustainable chemical solutions. This plant represents a significant step in commercializing bio-based Furandicarboxylic Acid, highlighting its potential to transform the packaging industry. Earlier in January 2024, Avantium entered a multi-year agreement with Helios Resins to supply Furandicarboxylic Acid to produce sustainable alkyd resins. This partnership emphasizes the growing industrial interest in leveraging Furandicarboxylic Acid for diverse applications, including coatings and paints, aligning with global sustainability goals. These initiatives exemplify how leading players are focusing on strategic expansions and collaborations to capitalize on the environmental and functional advantages of Furandicarboxylic Acid, further solidifying its position in the global market.

Market Dynamics:

Drivers:

  • Rising Adoption of Bio-Based Polymers for Packaging Applications Encourages Furandicarboxylic Acid Market Expansion

The growing emphasis on sustainable packaging solutions is a key driver for the Furandicarboxylic Acid market. Furandicarboxylic Acid-based poly(ethylene furanoate) (PEF) has gained significant attention as an eco-friendly alternative to conventional plastics such as PET. PEF offers enhanced properties, including superior oxygen and carbon dioxide barrier performance, making it ideal for beverage and food packaging applications. Consumers and industries alike are demanding bio-based materials that align with their sustainability goals, which has led to increased research and development in Furandicarboxylic Acid applications. Regulatory frameworks that promote the adoption of biodegradable and recyclable materials are further accelerating this transition. Governments in regions like Europe and North America are enforcing stricter guidelines for reducing single-use plastics, creating a favorable environment for the adoption of Furandicarboxylic Acid. Companies investing in Furandicarboxylic Acid-based packaging solutions are also finding opportunities to strengthen their brand image by appealing to eco-conscious consumers, driving market growth.

  • Innovations in Catalytic Technologies Facilitate Efficient Production of Furandicarboxylic Acid

  • Supportive Regulatory Frameworks and Policies Propel Bio-Based Chemical Adoption

Governments worldwide are promoting the use of sustainable chemicals through favorable policies and financial incentives, boosting the Furandicarboxylic Acid market. Regulatory bodies in Europe and North America have introduced stringent policies aimed at reducing carbon emissions and promoting the circular economy. These measures have encouraged industries to adopt bio-based solutions, including Furandicarboxylic Acid, as part of their compliance strategies. Financial incentives such as tax rebates and subsidies for bio-based material production have further accelerated the shift towards Furandicarboxylic Acid. Additionally, Furandicarboxylic Acid’s alignment with global sustainability initiatives like the European Green Deal and the UN’s Sustainable Development Goals (SDGs) strengthens its position in the market. Policymakers are also fostering public-private partnerships to scale up bio-based chemical production, offering companies opportunities to innovate while adhering to environmental mandates. Such regulatory support ensures a steady demand for Furandicarboxylic Acid and enhances its potential across various sectors.

Restraint:

  • High Production Costs and Limited Commercialization Hinder Furandicarboxylic Acid Market Growth

The high production cost of Furandicarboxylic Acid remains a significant restraint to its market growth. The complex process of synthesizing Furandicarboxylic Acid, which involves converting fructose to hydroxymethylfurfural (HMF) and then to Furandicarboxylic Acid, requires advanced catalytic technologies and energy-intensive steps. These factors contribute to higher production costs compared to petrochemical-based alternatives like PET. Furthermore, the limited availability of raw materials, such as fructose, and the high cost of catalysts used in the production process make Furandicarboxylic Acid less accessible for manufacturers, particularly in cost-sensitive industries. This high cost structure also restricts smaller players from entering the market, limiting competition and innovation. Additionally, the market faces challenges in scaling up production to meet commercial demands, which has slowed its adoption in mainstream applications. These barriers, coupled with the well-established dominance of cheaper alternatives, make it difficult for Furandicarboxylic Acid to achieve widespread commercialization despite its environmental advantages.

Opportunity:

  • Growing Consumer Awareness for Sustainability Drives Demand for Furandicarboxylic Acid-Based Products Across Applications

  • Advancements in Feedstock Alternatives Unlock New Horizons for Furandicarboxylic Acid Production

Recent developments in the use of alternative feedstocks, such as agricultural waste and lignocellulosic biomass, have created promising opportunities for the production of Furandicarboxylic Acid. These innovations address the challenge of feedstock availability while supporting the principles of a circular economy. By utilizing non-food resources for Furandicarboxylic Acid production, manufacturers can reduce reliance on traditional feedstocks like fructose, lower costs, and enhance sustainability. These advancements have the potential to scale up production and meet the growing demand for bio-based materials, making Furandicarboxylic Acid more viable for widespread industrial use.

Challenge:

  • Competition from Petrochemical-Based Alternatives Poses Significant Threat to Furandicarboxylic Acid Market Growth

The Furandicarboxylic Acid market faces intense competition from well-established petrochemical-based alternatives like PET, which dominate global supply chains. Petrochemical polymers benefit from economies of scale, lower production costs, and deeply entrenched manufacturing processes, making them more accessible and affordable for many industries. Transitioning from these materials to Furandicarboxylic Acid-based alternatives requires significant investment in new technologies, production infrastructure, and consumer education. Additionally, the reluctance of manufacturers to shift from proven and cost-effective petrochemical materials to newer, bio-based options exacerbates the challenge. This competitive landscape creates a substantial hurdle for Furandicarboxylic Acid adoption, particularly in price-sensitive markets.

Increasing Investments and Funding Trends Fueling Growth in the Furandicarboxylic Acid Market

The Furandicarboxylic Acid market is witnessing a surge in investments and funding initiatives, reflecting the growing interest in sustainable and bio-based solutions. Key industry players and governments are investing in research and development, production facilities, and partnerships to accelerate Furandicarboxylic Acid commercialization. These investments are crucial for overcoming challenges related to production scalability and cost-efficiency, further boosting Furandicarboxylic Acid's adoption across various applications. Below is a table summarizing notable investment and funding trends shaping the Furandicarboxylic Acid market.

Year Investor/Organization Funding/Investment Amount Purpose
2024 Avantium €192 Million Construction of the world’s first commercial Furandicarboxylic Acid plant in the Netherlands.
2023 European Innovation Council (EIC) €15 Million Supporting Furandicarboxylic Acid research and scaling-up production in Europe.
2023 BASF and Avantium Joint Venture Undisclosed Developing Furandicarboxylic Acid-based PEF for packaging and textiles.
2022 Helios Resins Multi-year investment Collaboration with Avantium for Furandicarboxylic Acid supply for innovative resin production.
2022 Asian Development Bank (ADB) $20 Million Promoting bio-based chemical projects, including Furandicarboxylic Acid, in Asia-Pacific.

These investment initiatives indicate the increasing confidence in Furandicarboxylic Acid's potential to replace petrochemical counterparts. The funding is directed towards scaling up production, exploring new applications, and enhancing Furandicarboxylic Acid's competitive edge, ensuring its relevance in the global sustainability narrative.

Key Market Segments

By Source

In 2023, the Biological Feedstocks segment dominated the Furandicarboxylic Acid market, holding a market share of 65%. This dominance is attributed to the increasing focus on sustainability and the shift towards renewable raw materials in various industries. Biological feedstocks, such as fructose derived from renewable resources like corn and sugarcane, are considered more eco-friendly compared to fossil-based feedstocks. These feedstocks help reduce carbon emissions, aligning with global efforts to transition to greener, more sustainable alternatives. Companies like Avantium have capitalized on this by developing biorefinery processes that convert plant-based sugars into Furandicarboxylic Acid, enabling large-scale production of sustainable chemicals. Biological feedstocks are also preferred in the production of polyethylene furanoate (PEF), a bio-based polyester used in packaging, textiles, and other applications. As the demand for sustainable and circular products continues to grow, the preference for biological feedstocks is expected to strengthen, driving further growth in the Furandicarboxylic Acid market. This trend is supported by governments offering subsidies and incentives for bio-based chemical production, making it an attractive option for producers.

By Technology

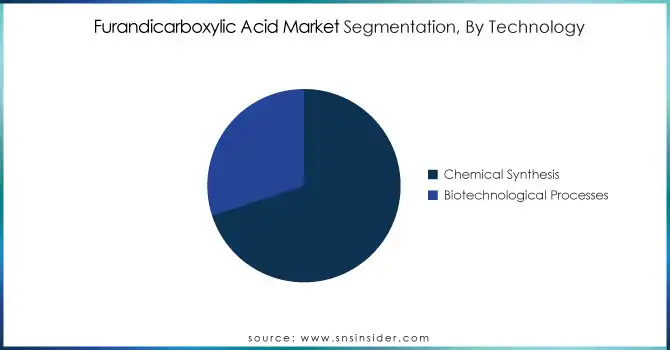
The Chemical Synthesis segment led the Furandicarboxylic Acid market in 2023, with a market share of 60%. Chemical synthesis remains the preferred technology for large-scale Furandicarboxylic Acid production due to its proven scalability and cost-effectiveness. This method involves the conversion of fossil-based feedstocks such as glucose into Furandicarboxylic Acid using chemical catalysts and processes that are well established in the chemical industry. Major industry players, such as Avantium and BASF, have invested in refining chemical synthesis techniques to optimize Furandicarboxylic Acid production. Although biotechnological processes offer environmentally friendly alternatives, chemical synthesis remains dominant because it is more mature and can be integrated into existing industrial infrastructure. The cost-efficiency of chemical synthesis also makes it a more viable option for mass production, especially for the production of Furandicarboxylic Acid in applications like packaging, automotive, and textiles. Moreover, with advancements in process optimization, chemical synthesis has been able to reduce energy consumption and improve yield, further consolidating its position as the leading technology for Furandicarboxylic Acid production. As a result, chemical synthesis continues to be a key enabler for scaling up Furandicarboxylic Acid production globally.
Furandicarboxylic-Acid-Market-Segmentation-By-Technology

By Application

The Polyesters segment dominated the Furandicarboxylic Acid market in 2023, holding a market share of 55%. Furandicarboxylic Acid is primarily used in the production of polyethylene furanoate (PEF), a bio-based polyester with superior performance characteristics compared to conventional polyethylene terephthalate (PET). PEF offers enhanced barrier properties, higher thermal stability, and better resistance to oxygen and carbon dioxide, making it an ideal material for applications in packaging. The growing consumer demand for sustainable and recyclable packaging has driven the adoption of Furandicarboxylic Acid in the production of PEF-based bottles and containers. Major companies, such as Coca-Cola and Danone, are increasingly using PEF for packaging their products to reduce their environmental impact and meet sustainability goals. As a result, the demand for Furandicarboxylic Acid in the polyester segment continues to rise. Additionally, PEF has applications in textiles and fibers, further expanding the reach of Furandicarboxylic Acid in the market. The shift towards bio-based, circular economy solutions has significantly boosted the role of Furandicarboxylic Acid in polyester production, particularly in the packaging industry, where sustainability is a key focus.

By End-Use Industry

In 2023, the Packaging industry dominated the Furandicarboxylic Acid market, accounting for 50% of the total market share. Furandicarboxylic Acid is a crucial raw material in the production of polyethylene furanoate (PEF), a bio-based alternative to traditional polyethylene terephthalate (PET). PEF’s superior properties, such as better barrier performance against oxygen and carbon dioxide, make it an ideal choice for sustainable packaging applications. The demand for environmentally friendly packaging materials has increased as companies, particularly in the food and beverage sector, strive to reduce their reliance on petroleum-based plastics and meet sustainability targets. Companies like Coca-Cola, Danone, and Nestlé have already started transitioning to PEF-based bottles made with Furandicarboxylic Acid, which can be fully recycled and are biodegradable. This trend towards more sustainable packaging solutions is helping to accelerate the adoption of Furandicarboxylic Acid in the packaging sector. Furthermore, the shift is supported by growing consumer awareness regarding plastic waste and the environmental impact of traditional packaging materials. As the demand for sustainable packaging continues to rise, the packaging industry remains the largest consumer of Furandicarboxylic Acid, driving its market growth.

Regional Analysis

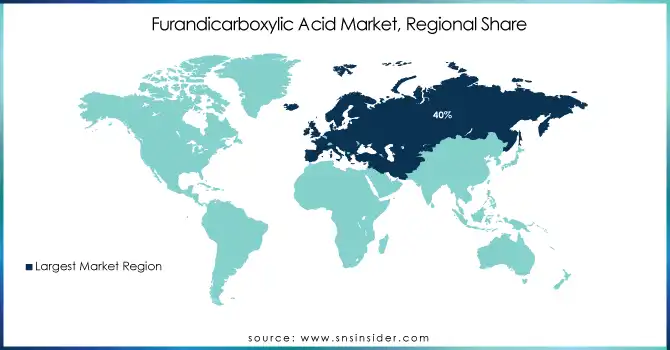
In 2023, Europe dominated the Furandicarboxylic Acid market, accounting for a market share of 40%. This dominance is primarily driven by strong governmental support for sustainability initiatives, coupled with significant investments in bio-based chemical production. Countries like the Netherlands, Germany, and France have been at the forefront of Furandicarboxylic Acid production, largely due to the presence of key industry players such as Avantium, which has developed the world’s first Furandicarboxylic Acid production plant in the Netherlands. Avantium's facility, a major milestone in the bio-based chemicals industry, is set to significantly boost Furandicarboxylic Acid supply, especially for applications in sustainable packaging. Additionally, Europe’s commitment to the European Green Deal and Circular Economy Action Plan has spurred the adoption of sustainable solutions like Furandicarboxylic Acid, further driving demand in the region. Germany, as the largest European economy, has also seen increasing demand for Furandicarboxylic Acid in the automotive, packaging, and textiles sectors. The region’s progressive policies and well-established research and development ecosystem have positioned Europe as the leading market for Furandicarboxylic Acid, driving innovations and adoption across various industries.

Moreover, the Asia-Pacific region emerged as the fastest growing market for Furandicarboxylic Acid in 2023, with a CAGR of 15%. This rapid growth is attributed to the increasing industrialization and rising demand for bio-based chemicals in countries like China, India, and Japan. China, in particular, has become a significant player in the global bio-based chemical sector, investing heavily in the development of sustainable alternatives to petrochemicals. The country’s push for greener solutions, supported by government policies and initiatives such as the 14th Five-Year Plan for Ecological and Environmental Protection, has accelerated the adoption of Furandicarboxylic Acid. India, with its expanding manufacturing base, has also seen a rise in demand for sustainable materials like Furandicarboxylic Acid in packaging and textiles. Furthermore, Japan's commitment to environmental sustainability and circular economy practices has led to increased interest in bio-based polymers, including Furandicarboxylic Acid. The increasing focus on reducing plastic waste and carbon emissions has further fueled the demand for Furandicarboxylic Acid-based products, particularly in packaging, where it is seen as an environmentally friendly alternative to traditional plastics. As the demand for sustainable solutions continues to grow in the region, Asia-Pacific is expected to maintain its position as the fastest growing market for Furandicarboxylic Acid.
Furandicarboxylic-Acid-Market-Regional-Share

Get Customized Report as per Your Business Requirement - Enquiry Now

Recent Developments

October 2024: Avantium opened its biobased Furandicarboxylic Acid plant in the Netherlands, with a capacity of 5,000 tons annually. The plant will produce Releaf, a sustainable alternative to petroleum-based plastics used in packaging and textiles, advancing the company’s sustainability initiatives.

Key Players 

  • Anellotech (Bio-TCat technology, TPC (Bio-Based PET))

  • Avantium (YXY technology, PEF (Polyethylene Furanoate))

  • BASF (EcoFense, polyamide-based materials)

  • Corbion (Luminy, PEF (Polyethylene Furanoate))

  • DSM (Dyneema, bio-based polymers)

  • Furanix Technologies (Furanic chemicals, Furandicarboxylic Acid (Furandicarboxylic acid))

  • Genomatica (Butylene glycol, Bio-BDO)

  • Hongye Chemical (Furandicarboxylic Acid, bio-based chemicals)

  • Indorama Ventures (PET (Polyethylene Terephthalate), Bio-PET)

  • Kraton Polymers (SBS (Styrene-Butadiene-Styrene), Hydrogenated Block Copolymer)

  • LG Chem (Bio-PET, Eco-friendly polyesters)

  • Mitsubishi Chemical Corporation (Bio-based Furandicarboxylic Acid, PET)

  • Molekule (Advanced air purification, environmental technologies)

  • Nestle (Plant-based packaging, Sustainable packaging solutions)

  • Novozymes (Enzyme-based solutions, Bio-based chemicals)

  • Origin Materials (Bio-based PET, Sustainable packaging)

  • PTT Global Chemical (Bio-based PET, Polymers)

  • Reverdia (Biosuccinium, bio-based succinic acid)

  • Teijin Limited (Eco-friendly polyester, High-performance polymers)

  • TotalEnergies (Bio-based products, Sustainable chemicals)

Manufacturers:

  • Avantium

  • BASF

  • PTT Global Chemical

  • DuPont

  • Mitsubishi Chemical

Raw Material Suppliers:

  • Archer Daniels Midland Company

  • Cargill

  • DSM

  • Novozymes

Research and Development Firms:

  • Avantium

  • UPM-Kymmene

  • LanzaTech

End-Use Industries:

  • Coca-Cola (Packaging)

  • Unilever (Packaging)

  • Ford (Automotive)

  • Inditex (Textiles)

Distributors and Traders:

  • Brenntag

  • IBC Chemical

  • LyondellBasell

Regulatory Bodies:

  • European Chemicals Agency (ECHA)

  • U.S. Environmental Protection Agency (EPA)

  • Food and Drug Administration (FDA)

Furandicarboxylic Acid Market Report Scope:

Report Attributes Details
Market Size in 2023 US$ 3.7 Billion
Market Size by 2032 US$ 50.6 Billion
CAGR CAGR of 34.0% From 2024 to 2032
Base Year 2023
Forecast Period 2024-2032
Historical Data 2020-2022
Report Scope & Coverage Market Size, Segments Analysis, Competitive  Landscape, Regional Analysis, DROC & SWOT Analysis, Forecast Outlook
Key Segments •By Source (Biological Feedstocks, Fossil-Based Feedstocks)
•By Technology (Biotechnological Processes, Chemical Synthesis)
•By Application (Polyesters, Plasticizers, Solvents, Food and Beverages, Others)
•By End-Use Industry (Packaging, Textiles, Automotive, Construction, Others)
Regional Analysis/Coverage North America (US, Canada, Mexico), Europe (Eastern Europe [Poland, Romania, Hungary, Turkey, Rest of Eastern Europe] Western Europe] Germany, France, UK, Italy, Spain, Netherlands, Switzerland, Austria, Rest of Western Europe]), Asia Pacific (China, India, Japan, South Korea, Vietnam, Singapore, Australia, Rest of Asia Pacific), Middle East & Africa (Middle East [UAE, Egypt, Saudi Arabia, Qatar, Rest of Middle East], Africa [Nigeria, South Africa, Rest of Africa], Latin America (Brazil, Argentina, Colombia, Rest of Latin America)
Company Profiles Avantium, Genomatica, Kraton Polymers, Hongye Chemical, Mitsubishi Chemical Corporation, Corbion, Furanix Technologies, Anellotech, PTT Global Chemical, DSM and other key players
Key Drivers •Innovations in Catalytic Technologies Facilitate Efficient Production of FDCA
•Supportive Regulatory Frameworks and Policies Propel Bio-Based Chemical Adoption
Restraints •High Production Costs and Limited Commercialization Hinder FDCA Market Growth

Frequently Asked Questions

Ans: The Furandicarboxylic Acid Market is expected to grow at a CAGR of 34.0%

Ans: The Furandicarboxylic Acid Market Size was valued at USD 3.7 Billion in 2023 and is expected to reach USD 50.6 Billion by 2032

Ans: A growing focus on sustainability is encouraging industries to adopt Furandicarboxylic Acid-based solutions, particularly for packaging, while emerging markets and advancements in feedstock alternatives are creating new growth opportunities in the bio-based chemicals sector.

Ans: The Furandicarboxylic Acid market is hindered by strong competition from established, cost-effective petrochemical-based alternatives like PET, which dominate supply chains and present challenges for Furandicarboxylic Acid adoption, particularly in price-sensitive industries.

Ans: In 2023, Europe dominated the Furandicarboxylic Acid market with an estimated 40% share, driven by government sustainability initiatives, key industry players like Avantium, and strong demand in sectors such as packaging, automotive, and textiles, supported by policies like the European Green Deal.

1. Introduction

1.1 Market Definition

1.2 Scope (Inclusion and Exclusions)

1.3 Research Assumptions

2. Executive Summary

2.1 Market Overview

2.2 Regional Synopsis

2.3 Competitive Summary

3. Research Methodology

3.1 Top-Down Approach

3.2 Bottom-up Approach

3.3. Data Validation

3.4 Primary Interviews

4. Market Dynamics Impact Analysis

4.1 Market Driving Factors Analysis

4.1.1 Drivers

4.1.2 Restraints

4.1.3 Opportunities

4.1.4 Challenges

4.2 PESTLE Analysis

4.3 Porter’s Five Forces Model

5. Statistical Insights and Trends Reporting

5.1 Investment and Funding Trends, 2023

5.2 Feedstock Prices, by Country, by Region, 2023

5.3 Regulatory Impact, by Country, by Region, 2023

5.4 Supply Chain Challenges and Solutions, by Region, 2023

5.5 Innovation and R&D, by Region, 2023

6. Competitive Landscape

6.1 List of Major Companies, By Region

6.2 Market Share Analysis, By Region

6.3 Product Benchmarking

6.3.1 Product specifications and features

6.3.2 Pricing

6.4 Strategic Initiatives

6.4.1 Marketing and promotional activities

6.4.2 Distribution and supply chain strategies

6.4.3 Expansion plans and new product launches

6.4.4 Strategic partnerships and collaborations

6.5 Technological Advancements

6.6 Market Positioning and Branding

7. Furandicarboxylic Acid Market Segmentation, by Source

7.1 Chapter Overview

7.2 Biological Feedstocks

7.2.1 Biological Feedstocks Market Trends Analysis (2020-2032)

7.2.2 Biological Feedstocks Market Size Estimates and Forecasts to 2032 (USD Billion)

7.3 Fossil-Based Feedstocks

7.3.1 Fossil-Based Feedstocks Market Trends Analysis (2020-2032)

7.3.2 Fossil-Based Feedstocks Market Size Estimates and Forecasts to 2032 (USD Billion)

8. Furandicarboxylic Acid Market Segmentation, by Technology

8.1 Chapter Overview

8.2 Biotechnological Processes

8.2.1 Biotechnological Processes Market Trends Analysis (2020-2032)

8.2.2 Biotechnological Processes Market Size Estimates and Forecasts to 2032 (USD Billion)

8.3 Chemical Synthesis

8.3.1 Chemical Synthesis Market Trends Analysis (2020-2032)

8.3.2 Chemical Synthesis Market Size Estimates and Forecasts to 2032 (USD Billion)

9. Furandicarboxylic Acid Market Segmentation, by Application

9.1 Chapter Overview

9.2 Polyesters

9.2.1 Polyesters Market Trends Analysis (2020-2032)

9.2.2 Polyesters Market Size Estimates and Forecasts to 2032 (USD Billion)

9.3 Plasticizers

9.3.1 Plasticizers Market Trends Analysis (2020-2032)

9.3.2 Plasticizers Market Size Estimates and Forecasts to 2032 (USD Billion)

9.4 Solvents

               9.4.1 Solvents Market Trends Analysis (2020-2032)

9.4.2 Solvents Market Size Estimates and Forecasts to 2032 (USD Billion)

9.5 Food and Beverages

9.5.1 Food and Beverages Market Trends Analysis (2020-2032)

9.5.2 Food and Beverages Market Size Estimates and Forecasts to 2032 (USD Billion)

9.6 Others

9.6.1 Others Market Trends Analysis (2020-2032)

9.6.2 Others Market Size Estimates and Forecasts to 2032 (USD Billion)

10. Furandicarboxylic Acid Market Segmentation, by End-Use Industry

10.1 Chapter Overview

10.2 Packaging

10.2.1 Packaging Market Trends Analysis (2020-2032)

10.2.2 Packaging Market Size Estimates and Forecasts to 2032 (USD Billion)

10.3 Textiles

10.3.1 Textiles Market Trends Analysis (2020-2032)

10.3.2 Textiles Market Size Estimates and Forecasts to 2032 (USD Billion)

10.4 Automotive

               10.4.1 Automotive Market Trends Analysis (2020-2032)

10.4.2 Automotive Market Size Estimates and Forecasts to 2032 (USD Billion)

10.5 Construction

10.5.1 Construction Market Trends Analysis (2020-2032)

10.5.2 Construction Market Size Estimates and Forecasts to 2032 (USD Billion)

10.6 Others

10.6.1 Others Market Trends Analysis (2020-2032)

10.6.2 Others Market Size Estimates and Forecasts to 2032 (USD Billion)

11. Regional Analysis

11.1 Chapter Overview

11.2 North America

11.2.1 Trends Analysis

11.2.2 North America Furandicarboxylic Acid Market Estimates and Forecasts, by Country (2020-2032) (USD Billion)

11.2.3 North America Furandicarboxylic Acid Market Estimates and Forecasts, by Source (2020-2032) (USD Billion)  

11.2.4 North America Furandicarboxylic Acid Market Estimates and Forecasts, by Technology (2020-2032) (USD Billion)

11.2.5 North America Furandicarboxylic Acid Market Estimates and Forecasts, by Application (2020-2032) (USD Billion)

11.2.6 North America Furandicarboxylic Acid Market Estimates and Forecasts, by End-Use Industry (2020-2032) (USD Billion)

11.2.7 USA

11.2.7.1 USA Furandicarboxylic Acid Market Estimates and Forecasts, by Source (2020-2032) (USD Billion)

11.2.7.2 USA Furandicarboxylic Acid Market Estimates and Forecasts, by Technology (2020-2032) (USD Billion)

11.2.7.3 USA Furandicarboxylic Acid Market Estimates and Forecasts, by Application (2020-2032) (USD Billion)

11.2.7.4 USA Furandicarboxylic Acid Market Estimates and Forecasts, by End-Use Industry (2020-2032) (USD Billion)

11.2.8 Canada

11.2.8.1 Canada Furandicarboxylic Acid Market Estimates and Forecasts, by Source (2020-2032) (USD Billion)

11.2.8.2 Canada Furandicarboxylic Acid Market Estimates and Forecasts, by Technology (2020-2032) (USD Billion)

11.2.8.3 Canada Furandicarboxylic Acid Market Estimates and Forecasts, by Application (2020-2032) (USD Billion)

11.2.8.4 Canada Furandicarboxylic Acid Market Estimates and Forecasts, by End-Use Industry (2020-2032) (USD Billion)

11.2.9 Mexico

11.2.9.1 Mexico Furandicarboxylic Acid Market Estimates and Forecasts, by Source (2020-2032) (USD Billion)

11.2.9.2 Mexico Furandicarboxylic Acid Market Estimates and Forecasts, by Technology (2020-2032) (USD Billion)

11.2.9.3 Mexico Furandicarboxylic Acid Market Estimates and Forecasts, by Application (2020-2032) (USD Billion)

11.2.9.4 Mexico Furandicarboxylic Acid Market Estimates and Forecasts, by End-Use Industry (2020-2032) (USD Billion)

11.3 Europe

11.3.1 Eastern Europe

11.3.1.1 Trends Analysis

11.3.1.2 Eastern Europe Furandicarboxylic Acid Market Estimates and Forecasts, by Country (2020-2032) (USD Billion)

11.3.1.3 Eastern Europe Furandicarboxylic Acid Market Estimates and Forecasts, by Source (2020-2032) (USD Billion)  

11.3.1.4 Eastern Europe Furandicarboxylic Acid Market Estimates and Forecasts, by Technology (2020-2032) (USD Billion)

11.3.1.5 Eastern Europe Furandicarboxylic Acid Market Estimates and Forecasts, by Application (2020-2032) (USD Billion)

11.3.1.6 Eastern Europe Furandicarboxylic Acid Market Estimates and Forecasts, by End-Use Industry (2020-2032) (USD Billion)

11.3.1.7 Poland

11.3.1.7.1 Poland Furandicarboxylic Acid Market Estimates and Forecasts, by Source (2020-2032) (USD Billion)

11.3.1.7.2 Poland Furandicarboxylic Acid Market Estimates and Forecasts, by Technology (2020-2032) (USD Billion)

11.3.1.7.3 Poland Furandicarboxylic Acid Market Estimates and Forecasts, by Application (2020-2032) (USD Billion)

11.3.1.7.4 Poland Furandicarboxylic Acid Market Estimates and Forecasts, by End-Use Industry (2020-2032) (USD Billion)

11.3.1.8 Romania

11.3.1.8.1 Romania Furandicarboxylic Acid Market Estimates and Forecasts, by Source (2020-2032) (USD Billion)

11.3.1.8.2 Romania Furandicarboxylic Acid Market Estimates and Forecasts, by Technology (2020-2032) (USD Billion)

11.3.1.8.3 Romania Furandicarboxylic Acid Market Estimates and Forecasts, by Application (2020-2032) (USD Billion)

11.3.1.8.4 Romania Furandicarboxylic Acid Market Estimates and Forecasts, by End-Use Industry (2020-2032) (USD Billion)

11.3.1.9 Hungary

11.3.1.9.1 Hungary Furandicarboxylic Acid Market Estimates and Forecasts, by Source (2020-2032) (USD Billion)

11.3.1.9.2 Hungary Furandicarboxylic Acid Market Estimates and Forecasts, by Technology (2020-2032) (USD Billion)

11.3.1.9.3 Hungary Furandicarboxylic Acid Market Estimates and Forecasts, by Application (2020-2032) (USD Billion)

11.3.1.9.4 Hungary Furandicarboxylic Acid Market Estimates and Forecasts, by End-Use Industry (2020-2032) (USD Billion)

11.3.1.10 Turkey

11.3.1.10.1 Turkey Furandicarboxylic Acid Market Estimates and Forecasts, by Source (2020-2032) (USD Billion)

11.3.1.10.2 Turkey Furandicarboxylic Acid Market Estimates and Forecasts, by Technology (2020-2032) (USD Billion)

11.3.1.10.3 Turkey Furandicarboxylic Acid Market Estimates and Forecasts, by Application (2020-2032) (USD Billion)

11.3.1.10.4 Turkey Furandicarboxylic Acid Market Estimates and Forecasts, by End-Use Industry (2020-2032) (USD Billion)

11.3.1.11 Rest of Eastern Europe

11.3.1.11.1 Rest of Eastern Europe Furandicarboxylic Acid Market Estimates and Forecasts, by Source (2020-2032) (USD Billion)

11.3.1.11.2 Rest of Eastern Europe Furandicarboxylic Acid Market Estimates and Forecasts, by Technology (2020-2032) (USD Billion)

11.3.1.11.3 Rest of Eastern Europe Furandicarboxylic Acid Market Estimates and Forecasts, by Application (2020-2032) (USD Billion)

11.3.1.11.4 Rest of Eastern Europe Furandicarboxylic Acid Market Estimates and Forecasts, by End-Use Industry (2020-2032) (USD Billion)

11.3.2 Western Europe

11.3.2.1 Trends Analysis

11.3.2.2 Western Europe Furandicarboxylic Acid Market Estimates and Forecasts, by Country (2020-2032) (USD Billion)

11.3.2.3 Western Europe Furandicarboxylic Acid Market Estimates and Forecasts, by Source (2020-2032) (USD Billion)  

11.3.2.4 Western Europe Furandicarboxylic Acid Market Estimates and Forecasts, by Technology (2020-2032) (USD Billion)

11.3.2.5 Western Europe Furandicarboxylic Acid Market Estimates and Forecasts, by Application (2020-2032) (USD Billion)

11.3.2.6 Western Europe Furandicarboxylic Acid Market Estimates and Forecasts, by End-Use Industry (2020-2032) (USD Billion)

11.3.2.7 Germany

11.3.2.7.1 Germany Furandicarboxylic Acid Market Estimates and Forecasts, by Source (2020-2032) (USD Billion)

11.3.2.7.2 Germany Furandicarboxylic Acid Market Estimates and Forecasts, by Technology (2020-2032) (USD Billion)

11.3.2.7.3 Germany Furandicarboxylic Acid Market Estimates and Forecasts, by Application (2020-2032) (USD Billion)

11.3.2.7.4 Germany Furandicarboxylic Acid Market Estimates and Forecasts, by End-Use Industry (2020-2032) (USD Billion)

11.3.2.8 France

11.3.2.8.1 France Furandicarboxylic Acid Market Estimates and Forecasts, by Source (2020-2032) (USD Billion)

11.3.2.8.2 France Furandicarboxylic Acid Market Estimates and Forecasts, by Technology (2020-2032) (USD Billion)

11.3.2.8.3 France Furandicarboxylic Acid Market Estimates and Forecasts, by Application (2020-2032) (USD Billion)

11.3.2.8.4 France Furandicarboxylic Acid Market Estimates and Forecasts, by End-Use Industry (2020-2032) (USD Billion)

11.3.2.9 UK

11.3.2.9.1 UK Furandicarboxylic Acid Market Estimates and Forecasts, by Source (2020-2032) (USD Billion)

11.3.2.9.2 UK Furandicarboxylic Acid Market Estimates and Forecasts, by Technology (2020-2032) (USD Billion)

11.3.2.9.3 UK Furandicarboxylic Acid Market Estimates and Forecasts, by Application (2020-2032) (USD Billion)

11.3.2.9.4 UK Furandicarboxylic Acid Market Estimates and Forecasts, by End-Use Industry (2020-2032) (USD Billion)

11.3.2.10 Italy

11.3.2.10.1 Italy Furandicarboxylic Acid Market Estimates and Forecasts, by Source (2020-2032) (USD Billion)

11.3.2.10.2 Italy Furandicarboxylic Acid Market Estimates and Forecasts, by Technology (2020-2032) (USD Billion)

11.3.2.10.3 Italy Furandicarboxylic Acid Market Estimates and Forecasts, by Application (2020-2032) (USD Billion)

11.3.2.10.4 Italy Furandicarboxylic Acid Market Estimates and Forecasts, by End-Use Industry (2020-2032) (USD Billion)

11.3.2.11 Spain

11.3.2.11.1 Spain Furandicarboxylic Acid Market Estimates and Forecasts, by Source (2020-2032) (USD Billion)

11.3.2.11.2 Spain Furandicarboxylic Acid Market Estimates and Forecasts, by Technology (2020-2032) (USD Billion)

11.3.2.11.3 Spain Furandicarboxylic Acid Market Estimates and Forecasts, by Application (2020-2032) (USD Billion)

11.3.2.11.4 Spain Furandicarboxylic Acid Market Estimates and Forecasts, by End-Use Industry (2020-2032) (USD Billion)

11.3.2.12 Netherlands

11.3.2.12.1 Netherlands Furandicarboxylic Acid Market Estimates and Forecasts, by Source (2020-2032) (USD Billion)

11.3.2.12.2 Netherlands Furandicarboxylic Acid Market Estimates and Forecasts, by Technology (2020-2032) (USD Billion)

11.3.2.12.3 Netherlands Furandicarboxylic Acid Market Estimates and Forecasts, by Application (2020-2032) (USD Billion)

11.3.2.12.4 Netherlands Furandicarboxylic Acid Market Estimates and Forecasts, by End-Use Industry (2020-2032) (USD Billion)

11.3.2.13 Switzerland

11.3.2.13.1 Switzerland Furandicarboxylic Acid Market Estimates and Forecasts, by Source (2020-2032) (USD Billion)

11.3.2.13.2 Switzerland Furandicarboxylic Acid Market Estimates and Forecasts, by Technology (2020-2032) (USD Billion)

11.3.2.13.3 Switzerland Furandicarboxylic Acid Market Estimates and Forecasts, by Application (2020-2032) (USD Billion)

11.3.2.13.4 Switzerland Furandicarboxylic Acid Market Estimates and Forecasts, by End-Use Industry (2020-2032) (USD Billion)

11.3.2.14 Austria

11.3.2.14.1 Austria Furandicarboxylic Acid Market Estimates and Forecasts, by Source (2020-2032) (USD Billion)

11.3.2.14.2 Austria Furandicarboxylic Acid Market Estimates and Forecasts, by Technology (2020-2032) (USD Billion)

11.3.2.14.3 Austria Furandicarboxylic Acid Market Estimates and Forecasts, by Application (2020-2032) (USD Billion)

11.3.2.14.4 Austria Furandicarboxylic Acid Market Estimates and Forecasts, by End-Use Industry (2020-2032) (USD Billion)

11.3.2.15 Rest of Western Europe

11.3.2.15.1 Rest of Western Europe Furandicarboxylic Acid Market Estimates and Forecasts, by Source (2020-2032) (USD Billion)

11.3.2.15.2 Rest of Western Europe Furandicarboxylic Acid Market Estimates and Forecasts, by Technology (2020-2032) (USD Billion)

11.3.2.15.3 Rest of Western Europe Furandicarboxylic Acid Market Estimates and Forecasts, by Application (2020-2032) (USD Billion)

11.3.2.15.4 Rest of Western Europe Furandicarboxylic Acid Market Estimates and Forecasts, by End-Use Industry (2020-2032) (USD Billion)

11.4 Asia Pacific

11.4.1 Trends Analysis

11.4.2 Asia Pacific Furandicarboxylic Acid Market Estimates and Forecasts, by Country (2020-2032) (USD Billion)

11.4.3 Asia Pacific Furandicarboxylic Acid Market Estimates and Forecasts, by Source (2020-2032) (USD Billion)  

11.4.4 Asia Pacific Furandicarboxylic Acid Market Estimates and Forecasts, by Technology (2020-2032) (USD Billion)

11.4.5 Asia Pacific Furandicarboxylic Acid Market Estimates and Forecasts, by Application (2020-2032) (USD Billion)

11.4.6 Asia Pacific Furandicarboxylic Acid Market Estimates and Forecasts, by End-Use Industry (2020-2032) (USD Billion)

11.4.7 China

11.4.7.1 China Furandicarboxylic Acid Market Estimates and Forecasts, by Source (2020-2032) (USD Billion)

11.4.7.2 China Furandicarboxylic Acid Market Estimates and Forecasts, by Technology (2020-2032) (USD Billion)

11.4.7.3 China Furandicarboxylic Acid Market Estimates and Forecasts, by Application (2020-2032) (USD Billion)

11.4.7.4 China Furandicarboxylic Acid Market Estimates and Forecasts, by End-Use Industry (2020-2032) (USD Billion)

11.4.8 India

11.4.8.1 India Furandicarboxylic Acid Market Estimates and Forecasts, by Source (2020-2032) (USD Billion)

11.4.8.2 India Furandicarboxylic Acid Market Estimates and Forecasts, by Technology (2020-2032) (USD Billion)

11.4.8.3 India Furandicarboxylic Acid Market Estimates and Forecasts, by Application (2020-2032) (USD Billion)

11.4.8.4 India Furandicarboxylic Acid Market Estimates and Forecasts, by End-Use Industry (2020-2032) (USD Billion)

11.4.9 Japan

11.4.9.1 Japan Furandicarboxylic Acid Market Estimates and Forecasts, by Source (2020-2032) (USD Billion)

11.4.9.2 Japan Furandicarboxylic Acid Market Estimates and Forecasts, by Technology (2020-2032) (USD Billion)

11.4.9.3 Japan Furandicarboxylic Acid Market Estimates and Forecasts, by Application (2020-2032) (USD Billion)

11.4.9.4 Japan Furandicarboxylic Acid Market Estimates and Forecasts, by End-Use Industry (2020-2032) (USD Billion)

11.4.10 South Korea

11.4.10.1 South Korea Furandicarboxylic Acid Market Estimates and Forecasts, by Source (2020-2032) (USD Billion)

11.4.10.2 South Korea Furandicarboxylic Acid Market Estimates and Forecasts, by Technology (2020-2032) (USD Billion)

11.4.10.3 South Korea Furandicarboxylic Acid Market Estimates and Forecasts, by Application (2020-2032) (USD Billion)

11.4.10.4 South Korea Furandicarboxylic Acid Market Estimates and Forecasts, by End-Use Industry (2020-2032) (USD Billion)

11.4.11 Vietnam

11.4.11.1 Vietnam Furandicarboxylic Acid Market Estimates and Forecasts, by Source (2020-2032) (USD Billion)

11.4.11.2 Vietnam Furandicarboxylic Acid Market Estimates and Forecasts, by Technology (2020-2032) (USD Billion)

11.4.11.3 Vietnam Furandicarboxylic Acid Market Estimates and Forecasts, by Application (2020-2032) (USD Billion)

11.4.11.4 Vietnam Furandicarboxylic Acid Market Estimates and Forecasts, by End-Use Industry (2020-2032) (USD Billion)

11.4.12 Singapore

11.4.12.1 Singapore Furandicarboxylic Acid Market Estimates and Forecasts, by Source (2020-2032) (USD Billion)

11.4.12.2 Singapore Furandicarboxylic Acid Market Estimates and Forecasts, by Technology (2020-2032) (USD Billion)

11.4.12.3 Singapore Furandicarboxylic Acid Market Estimates and Forecasts, by Application (2020-2032) (USD Billion)

11.4.12.4 Singapore Furandicarboxylic Acid Market Estimates and Forecasts, by End-Use Industry (2020-2032) (USD Billion)

11.4.13 Australia

11.4.13.1 Australia Furandicarboxylic Acid Market Estimates and Forecasts, by Source (2020-2032) (USD Billion)

11.4.13.2 Australia Furandicarboxylic Acid Market Estimates and Forecasts, by Technology (2020-2032) (USD Billion)

11.4.13.3 Australia Furandicarboxylic Acid Market Estimates and Forecasts, by Application (2020-2032) (USD Billion)

11.4.13.4 Australia Furandicarboxylic Acid Market Estimates and Forecasts, by End-Use Industry (2020-2032) (USD Billion)

11.4.14 Rest of Asia Pacific

11.4.14.1 Rest of Asia Pacific Furandicarboxylic Acid Market Estimates and Forecasts, by Source (2020-2032) (USD Billion)

11.4.14.2 Rest of Asia Pacific Furandicarboxylic Acid Market Estimates and Forecasts, by Technology (2020-2032) (USD Billion)

11.4.14.3 Rest of Asia Pacific Furandicarboxylic Acid Market Estimates and Forecasts, by Application (2020-2032) (USD Billion)

11.4.14.4 Rest of Asia Pacific Furandicarboxylic Acid Market Estimates and Forecasts, by End-Use Industry (2020-2032) (USD Billion)

11.5 Middle East and Africa

11.5.1 Middle East

11.5.1.1 Trends Analysis

11.5.1.2 Middle East Furandicarboxylic Acid Market Estimates and Forecasts, by Country (2020-2032) (USD Billion)

11.5.1.3 Middle East Furandicarboxylic Acid Market Estimates and Forecasts, by Source (2020-2032) (USD Billion)  

11.5.1.4 Middle East Furandicarboxylic Acid Market Estimates and Forecasts, by Technology (2020-2032) (USD Billion)

11.5.1.5 Middle East Furandicarboxylic Acid Market Estimates and Forecasts, by Application (2020-2032) (USD Billion)

11.5.1.6 Middle East Furandicarboxylic Acid Market Estimates and Forecasts, by End-Use Industry (2020-2032) (USD Billion)

11.5.1.7 UAE

11.5.1.7.1 UAE Furandicarboxylic Acid Market Estimates and Forecasts, by Source (2020-2032) (USD Billion)

11.5.1.7.2 UAE Furandicarboxylic Acid Market Estimates and Forecasts, by Technology (2020-2032) (USD Billion)

11.5.1.7.3 UAE Furandicarboxylic Acid Market Estimates and Forecasts, by Application (2020-2032) (USD Billion)

11.5.1.7.4 UAE Furandicarboxylic Acid Market Estimates and Forecasts, by End-Use Industry  (2020-2032) (USD Billion)

11.5.1.8 Egypt

11.5.1.8.1 Egypt Furandicarboxylic Acid Market Estimates and Forecasts, by Source (2020-2032) (USD Billion)

11.5.1.8.2 Egypt Furandicarboxylic Acid Market Estimates and Forecasts, by Technology (2020-2032) (USD Billion)

11.5.1.8.3 Egypt Furandicarboxylic Acid Market Estimates and Forecasts, by Application (2020-2032) (USD Billion)

11.5.1.8.4 Egypt Furandicarboxylic Acid Market Estimates and Forecasts, by End-Use Industry (2020-2032) (USD Billion)

11.5.1.9 Saudi Arabia

11.5.1.9.1 Saudi Arabia Furandicarboxylic Acid Market Estimates and Forecasts, by Source (2020-2032) (USD Billion)

11.5.1.9.2 Saudi Arabia Furandicarboxylic Acid Market Estimates and Forecasts, by Technology (2020-2032) (USD Billion)

11.5.1.9.3 Saudi Arabia Furandicarboxylic Acid Market Estimates and Forecasts, by Application (2020-2032) (USD Billion)

11.5.1.9.4 Saudi Arabia Furandicarboxylic Acid Market Estimates and Forecasts, by End-Use Industry (2020-2032) (USD Billion)

11.5.1.10 Qatar

11.5.1.10.1 Qatar Furandicarboxylic Acid Market Estimates and Forecasts, by Source (2020-2032) (USD Billion)

11.5.1.10.2 Qatar Furandicarboxylic Acid Market Estimates and Forecasts, by Technology (2020-2032) (USD Billion)

11.5.1.10.3 Qatar Furandicarboxylic Acid Market Estimates and Forecasts, by Application (2020-2032) (USD Billion)

11.5.1.10.4 Qatar Furandicarboxylic Acid Market Estimates and Forecasts, by End-Use Industry (2020-2032) (USD Billion)

11.5.1.11 Rest of Middle East

11.5.1.11.1 Rest of Middle East Furandicarboxylic Acid Market Estimates and Forecasts, by Source (2020-2032) (USD Billion)

11.5.1.11.2 Rest of Middle East Furandicarboxylic Acid Market Estimates and Forecasts, by Technology (2020-2032) (USD Billion)

11.5.1.11.3 Rest of Middle East Furandicarboxylic Acid Market Estimates and Forecasts, by Application (2020-2032) (USD Billion)

11.5.1.11.4 Rest of Middle East Furandicarboxylic Acid Market Estimates and Forecasts, by End-Use Industry (2020-2032) (USD Billion)

11.5.2 Africa

11.5.2.1 Trends Analysis

11.5.2.2 Africa Furandicarboxylic Acid Market Estimates and Forecasts, by Country (2020-2032) (USD Billion)

11.5.2.3 Africa Furandicarboxylic Acid Market Estimates and Forecasts, by Source (2020-2032) (USD Billion)  

11.5.2.4 Africa Furandicarboxylic Acid Market Estimates and Forecasts, by Technology (2020-2032) (USD Billion)

11.5.2.5 Africa Furandicarboxylic Acid Market Estimates and Forecasts, by Application (2020-2032) (USD Billion)

11.5.2.6 Africa Furandicarboxylic Acid Market Estimates and Forecasts, by End-Use Industry (2020-2032) (USD Billion)

11.5.2.7 South Africa

11.5.2.7.1 South Africa Furandicarboxylic Acid Market Estimates and Forecasts, by Source (2020-2032) (USD Billion)

11.5.2.7.2 South Africa Furandicarboxylic Acid Market Estimates and Forecasts, by Technology (2020-2032) (USD Billion)

11.5.2.7.3 South Africa Furandicarboxylic Acid Market Estimates and Forecasts, by Application (2020-2032) (USD Billion)

11.5.2.7.4 South Africa Furandicarboxylic Acid Market Estimates and Forecasts, by End-Use Industry (2020-2032) (USD Billion)

11.5.2.8 Nigeria

11.5.2.8.1 Nigeria Furandicarboxylic Acid Market Estimates and Forecasts, by Source (2020-2032) (USD Billion)

11.5.2.8.2 Nigeria Furandicarboxylic Acid Market Estimates and Forecasts, by Technology (2020-2032) (USD Billion)

11.5.2.8.3 Nigeria Furandicarboxylic Acid Market Estimates and Forecasts, by Application (2020-2032) (USD Billion)

11.5.2.8.4 Nigeria Furandicarboxylic Acid Market Estimates and Forecasts, by End-Use Industry (2020-2032) (USD Billion)

11.5.2.9 Rest of Africa

11.5.2.9.1 Rest of Africa Furandicarboxylic Acid Market Estimates and Forecasts, by Source (2020-2032) (USD Billion)

11.5.2.9.2 Rest of Africa Furandicarboxylic Acid Market Estimates and Forecasts, by Technology (2020-2032) (USD Billion)

11.5.2.9.3 Rest of Africa Furandicarboxylic Acid Market Estimates and Forecasts, by Application (2020-2032) (USD Billion)

11.5.2.9.4 Rest of Africa Furandicarboxylic Acid Market Estimates and Forecasts, by End-Use Industry (2020-2032) (USD Billion)

11.6 Latin America

11.6.1 Trends Analysis

11.6.2 Latin America Furandicarboxylic Acid Market Estimates and Forecasts, by Country (2020-2032) (USD Billion)

11.6.3 Latin America Furandicarboxylic Acid Market Estimates and Forecasts, by Source (2020-2032) (USD Billion)  

11.6.4 Latin America Furandicarboxylic Acid Market Estimates and Forecasts, by Technology (2020-2032) (USD Billion)

11.6.5 Latin America Furandicarboxylic Acid Market Estimates and Forecasts, by Application (2020-2032) (USD Billion)

11.6.6 Latin America Furandicarboxylic Acid Market Estimates and Forecasts, by End-Use Industry (2020-2032) (USD Billion)

11.6.7 Brazil

11.6.7.1 Brazil Furandicarboxylic Acid Market Estimates and Forecasts, by Source (2020-2032) (USD Billion)

11.6.7.2 Brazil Furandicarboxylic Acid Market Estimates and Forecasts, by Technology (2020-2032) (USD Billion)

11.6.7.3 Brazil Furandicarboxylic Acid Market Estimates and Forecasts, by Application (2020-2032) (USD Billion)

11.6.7.4 Brazil Furandicarboxylic Acid Market Estimates and Forecasts, by End-Use Industry (2020-2032) (USD Billion)

11.6.8 Argentina

11.6.8.1 Argentina Furandicarboxylic Acid Market Estimates and Forecasts, by Source (2020-2032) (USD Billion)

11.6.8.2 Argentina Furandicarboxylic Acid Market Estimates and Forecasts, by Technology (2020-2032) (USD Billion)

11.6.8.3 Argentina Furandicarboxylic Acid Market Estimates and Forecasts, by Application (2020-2032) (USD Billion)

11.6.8.4 Argentina Furandicarboxylic Acid Market Estimates and Forecasts, by End-Use Industry (2020-2032) (USD Billion)

11.6.9 Colombia

11.6.9.1 Colombia Furandicarboxylic Acid Market Estimates and Forecasts, by Source (2020-2032) (USD Billion)

11.6.9.2 Colombia Furandicarboxylic Acid Market Estimates and Forecasts, by Technology (2020-2032) (USD Billion)

11.6.9.3 Colombia Furandicarboxylic Acid Market Estimates and Forecasts, by Application (2020-2032) (USD Billion)

11.6.9.4 Colombia Furandicarboxylic Acid Market Estimates and Forecasts, by End-Use Industry (2020-2032) (USD Billion)

11.6.10 Rest of Latin America

11.6.10.1 Rest of Latin America Furandicarboxylic Acid Market Estimates and Forecasts, by Source (2020-2032) (USD Billion)

11.6.10.2 Rest of Latin America Furandicarboxylic Acid Market Estimates and Forecasts, by Technology (2020-2032) (USD Billion)

11.6.10.3 Rest of Latin America Furandicarboxylic Acid Market Estimates and Forecasts, by Application (2020-2032) (USD Billion)

11.6.10.4 Rest of Latin America Furandicarboxylic Acid Market Estimates and Forecasts, by End-Use Industry (2020-2032) (USD Billion)

12. Company Profiles

12.1 Avantium

12.1.1 Company Overview

12.1.2 Financial

12.1.3 Products/ Services Offered

12.1.4 SWOT Analysis

12.2 Genomatica

12.2.1 Company Overview

12.2.2 Financial

12.2.3 Products/ Services Offered

12.2.4 SWOT Analysis

12.3 Kraton Polymers

12.3.1 Company Overview

12.3.2 Financial

12.3.3 Products/ Services Offered

12.3.4 SWOT Analysis

12.4 Hongye Chemical

12.4.1 Company Overview

12.4.2 Financial

12.4.3 Products/ Services Offered

12.4.4 SWOT Analysis

12.5 Mitsubishi Chemical Corporation

12.5.1 Company Overview

12.5.2 Financial

12.5.3 Products/ Services Offered

12.5.4 SWOT Analysis

12.6 Corbion

12.6.1 Company Overview

12.6.2 Financial

12.6.3 Products/ Services Offered

12.6.4 SWOT Analysis

12.7 Furanix Technologies

12.7.1 Company Overview

12.7.2 Financial

12.7.3 Products/ Services Offered

12.7.4 SWOT Analysis

12.8 Anellotech

12.8.1 Company Overview

12.8.2 Financial

12.8.3 Products/ Services Offered

12.8.4 SWOT Analysis

12.9 PTT Global Chemical

12.9.1 Company Overview

12.9.2 Financial

12.9.3 Products/ Services Offered

12.9.4 SWOT Analysis

12.10 DSM

12.10.1 Company Overview

12.10.2 Financial

12.10.3 Products/ Services Offered

12.10.4 SWOT Analysis

13. Use Cases and Best Practices

14. Conclusion

An accurate research report requires proper strategizing as well as implementation. There are multiple factors involved in the completion of good and accurate research report and selecting the best methodology to compete the research is the toughest part. Since the research reports we provide play a crucial role in any company’s decision-making process, therefore we at SNS Insider always believe that we should choose the best method which gives us results closer to reality. This allows us to reach at a stage wherein we can provide our clients best and accurate investment to output ratio.

Each report that we prepare takes a timeframe of 350-400 business hours for production. Starting from the selection of titles through a couple of in-depth brain storming session to the final QC process before uploading our titles on our website we dedicate around 350 working hours. The titles are selected based on their current market cap and the foreseen CAGR and growth.


The 5 steps process:

Step 1: Secondary Research:

Secondary Research or Desk Research is as the name suggests is a research process wherein, we collect data through the readily available information. In this process we use various paid and unpaid databases which our team has access to and gather data through the same. This includes examining of listed companies’ annual reports, Journals, SEC filling etc. Apart from this our team has access to various associations across the globe across different industries. Lastly, we have exchange relationships with various university as well as individual libraries.

Secondary Research

Step 2: Primary Research

When we talk about primary research, it is a type of study in which the researchers collect relevant data samples directly, rather than relying on previously collected data.  This type of research is focused on gaining content specific facts that can be sued to solve specific problems. Since the collected data is fresh and first hand therefore it makes the study more accurate and genuine.

We at SNS Insider have divided Primary Research into 2 parts.

Part 1 wherein we interview the KOLs of major players as well as the upcoming ones across various geographic regions. This allows us to have their view over the market scenario and acts as an important tool to come closer to the accurate market numbers. As many as 45 paid and unpaid primary interviews are taken from both the demand and supply side of the industry to make sure we land at an accurate judgement and analysis of the market.

This step involves the triangulation of data wherein our team analyses the interview transcripts, online survey responses and observation of on filed participants. The below mentioned chart should give a better understanding of the part 1 of the primary interview.

Primary Research

Part 2: In this part of primary research the data collected via secondary research and the part 1 of the primary research is validated with the interviews from individual consultants and subject matter experts.

Consultants are those set of people who have at least 12 years of experience and expertise within the industry whereas Subject Matter Experts are those with at least 15 years of experience behind their back within the same space. The data with the help of two main processes i.e., FGDs (Focused Group Discussions) and IDs (Individual Discussions). This gives us a 3rd party nonbiased primary view of the market scenario making it a more dependable one while collation of the data pointers.

Step 3: Data Bank Validation

Once all the information is collected via primary and secondary sources, we run that information for data validation. At our intelligence centre our research heads track a lot of information related to the market which includes the quarterly reports, the daily stock prices, and other relevant information. Our data bank server gets updated every fortnight and that is how the information which we collected using our primary and secondary information is revalidated in real time.

Data Bank Validation

Step 4: QA/QC Process

After all the data collection and validation our team does a final level of quality check and quality assurance to get rid of any unwanted or undesired mistakes. This might include but not limited to getting rid of the any typos, duplication of numbers or missing of any important information. The people involved in this process include technical content writers, research heads and graphics people. Once this process is completed the title gets uploader on our platform for our clients to read it.

Step 5: Final QC/QA Process:

This is the last process and comes when the client has ordered the study. In this process a final QA/QC is done before the study is emailed to the client. Since we believe in giving our clients a good experience of our research studies, therefore, to make sure that we do not lack at our end in any way humanly possible we do a final round of quality check and then dispatch the study to the client.

Key Segments:

By Source

  • Biological Feedstocks

  • Fossil-Based Feedstocks

By Technology

  • Biotechnological Processes

  • Chemical Synthesis

By Application

  • Polyesters

  • Plasticizers

  • Solvents

  • Food and Beverages

  • Others

By End-Use Industry

  • Packaging

  • Textiles

  • Automotive

  • Construction

  • Others

Request for Segment Customization as per your Business Requirement: Segment Customization Request

Regional Coverage:

North America

  • US

  • Canada

  • Mexico

Europe

  • Eastern Europe

    • Poland

    • Romania

    • Hungary

    • Turkey

    • Rest of Eastern Europe

  • Western Europe

    • Germany

    • France

    • UK

    • Italy

    • Spain

    • Netherlands

    • Switzerland

    • Austria

    • Rest of Western Europe

Asia Pacific

  • China

  • India

  • Japan

  • South Korea

  • Vietnam

  • Singapore

  • Australia

  • Rest of Asia Pacific

Middle East & Africa

  • Middle East

    • UAE

    • Egypt

    • Saudi Arabia

    • Qatar

    • Rest of Middle East

  • Africa

    • Nigeria

    • South Africa

    • Rest of Africa

Latin America

  • Brazil

  • Argentina

  • Colombia

  • Rest of Latin America

Request for Country Level Research Report: Country Level Customization Request

Available Customization

  • With the given market data, SNS Insider offers customization as per the company’s specific needs. The following customization options are available for the report:

  • Product Analysis

  • Criss-Cross segment analysis (e.g. Product X Application)

  • Product Matrix which gives a detailed comparison of product portfolio of each company

  • Geographic Analysis

  • Additional countries in any of the regions

  • Company Information

  • Detailed analysis and profiling of additional market players (Up to five)


  •            5000 (33% Discount)


  •            8950 (40% Discount)


  •            3050 (23% Discount)

Start a Conversation

Hi! Click one of our member below to chat on Phone