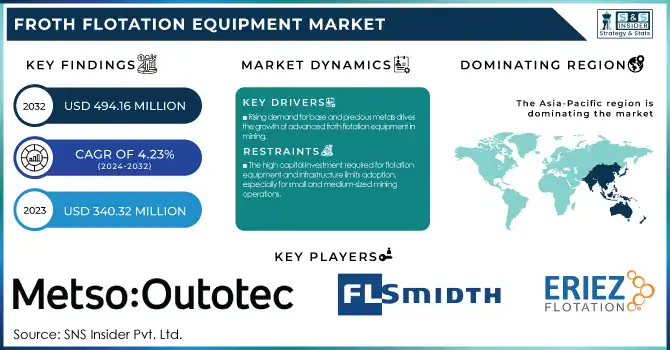
The Froth Flotation Equipment Market Size was estimated at USD 340.32 million in 2023 and is supposed to arrive at USD 494.16 million by 2032 with a growing CAGR of 4.23% over the forecast period 2024-2032. This report uniquely explores production volume trends and utilization rates of froth flotation equipment across key regions, highlighting operational efficiency benchmarks and downtime analysis. It examines the adoption of emerging technologies, such as AI-driven process optimization, and regional export-import dynamics shaping the global supply chain. Additionally, the study delves into sustainability-driven innovations, including the rising adoption of bio-based flotation reagents and energy-efficient designs, providing a forward-looking perspective on the industry's technological evolution.
To Get more information on Froth Flotation Equipment Market - Request Free Sample Report
Drivers
The rising demand for base and precious metals, driven by industrialization and renewable energy needs, is fueling the growth of advanced froth flotation equipment in mining operations.
The increasing demand for minerals and metals, including base metals such as copper, lead, and zinc, as well as precious metals like gold and silver, is significantly driving the growth of the froth flotation equipment market. Therefore, demand for froth flotation equipment is increasing, mineral & metal demand is also increasing, such as base metals like copper, lead, zinc, and precious metals like silver & gold, which contributes to increasing the growth of the froth flotation equipment market. To meet the increasing demand for raw materials, mining activities have escalated alongside the rapid industrialization, urbanization, and infrastructure growth in emerging economies. Moreover, the growing use of electric vehicles (EVs) and renewable energy technologies has increased the need for critical minerals such as lithium and rare earth elements, thus enhancing the market. Higher efficiency, automation and sustainability in froth flotation systems are becoming the norm. The process is characterized by the analysis of the current system process, the introduction of new floatation reagents (biological floatation reagents, automation) with the dual goal of minimizing environmental impact while also improving overall hydration, the transition to eco-friendly processes, and the adoption of the Internet of Things to streamline processes. With the global expansion of mining operations, the froth flotation equipment market is likely to grow steadily in the coming years.
Restraint
The high capital investment required for flotation equipment and infrastructure limits adoption, especially for small and medium-sized mining operations.
The high initial investment costs associated with froth flotation equipment pose a significant barrier to adoption, particularly for small and medium-sized mining operations. Establishing a flotation system involves a considerable investment (in advanced equipment, infrastructure, and automation technology). Moreover, expenses associated with installation, regulatory compliance, and operator training add to the financial implications. Small-scale mining operations have difficulties finding financing or justify investing, given the uncertainty of returns and the volatility of mineral prices. Additionally, the upkeep and running costs associated with flotation machinery, such as energy usage and reagent expenses, contribute to the financial burden. Large corporations can disperse these costs more easily through economies of scale, while smaller players will typically look to alternative separation methods and utilize equipment to minimize costs. This leads to a fundamental limitation of the market spread, especially in the underdeveloped world where the financial flow and technology access are highly gravitational.
Opportunities
The integration of AI and IoT in flotation systems enhances real-time monitoring, automation, and efficiency while reducing costs and resource consumption.
The integration of Artificial Intelligence (AI) and the Internet of Things (IoT) in flotation systems is revolutionizing mineral processing by enabling real-time monitoring, automation, and predictive analytics. AI-powered algorithms sift and analyze enormous datasets generated by flotation circuits to optimize inputs such as reagent dosage, air flow, and froth stability that result in both higher quality separation and improved recovery rates. Internet of Things (IoT) enabled sensors help in the continuous monitoring of parameters, like pH, pulp density, and bubble type; thus, allowing modifying the operation based on real-time analytics. By trialing predictive maintenance, machine learning reduces human intervention, minimizes operational expenditure, and increases the equipment's life cycle by anticipating maintenance before failures happen. Moreover, AI-driven predictive modeling helps mining companies manage the variability of ore and operate optimally. These systems not only help maximize profitability, but also improve sustainability by minimizing waste, energy, and water consumption in flotation. With the industry moving towards digital transformation, the implementation of AI and IoT in flotation processes is predicted to increase, allowing efficiency and competitiveness for mineral processing.
Challenges
The shortage of skilled personnel in developing regions hampers efficient operation, maintenance, and adoption of advanced froth flotation systems.
The shortage of a skilled workforce is a significant challenge in the froth flotation equipment market, particularly in developing regions where technical expertise is scarce. It needs expertise in areas of process optimization, reagent selection, and equipment troubleshooting for operating and maintaining flotation systems. But poorly trained operators will result in inefficient operations, longer downtimes, and lower recovery rates. This has been a challenge for many mining and processing companies that resulted in resorting to expensive tutorial or expatriate work. Moreover, as flotation technology is evolving with automation and digitalization, the need for highly-skilled technicians is growing, which is exacerbating the skills shortage. The lack of trained personnel not only reduces operational efficiency, but is also impeding the deployment of revolutionary flotation systems. To tackle this challenge, there is a need to invest more in vocational training programs, industry-academic partnerships and on-site technical training to create a skilled workforce that can effectively manage the state-of-the-art flotation processes.
By Type
The Cell-to-Cell Flotation segment dominated with a market share of over 62% in 2023, as it is more efficient for the recovery of valuable minerals and provides better control of the flotation circuits. Flotation equipment of this kind has independent cell operations, addressing the higher material loss challenge and promoting better recovery rates. Market dominance is further ensured by its widespread adoption in mineral processing industries; particularly in metallurgical and mining industries. Furthermore, the Cell-to-Cell Flotation also provides greater versatility, allowing it to work more effectively with several types of ores such as base metal, precious metal, or industrial minerals. This segment is appeased due to mining activities and requirement powerful technologies for minerals extraction in prominent areas globally.
By Application
The mineral and ore processing segment dominated with the market share of over 64% in 2023, driven by the mining industry's increasing demand for efficient extraction methods. Froth flotation plays a crucial role in separating valuable minerals like copper, gold, and iron from ore, improving yield and reducing processing costs. Industries are increasingly using flotation technology to recover the majority of what they can from lower-grade deposits as high grade ores run out. Moreover, improved flotation reagents and machinery also improve efficiency and hence cement the position of this segment. Expanding investment in mining projects and increasing consumption of metals by industry, such as construction and electronics, further support growth of the market, which ensures mineral and ore processing remains the single largest market for the froth flotation technology.
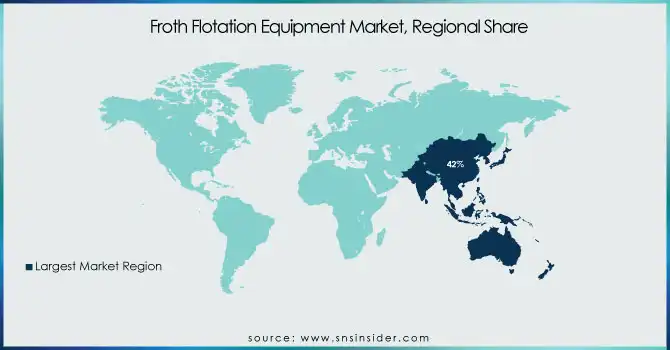
Asia-Pacific region dominated with a market share of over 42% in 2023, due to its thriving mining industry and high demand for minerals and metals. Countries like China, India, and Australia play a significant role in driving market growth, as they are major producers of base metals, rare earth elements, and industrial minerals. Region is benefiting from large scale mining activities, rising investment in mineral processing facilities and government initiatives supporting the mining sector. The continued demand for metals is also being driven by the fast pace of industrialization and the movement of people to urban areas and thus, the market for flotation equipment with high efficiency is strengthened. Moreover, innovations in automation and energy-efficient flotation technologies are on the rise, maximizing mineral extraction productivity and sustainability. These aspects are cumulatively making Asia-Pacific retain the top position in this market.
North America is experiencing rapid growth in the Froth Flotation Equipment Market, driven by several key factors. The region's advancements in mining technology have enhanced the efficiency and effectiveness of flotation processes, improving mineral recovery rates. Moreover, the increasing consumption of base metals such as copper, zinc, and lead to support industrial evolution and transition to cleaning energy have resulted in expansion of mining industries. Additionally, the region is viewing sustainable mineral processing is a potential driver for the market as strict environmental regulations are promoting the usage of energy-efficient and eco-friendly flotation equipment. The dominant players in the mining industry, coupled with the persistent investment in R&D will positively impact the expansion of the market, which is the reason behind the growth of North America's market for froth flotation equipment at the fastest pace.
Get Customized Report as per Your Business Requirement - Enquiry Now
Some of the major key players in the Froth Flotation Equipment Market
Metso Outotec (Flotation cells, flotation columns, automation solutions)
FLSmidth (Flotation cells, flotation columns, slurry pumps)
Eriez Flotation (Column flotation systems, spargers, flotation cells)
WEG Equipamentos Elétricos S.A. (Motors and drives for flotation equipment)
Process IQ Pty Ltd. (Flotation process control, real-time monitoring solutions)
GEA Minerals (Separation equipment, dewatering systems)
Boliden Mineral AB (Flotation circuits, mineral processing solutions)
JXSC Jiangxi Copper Corporation (Flotation machines, mineral processing plants)
Greyline Instruments Inc. (Ultrasonic level sensors for flotation tanks)
Endress+Hauser (Process automation, instrumentation for flotation)
Sandvik (Mining equipment, mineral processing solutions)
Foxboro (Schneider Electric) (Process control and automation systems)
Yokogawa Electric (Industrial automation, sensors for flotation processes)
Myntec (Flotation monitoring and optimization solutions)
Yantian Jingpeng Mining Technology (Flotation equipment, mining automation)
DELKOR (A Tenova Company) (Flotation cells, solid-liquid separation solutions)
Dorr-Oliver Eimco (A brand of FLSmidth) (Flotation machines, thickening solutions)
Shanghai Joyal Machinery Co., Ltd. (Flotation cells, mineral processing equipment)
Xinhai Mining Technology & Equipment Inc. (Flotation machines, gold flotation solutions)
Voith GmbH & Co. KGaA (Flotation deinking systems, fiber recovery solutions)
Suppliers for (Advanced flotation technologies, sustainable mining solutions, and large-scale industrial flotation cells) on the Froth Flotation Equipment Market
Metso Outotec
FLSmidth
Yokogawa Electric
Eriez Flotation
JXSC Mine Machinery Factory
Henan Mecru Heavy Industry Technology Co., Ltd
Jiangxi Well-tech International Mining Equipment Co., Ltd
Xinhai Mining Technology & Equipment Inc.
911Metallurgist
Naugra Lab Equipments
RECENT DEVELOPMENT
In December 2023: Metso launched the Spider Crowder upgrade to address challenges in large flotation cells. This innovation enhances froth management, ensuring higher equipment availability and operational efficiency in flotation processes. When combined with the Metso Center Launder, it boosts metallurgical performance, improves energy efficiency, and provides better process control, making flotation operations more reliable and effective.
| Report Attributes | Details |
|---|---|
| Market Size in 2023 | USD 340.32 Million |
| Market Size by 2032 | USD 494.16 Million |
| CAGR | CAGR of 4.23% From 2024 to 2032 |
| Base Year | 2023 |
| Forecast Period | 2024-2032 |
| Historical Data | 2020-2022 |
| Report Scope & Coverage | Market Size, Segments Analysis, Competitive Landscape, Regional Analysis, DROC & SWOT Analysis, Forecast Outlook |
| Key Segments | • By Type (Free-flow flotation, Cell-to-cell flotation) • By Application (Wastewater treatment, Paper Recycling, Mineral and ore processing) |
| Regional Analysis/Coverage | North America (US, Canada, Mexico), Europe (Eastern Europe [Poland, Romania, Hungary, Turkey, Rest of Eastern Europe] Western Europe] Germany, France, UK, Italy, Spain, Netherlands, Switzerland, Austria, Rest of Western Europe]), Asia Pacific (China, India, Japan, South Korea, Vietnam, Singapore, Australia, Rest of Asia Pacific), Middle East & Africa (Middle East [UAE, Egypt, Saudi Arabia, Qatar, Rest of Middle East], Africa [Nigeria, South Africa, Rest of Africa], Latin America (Brazil, Argentina, Colombia, Rest of Latin America) |
| Company Profiles | Metso Outotec, FLSmidth, Eriez Flotation, WEG Equipamentos Elétricos S.A., Process IQ Pty Ltd., GEA Minerals, Boliden Mineral AB, JXSC Jiangxi Copper Corporation, Greyline Instruments Inc., Endress+Hauser, Sandvik, Foxboro (Schneider Electric), Yokogawa Electric, Myntec, Yantian Jingpeng Mining Technology, DELKOR (A Tenova Company), Dorr-Oliver Eimco (A brand of FLSmidth), Shanghai Joyal Machinery Co., Ltd., Xinhai Mining Technology & Equipment Inc., Voith GmbH & Co. KGaA. |
Ans: The Froth Flotation Equipment Market is expected to grow at a CAGR of 4.23% during 2024-2032.
Ans: The Froth Flotation Equipment Market was USD 340.32 million in 2023 and is expected to reach USD 494.16 million by 2032.
Ans: The rising demand for base and precious metals, driven by industrialization and renewable energy needs, is fueling the growth of advanced froth flotation equipment in mining operations.
Ans: The “Cell-to-Cell Flotation” segment dominated the Froth Flotation Equipment Market.
Ans: Asia-Pacific dominated the Froth Flotation Equipment Market in 2023
Table of Contents:
1. Introduction
1.1 Market Definition
1.2 Scope (Inclusion and Exclusions)
1.3 Research Assumptions
2. Executive Summary
2.1 Market Overview
2.2 Regional Synopsis
2.3 Competitive Summary
3. Research Methodology
3.1 Top-Down Approach
3.2 Bottom-up Approach
3.3. Data Validation
3.4 Primary Interviews
4. Market Dynamics Impact Analysis
4.1 Market Driving Factors Analysis
4.1.2 Drivers
4.1.2 Restraints
4.1.3 Opportunities
4.1.4 Challenges
4.2 PESTLE Analysis
4.3 Porter’s Five Forces Model
5. Statistical Insights and Trends Reporting
5.1 Market Production Volume, by Region (2020-2023)
5.2 Utilization Rates of Froth Flotation Equipment, by Region (2020-2023)
5.3 Operational Efficiency and Downtime Metrics
5.4 Technological Advancements and Adoption Rates, by Region
5.5 Export/Import Trends of Froth Flotation Equipment, by Region (2023)
6. Competitive Landscape
6.1 List of Major Companies, By Region
6.2 Market Share Analysis, By Region
6.3 Product Benchmarking
6.3.1 Product specifications and features
6.3.2 Pricing
6.4 Strategic Initiatives
6.4.1 Marketing and promotional activities
6.4.2 Distribution and Supply Chain Strategies
6.4.3 Expansion plans and new product launches
6.4.4 Strategic partnerships and collaborations
6.5 Technological Advancements
6.6 Market Positioning and Branding
7. Froth Flotation Equipment Market Segmentation, By Type
7.1 Chapter Overview
7.2 Free-flow flotation
7.2.1 Free-flow flotation Market Trends Analysis (2020-2032)
7.2.2 Free-flow flotation Market Size Estimates and Forecasts to 2032 (USD Million)
7.3 Cell-to-cell flotation
7.3.1 Cell-to-cell flotation Market Trends Analysis (2020-2032)
7.3.2 Cell-to-cell flotation Market Size Estimates and Forecasts to 2032 (USD Million)
8. Froth Flotation Equipment Market Segmentation, By Application
8.1 Chapter Overview
8.2 Wastewater treatment
8.2.1 Wastewater treatment Market Trends Analysis (2020-2032)
8.2.2 Wastewater treatment Market Size Estimates and Forecasts to 2032 (USD Million)
8.3 Paper Recycling
8.3.1 Paper Recycling Market Trends Analysis (2020-2032)
8.3.2 Paper Recycling Market Size Estimates and Forecasts to 2032 (USD Million)
8.4 Mineral and ore processing
8.4.1 Mineral and ore processing Market Trends Analysis (2020-2032)
8.4.2 Mineral and ore processing Market Size Estimates and Forecasts to 2032 (USD Million)
9. Regional Analysis
9.1 Chapter Overview
9.2 North America
9.2.1 Trends Analysis
9.2.2 North America Froth Flotation Equipment Market Estimates and Forecasts, by Country (2020-2032) (USD Million)
9.2.3 North America Froth Flotation Equipment Market Estimates and Forecasts, By Type (2020-2032) (USD Million)
9.2.4 North America Froth Flotation Equipment Market Estimates and Forecasts, By Application (2020-2032) (USD Million)
9.2.5 USA
9.2.5.1 USA Froth Flotation Equipment Market Estimates and Forecasts, By Type (2020-2032) (USD Million)
9.2.5.2 USA Froth Flotation Equipment Market Estimates and Forecasts, By Application (2020-2032) (USD Million)
9.2.6 Canada
9.2.6.1 Canada Froth Flotation Equipment Market Estimates and Forecasts, By Type (2020-2032) (USD Million)
9.2.6.2 Canada Froth Flotation Equipment Market Estimates and Forecasts, By Application (2020-2032) (USD Million)
9.2.7 Mexico
9.2.7.1 Mexico Froth Flotation Equipment Market Estimates and Forecasts, By Type (2020-2032) (USD Million)
9.2.7.2 Mexico Froth Flotation Equipment Market Estimates and Forecasts, By Application (2020-2032) (USD Million)
9.3 Europe
9.3.1 Eastern Europe
9.3.1.1 Trends Analysis
9.3.1.2 Eastern Europe Froth Flotation Equipment Market Estimates and Forecasts, by Country (2020-2032) (USD Million)
9.3.1.3 Eastern Europe Froth Flotation Equipment Market Estimates and Forecasts, By Type (2020-2032) (USD Million)
9.3.1.4 Eastern Europe Froth Flotation Equipment Market Estimates and Forecasts, By Application (2020-2032) (USD Million)
9.3.1.5 Poland
9.3.1.5.1 Poland Froth Flotation Equipment Market Estimates and Forecasts, By Type (2020-2032) (USD Million)
9.3.1.5.2 Poland Froth Flotation Equipment Market Estimates and Forecasts, By Application (2020-2032) (USD Million)
9.3.1.6 Romania
9.3.1.6.1 Romania Froth Flotation Equipment Market Estimates and Forecasts, By Type (2020-2032) (USD Million)
9.3.1.6.2 Romania Froth Flotation Equipment Market Estimates and Forecasts, By Application (2020-2032) (USD Million)
9.3.1.7 Hungary
9.3.1.7.1 Hungary Froth Flotation Equipment Market Estimates and Forecasts, By Type (2020-2032) (USD Million)
9.3.1.7.2 Hungary Froth Flotation Equipment Market Estimates and Forecasts, By Application (2020-2032) (USD Million)
9.3.1.8 Turkey
9.3.1.8.1 Turkey Froth Flotation Equipment Market Estimates and Forecasts, By Type (2020-2032) (USD Million)
9.3.1.8.2 Turkey Froth Flotation Equipment Market Estimates and Forecasts, By Application (2020-2032) (USD Million)
9.3.1.9 Rest of Eastern Europe
9.3.1.9.1 Rest of Eastern Europe Froth Flotation Equipment Market Estimates and Forecasts, By Type (2020-2032) (USD Million)
9.3.1.9.2 Rest of Eastern Europe Froth Flotation Equipment Market Estimates and Forecasts, By Application (2020-2032) (USD Million)
9.3.2 Western Europe
9.3.2.1 Trends Analysis
9.3.2.2 Western Europe Froth Flotation Equipment Market Estimates and Forecasts, by Country (2020-2032) (USD Million)
9.3.2.3 Western Europe Froth Flotation Equipment Market Estimates and Forecasts, By Type (2020-2032) (USD Million)
9.3.2.4 Western Europe Froth Flotation Equipment Market Estimates and Forecasts, By Application (2020-2032) (USD Million)
9.3.2.5 Germany
9.3.2.5.1 Germany Froth Flotation Equipment Market Estimates and Forecasts, By Type (2020-2032) (USD Million)
9.3.2.5.2 Germany Froth Flotation Equipment Market Estimates and Forecasts, By Application (2020-2032) (USD Million)
9.3.2.6 France
9.3.2.6.1 France Froth Flotation Equipment Market Estimates and Forecasts, By Type (2020-2032) (USD Million)
9.3.2.6.2 France Froth Flotation Equipment Market Estimates and Forecasts, By Application (2020-2032) (USD Million)
9.3.2.7 UK
9.3.2.7.1 UK Froth Flotation Equipment Market Estimates and Forecasts, By Type (2020-2032) (USD Million)
9.3.2.7.2 UK Froth Flotation Equipment Market Estimates and Forecasts, By Application (2020-2032) (USD Million)
9.3.2.8 Italy
9.3.2.8.1 Italy Froth Flotation Equipment Market Estimates and Forecasts, By Type (2020-2032) (USD Million)
9.3.2.8.2 Italy Froth Flotation Equipment Market Estimates and Forecasts, By Application (2020-2032) (USD Million)
9.3.2.9 Spain
9.3.2.9.1 Spain Froth Flotation Equipment Market Estimates and Forecasts, By Type (2020-2032) (USD Million)
9.3.2.9.2 Spain Froth Flotation Equipment Market Estimates and Forecasts, By Application (2020-2032) (USD Million)
9.3.2.10 Netherlands
9.3.2.10.1 Netherlands Froth Flotation Equipment Market Estimates and Forecasts, By Type (2020-2032) (USD Million)
9.3.2.10.2 Netherlands Froth Flotation Equipment Market Estimates and Forecasts, By Application (2020-2032) (USD Million)
9.3.2.11 Switzerland
9.3.2.11.1 Switzerland Froth Flotation Equipment Market Estimates and Forecasts, By Type (2020-2032) (USD Million)
9.3.2.11.2 Switzerland Froth Flotation Equipment Market Estimates and Forecasts, By Application (2020-2032) (USD Million)
9.3.2.12 Austria
9.3.2.12.1 Austria Froth Flotation Equipment Market Estimates and Forecasts, By Type (2020-2032) (USD Million)
9.3.2.12.2 Austria Froth Flotation Equipment Market Estimates and Forecasts, By Application (2020-2032) (USD Million)
9.3.2.13 Rest of Western Europe
9.3.2.13.1 Rest of Western Europe Froth Flotation Equipment Market Estimates and Forecasts, By Type (2020-2032) (USD Million)
9.3.2.13.2 Rest of Western Europe Froth Flotation Equipment Market Estimates and Forecasts, By Application (2020-2032) (USD Million)
9.4 Asia Pacific
9.4.1 Trends Analysis
9.4.2 Asia Pacific Froth Flotation Equipment Market Estimates and Forecasts, by Country (2020-2032) (USD Million)
9.4.3 Asia Pacific Froth Flotation Equipment Market Estimates and Forecasts, By Type (2020-2032) (USD Million)
9.4.4 Asia Pacific Froth Flotation Equipment Market Estimates and Forecasts, By Application (2020-2032) (USD Million)
9.4.5 China
9.4.5.1 China Froth Flotation Equipment Market Estimates and Forecasts, By Type (2020-2032) (USD Million)
9.4.5.2 China Froth Flotation Equipment Market Estimates and Forecasts, By Application (2020-2032) (USD Million)
9.4.6 India
9.4.5.1 India Froth Flotation Equipment Market Estimates and Forecasts, By Type (2020-2032) (USD Million)
9.4.5.2 India Froth Flotation Equipment Market Estimates and Forecasts, By Application (2020-2032) (USD Million)
9.4.5 Japan
9.4.5.1 Japan Froth Flotation Equipment Market Estimates and Forecasts, By Type (2020-2032) (USD Million)
9.4.5.2 Japan Froth Flotation Equipment Market Estimates and Forecasts, By Application (2020-2032) (USD Million)
9.4.6 South Korea
9.4.6.1 South Korea Froth Flotation Equipment Market Estimates and Forecasts, By Type (2020-2032) (USD Million)
9.4.6.2 South Korea Froth Flotation Equipment Market Estimates and Forecasts, By Application (2020-2032) (USD Million)
9.4.7 Vietnam
9.4.7.1 Vietnam Froth Flotation Equipment Market Estimates and Forecasts, By Type (2020-2032) (USD Million)
9.2.7.2 Vietnam Froth Flotation Equipment Market Estimates and Forecasts, By Application (2020-2032) (USD Million)
9.4.8 Singapore
9.4.8.1 Singapore Froth Flotation Equipment Market Estimates and Forecasts, By Type (2020-2032) (USD Million)
9.4.8.2 Singapore Froth Flotation Equipment Market Estimates and Forecasts, By Application (2020-2032) (USD Million)
9.4.9 Australia
9.4.9.1 Australia Froth Flotation Equipment Market Estimates and Forecasts, By Type (2020-2032) (USD Million)
9.4.9.2 Australia Froth Flotation Equipment Market Estimates and Forecasts, By Application (2020-2032) (USD Million)
9.4.10 Rest of Asia Pacific
9.4.10.1 Rest of Asia Pacific Froth Flotation Equipment Market Estimates and Forecasts, By Type (2020-2032) (USD Million)
9.4.10.2 Rest of Asia Pacific Froth Flotation Equipment Market Estimates and Forecasts, By Application (2020-2032) (USD Million)
9.5 Middle East and Africa
9.5.1 Middle East
9.5.1.1 Trends Analysis
9.5.1.2 Middle East Froth Flotation Equipment Market Estimates and Forecasts, by Country (2020-2032) (USD Million)
9.5.1.3 Middle East Froth Flotation Equipment Market Estimates and Forecasts, By Type (2020-2032) (USD Million)
9.5.1.4 Middle East Froth Flotation Equipment Market Estimates and Forecasts, By Application (2020-2032) (USD Million)
9.5.1.5 UAE
9.5.1.5.1 UAE Froth Flotation Equipment Market Estimates and Forecasts, By Type (2020-2032) (USD Million)
9.5.1.5.2 UAE Froth Flotation Equipment Market Estimates and Forecasts, By Application (2020-2032) (USD Million)
9.5.1.6 Egypt
9.5.1.6.1 Egypt Froth Flotation Equipment Market Estimates and Forecasts, By Type (2020-2032) (USD Million)
9.5.1.6.2 Egypt Froth Flotation Equipment Market Estimates and Forecasts, By Application (2020-2032) (USD Million)
9.5.1.7 Saudi Arabia
9.5.1.7.1 Saudi Arabia Froth Flotation Equipment Market Estimates and Forecasts, By Type (2020-2032) (USD Million)
9.5.1.7.2 Saudi Arabia Froth Flotation Equipment Market Estimates and Forecasts, By Application (2020-2032) (USD Million)
9.5.1.8 Qatar
9.5.1.8.1 Qatar Froth Flotation Equipment Market Estimates and Forecasts, By Type (2020-2032) (USD Million)
9.5.1.8.2 Qatar Froth Flotation Equipment Market Estimates and Forecasts, By Application (2020-2032) (USD Million)
9.5.1.9 Rest of Middle East
9.5.1.9.1 Rest of Middle East Froth Flotation Equipment Market Estimates and Forecasts, By Type (2020-2032) (USD Million)
9.5.1.9.2 Rest of Middle East Froth Flotation Equipment Market Estimates and Forecasts, By Application (2020-2032) (USD Million)
9.5.2 Africa
9.5.2.1 Trends Analysis
9.5.2.2 Africa Froth Flotation Equipment Market Estimates and Forecasts, by Country (2020-2032) (USD Million)
9.5.2.3 Africa Froth Flotation Equipment Market Estimates and Forecasts, By Type (2020-2032) (USD Million)
9.5.2.4 Africa Froth Flotation Equipment Market Estimates and Forecasts, By Application (2020-2032) (USD Million)
9.5.2.5 South Africa
9.5.2.5.1 South Africa Froth Flotation Equipment Market Estimates and Forecasts, By Type (2020-2032) (USD Million)
9.5.2.5.2 South Africa Froth Flotation Equipment Market Estimates and Forecasts, By Application (2020-2032) (USD Million)
9.5.2.6 Nigeria
9.5.2.6.1 Nigeria Froth Flotation Equipment Market Estimates and Forecasts, By Type (2020-2032) (USD Million)
9.5.2.6.2 Nigeria Froth Flotation Equipment Market Estimates and Forecasts, By Application (2020-2032) (USD Million)
9.5.2.7 Rest of Africa
9.5.2.7.1 Rest of Africa Froth Flotation Equipment Market Estimates and Forecasts, By Type (2020-2032) (USD Million)
9.5.2.7.2 Rest of Africa Froth Flotation Equipment Market Estimates and Forecasts, By Application (2020-2032) (USD Million)
9.6 Latin America
9.6.1 Trends Analysis
9.6.2 Latin America Froth Flotation Equipment Market Estimates and Forecasts, by Country (2020-2032) (USD Million)
9.6.3 Latin America Froth Flotation Equipment Market Estimates and Forecasts, By Type (2020-2032) (USD Million)
9.6.4 Latin America Froth Flotation Equipment Market Estimates and Forecasts, By Application (2020-2032) (USD Million)
9.6.5 Brazil
9.6.5.1 Brazil Froth Flotation Equipment Market Estimates and Forecasts, By Type (2020-2032) (USD Million)
9.6.5.2 Brazil Froth Flotation Equipment Market Estimates and Forecasts, By Application (2020-2032) (USD Million)
9.6.6 Argentina
9.6.6.1 Argentina Froth Flotation Equipment Market Estimates and Forecasts, By Type (2020-2032) (USD Million)
9.6.6.2 Argentina Froth Flotation Equipment Market Estimates and Forecasts, By Application (2020-2032) (USD Million)
9.6.7 Colombia
9.6.7.1 Colombia Froth Flotation Equipment Market Estimates and Forecasts, By Type (2020-2032) (USD Million)
9.6.7.2 Colombia Froth Flotation Equipment Market Estimates and Forecasts, By Application (2020-2032) (USD Million)
9.6.8 Rest of Latin America
9.6.8.1 Rest of Latin America Froth Flotation Equipment Market Estimates and Forecasts, By Type (2020-2032) (USD Million)
9.6.8.2 Rest of Latin America Froth Flotation Equipment Market Estimates and Forecasts, By Application (2020-2032) (USD Million)
10. Company Profiles
10.1 Process IQ Pty Ltd.
10.1.1 Company Overview
10.1.2 Financial
10.1.3 Products/ Services Offered
110.1.4 SWOT Analysis
10.2 GEA Minerals
10.2.1 Company Overview
10.2.2 Financial
10.2.3 Products/ Services Offered
10.2.4 SWOT Analysis
10.3 Eriez Flotation
10.3.1 Company Overview
10.3.2 Financial
10.3.3 Products/ Services Offered
10.3.4 SWOT Analysis
10.4 FLSmidth
10.4.1 Company Overview
10.4.2 Financial
10.4.3 Products/ Services Offered
10.4.4 SWOT Analysis
10.5 WEG Equipamentos Elétricos S.A.
10.5.1 Company Overview
10.5.2 Financial
10.5.3 Products/ Services Offered
10.5.4 SWOT Analysis
10.6 Metso Outotec
10.6.1 Company Overview
10.6.2 Financial
10.6.3 Products/ Services Offered
10.6.4 SWOT Analysis
10.7 Boliden Mineral AB
10.7.1 Company Overview
10.7.2 Financial
10.7.3 Products/ Services Offered
10.7.4 SWOT Analysis
10.8 JXSC Jiangxi Copper Corporation
10.8.1 Company Overview
10.8.2 Financial
10.8.3 Products/ Services Offered
10.8.4 SWOT Analysis
10.9 Greyline Instruments Inc.
10.9.1 Company Overview
10.9.2 Financial
10.9.3 Products/ Services Offered
10.9.4 SWOT Analysis
10.10 Endress+ Hauser
10.9.1 Company Overview
10.9.2 Financial
10.9.3 Products/ Services Offered
10.9.4 SWOT Analysis
11. Use Cases and Best Practices
12. Conclusion
An accurate research report requires proper strategizing as well as implementation. There are multiple factors involved in the completion of good and accurate research report and selecting the best methodology to compete the research is the toughest part. Since the research reports we provide play a crucial role in any company’s decision-making process, therefore we at SNS Insider always believe that we should choose the best method which gives us results closer to reality. This allows us to reach at a stage wherein we can provide our clients best and accurate investment to output ratio.
Each report that we prepare takes a timeframe of 350-400 business hours for production. Starting from the selection of titles through a couple of in-depth brain storming session to the final QC process before uploading our titles on our website we dedicate around 350 working hours. The titles are selected based on their current market cap and the foreseen CAGR and growth.
The 5 steps process:
Step 1: Secondary Research:
Secondary Research or Desk Research is as the name suggests is a research process wherein, we collect data through the readily available information. In this process we use various paid and unpaid databases which our team has access to and gather data through the same. This includes examining of listed companies’ annual reports, Journals, SEC filling etc. Apart from this our team has access to various associations across the globe across different industries. Lastly, we have exchange relationships with various university as well as individual libraries.

Step 2: Primary Research
When we talk about primary research, it is a type of study in which the researchers collect relevant data samples directly, rather than relying on previously collected data. This type of research is focused on gaining content specific facts that can be sued to solve specific problems. Since the collected data is fresh and first hand therefore it makes the study more accurate and genuine.
We at SNS Insider have divided Primary Research into 2 parts.
Part 1 wherein we interview the KOLs of major players as well as the upcoming ones across various geographic regions. This allows us to have their view over the market scenario and acts as an important tool to come closer to the accurate market numbers. As many as 45 paid and unpaid primary interviews are taken from both the demand and supply side of the industry to make sure we land at an accurate judgement and analysis of the market.
This step involves the triangulation of data wherein our team analyses the interview transcripts, online survey responses and observation of on filed participants. The below mentioned chart should give a better understanding of the part 1 of the primary interview.

Part 2: In this part of primary research the data collected via secondary research and the part 1 of the primary research is validated with the interviews from individual consultants and subject matter experts.
Consultants are those set of people who have at least 12 years of experience and expertise within the industry whereas Subject Matter Experts are those with at least 15 years of experience behind their back within the same space. The data with the help of two main processes i.e., FGDs (Focused Group Discussions) and IDs (Individual Discussions). This gives us a 3rd party nonbiased primary view of the market scenario making it a more dependable one while collation of the data pointers.
Step 3: Data Bank Validation
Once all the information is collected via primary and secondary sources, we run that information for data validation. At our intelligence centre our research heads track a lot of information related to the market which includes the quarterly reports, the daily stock prices, and other relevant information. Our data bank server gets updated every fortnight and that is how the information which we collected using our primary and secondary information is revalidated in real time.

Step 4: QA/QC Process
After all the data collection and validation our team does a final level of quality check and quality assurance to get rid of any unwanted or undesired mistakes. This might include but not limited to getting rid of the any typos, duplication of numbers or missing of any important information. The people involved in this process include technical content writers, research heads and graphics people. Once this process is completed the title gets uploader on our platform for our clients to read it.
Step 5: Final QC/QA Process:
This is the last process and comes when the client has ordered the study. In this process a final QA/QC is done before the study is emailed to the client. Since we believe in giving our clients a good experience of our research studies, therefore, to make sure that we do not lack at our end in any way humanly possible we do a final round of quality check and then dispatch the study to the client.
Key Segmentation
By Type
Free-flow flotation
Cell-to-cell flotation
By Application
Wastewater treatment
Paper Recycling
Mineral and ore processing
Request for Segment Customization as per your Business Requirement: Segment Customization Request
Regional Coverage:
North America
US
Canada
Mexico
Europe
Eastern Europe
Poland
Romania
Hungary
Turkey
Rest of Eastern Europe
Western Europe
Germany
France
UK
Italy
Spain
Netherlands
Switzerland
Austria
Rest of Western Europe
Asia Pacific
China
India
Japan
South Korea
Vietnam
Singapore
Australia
Rest of Asia Pacific
Middle East & Africa
Middle East
UAE
Egypt
Saudi Arabia
Qatar
Rest of the Middle East
Africa
Nigeria
South Africa
Rest of Africa
Latin America
Brazil
Argentina
Colombia
Rest of Latin America
Request for Country Level Research Report: Country Level Customization Request
Available Customization
With the given market data, SNS Insider offers customization as per the company’s specific needs. The following customization options are available for the report:
Detailed Volume Analysis
Criss-Cross segment analysis (e.g. Product X Application)
Competitive Product Benchmarking
Geographic Analysis
Additional countries in any of the regions
Customized Data Representation
Detailed analysis and profiling of additional market players
The Train Seat Market was valued at USD 2.66 billion in 2023 and is projected to reach USD 3.91 billion by 2032, growing at a CAGR of 4.37% from 2024 to 2032.
The Non-Destructive Testing Market size is value USD 20.56 Billion in 2023 and is expected to reach USD 39.79 Billion by 2032 with a growing CAGR of 7.61 % over the forecast period 2024-2032.
The Agricultural Robots Market Size was valued at USD 9.55 Billion in 2023 and is expected to reach USD 43.50 Billion by 2032 and grow at a CAGR of 18.4% over the forecast period 2024-2032.
The Metal Cutting Tools Market size was valued at USD 82.81 Billion in 2023 and is expected to reach USD 141.09 Billion by 2032 and grow at a CAGR of 6.1% over the forecast period 2024-2032.
The Conveyer Monitoring Market size was valued at USD 255 million in 2023 and will reach USD 343 million by 2032, displaying a CAGR of 3.8% by 2024-2032
Modular Chillers Market Size was valued at USD 2.93 Billion in 2023 and is expected to reach USD 5.07 Billion by 2032 and grow at a CAGR of 6.33% over the forecast period 2024-2032.

Hi! Click one of our member below to chat on Phone
© 2025 All Rights Reserved by SNS Insider Pvt Ltd


