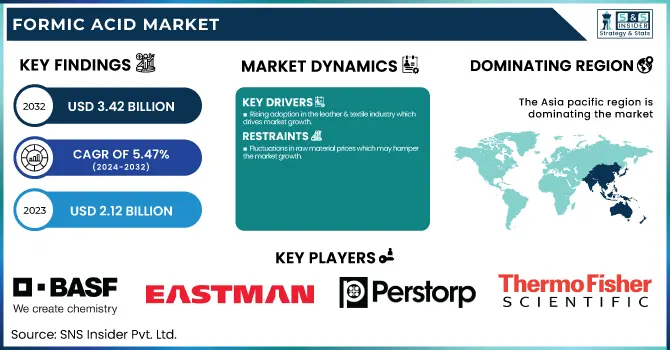
The Formic Acid Market size was USD 2.12 Billion in 2023 and is expected to reach USD 3.42 Billion by 2032 and grow at a CAGR of 5.47 % over the forecast period of 2024-2032.
To Get more information on Formic Acid Market - Request Free Sample Report
The formic acid market report provides a detailed analysis of production capacity and utilization rates across key manufacturing countries, along with feedstock price trends affecting production costs. It examines the regulatory landscape and trade policies shaping market dynamics while assessing environmental metrics, including carbon footprint and sustainability initiatives. The report highlights innovation and R&D investments, particularly in bio-based formic acid and high-purity applications. Additionally, it explores market demand trends across industries such as agriculture, leather & textile, rubber, and chemicals & pharmaceuticals, offering a comprehensive outlook on growth drivers and emerging opportunities.
Drivers
Rising adoption in the leather & textile industry which drives market growth.
One of the most influential factors driving the growth of this market is the increasing use of formic acid as a pH regulator, tanning agent, and dye-fixing agent in the leather and textile industries. It further finds a common application for dyeing and finishing processes in textiles as it enhances color absorption and fabric strength. The high demand among end-use industries, internationally, for superior leather products and environmentally friendly textiles is driving the consumption of formic acid and this demand is relatively higher in some emerging economies where leather including footwear and textile manufacturing industry has a strong base. In addition, strict environmental legislation encouraging the popularization of green chemicals is also expected to boost its uptake, as Formic acid is regarded as a low-toxicity and biodegradable substitute for other traditional acids.
Restraint
Fluctuations in raw material prices which may hamper the market growth.
The price levels and volatility of these raw materials are primarily driven by global supply-demand dynamics, fluctuations in crude oil prices, and geopolitical tensions affecting the chemical industry. Feedstock prices directly impact the cost of manufacturing. A significant increase in feedstock prices makes formic-acid production economically less favorable, particularly for small and medium-sized producers. Moreover, this reliance on methanol from petrochemical sources is subject to energy price fluctuations, which introduces additional uncertainty in terms of cost. Fluctuations such as these will cause increased product costs, decreased profit margins, and reduced uptake, especially for anti-microbial technologies needed in perimeter-sensitive industries like agriculture, textiles, and rubber processing. As a result, manufacturers are considering bio-based production methods and supply chain diversification high on their list of measures to reduce raw material price risk.
Opportunity
The rising adoption of green energy and hydrogen storage creates an opportunity in the market.
The increasing demand for green energy and hydrogen storage provides a lucrative opportunity for the formic acid market, being recognized as a safe and efficient hydrogen carrier in fuel cell applications. Catalytic decomposition of stored formic acid can release stored hydrogen in a reversible process making it a potential clean fuel for both storage and transportation of energy. In contrast to usually employed hydrogen storage approaches, which need storage tanks under high pressure or cryogenic systems, the formic acid gives an inexpensive, liquid-based storage system that is easier to handle and operate with fuel cell technologies. As a result, research and investments focused on applying formic acid in hydrogen-powered vehicles, renewable energy storage, and industrial fuel applications are gaining momentum. As governments and industries globally turn their attention to decarbonization and green hydrogen projects, the application of formic acid can help advance and sustain these initiatives the demand only rising with the increased need for such energy commitment, innovation, and expansion capacities.
Challenges
High production costs for high-purity formic acid.
The high-purity applications, particularly in pharmaceuticals, food processing, and electronics sectors, the significant challenge in the market is the high production costs for high-purity formic acid. This purification process contains high levels of distillation and filtering methods that humans use, hence discovering high levels of energy and operational cost to produce. Also, use of premium feedstocks like purified methanol and carbon monoxide further increases the costs of production. As a highly pure formic acid is less cost-competitive than standard grades for many uses, there are restrictions on the widespread adoption of the latter. This is further compounded by the fact that smaller-scale manufacturers do not always have the funds to invest in custom production infrastructure and regulatory compliance. Consequently, organizations have been continually examining economical bio-based producing approaches and method adjustments to boost effectiveness and affordable range manufacturing value.
By Type
Grade 85% held the largest market share around 52% in 2023. This is due to its wider application scope in agricultural, leather & textile, rubber, and chemical processing industries. This concentration is the right amount for both effective and cost-efficient disinfectant while remaining safe making it the choice of end-users. In agricultural applications, 85% formic acid has been used as silage preservatives and antibacterial agents in animal feed, increasing the health and productivity of livestock. Moreover, in the leather and textile industry, it acts as an important pH regulator in tanning and dyeing. This property is also helpful in its application as a coagulating agent in the natural rubber industry. Additionally, this grade is safer to handle than the higher concentrations, which will make transporting and storing it easier.
By Application
Animal feed held the largest market share around 34% in 2023. It is due to the use of formic acid as a feed preservative and antibacterial agent in livestock nutrition, the formic acid market is mostly ruled by the formic acid segment with its broader scope among all animal feed segments. By inhibiting bacterial growth, preventing the occurrence of mold, and prolonging animal feed shelf life, formic acid ultimately contributes to an improvement in the quality of the feed and animal health. It is especially useful in poultry, swine, and cattle and can improve gut health and digestion which improves feed efficiency and productivity. Furthermore, the rising concern regarding antibiotic resistance has led many countries to ban AGPs from animal feed which, in turn, is contributing to the increasing demand for natural acidifiers such as formic acid.
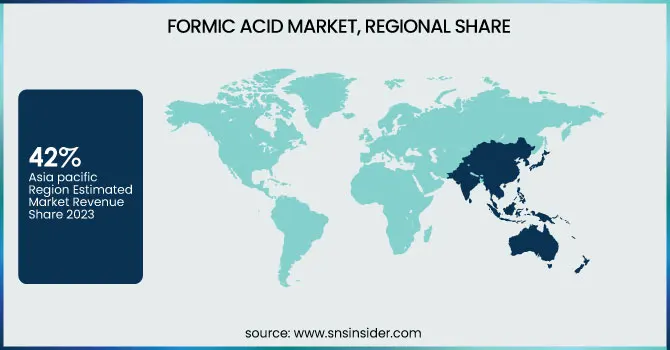
Asia pacific held the largest market share around 42% in 2023. It is due to high industrial base, increasing agriculture sector, and expanding leather & textile industry in this region. High demand for formic acid from animal feed, rubber processing, and chemical manufacturing enables countries such as China, India, and South Korea to become the major producers and consumers of the product. In China and India, the growing livestock industry has also been a driving force for the formic acid market, leading to a high demand for the substance as an antibacterial and feed preservative, which also promotes the value of the product. Moreover, Asia-Pacific accounts for a major share of leather and textile manufacturing hubs globally over which, formic acid is a prominent ingredient involved in tanning and dyeing processes. Asia-Pacific retains its dominant position in the global formic acid market with an increasing adoption of eco-friendly solutions coupled with a rise in sustainable chemical production investments.
North America held a significant market share in 2023. With the high use of formic acid as a feed preservative in livestock farming, the region is estimated to be a prominent consumer due to the presence of stringent regulations in the US and Canada promoting safe and effective feed additives. Furthermore, the market growth is driven by the increasing research of formic acid as a hydrogen carrier which has fueled the biofuel and renewable energy sector in North America. The consumption is also contributed by the rubber and leather industries, wherein natural rubber coagulation and leather processing applications are performed. In addition, stringent environmental regulations by agencies like the EPA (Environmental Protection Agency) facilitate the use of low-consuming and eco-friendly chemicals, allowing the growth of formic acid. North America is a key region in the global formic acid market with continuous trends in the chemical manufacturing field and a high demand for high-purity formic acid in the pharmaceutical and industrial sectors.
Get Customized Report as per Your Business Requirement - Enquiry Now
Key Players
BASF SE (Formic Acid, Formic Acid 85%)
Eastman Chemical Company (Formic Acid 85%, Methylamines)
Perstorp Holding AB (Formic Acid 85%, Feed Additives)
Feicheng Acid Chemicals Co., Ltd. (Formic Acid, Calcium Formate)
LUXI Group Co., Ltd. (Formic Acid, Fertilizers)
Gujarat Narmada Valley Fertilizers & Chemicals Limited (Formic Acid, Urea)
Shandong Acid Technology Co., Ltd. (Formic Acid, Methylamine)
Kemira Oyj (Formic Acid, Water Treatment Chemicals)
Rashtriya Chemicals and Fertilizers Limited (Formic Acid, Ammonia)
Wuhan Ruisunny Chemical Co., Ltd. (Formic Acid, Calcium Hypochlorite)
Chongqing Chuandong Chemical (Group) Co., Ltd. (Formic Acid, Sodium Formate)
Fleurchem, Inc. (Formic Acid, Fragrance Ingredients)
Yara International ASA (Formic Acid, Fertilizers)
POLIOLI SpA (Formic Acid, Polyols)
PT Pupuk Kujang (Formic Acid, Fertilizers)
NuGenTec (Formic Acid, Specialty Chemicals)
Thermo Fisher Scientific Inc. (Formic Acid, Laboratory Chemicals)
Haviland Enterprises Inc. (Formic Acid, Industrial Chemicals)
ClearTech Industries, Inc. (Formic Acid, Water Treatment Chemicals)
Univar Solutions Ltd. (Formic Acid, Chemical Distribution Services)
Recent Development:
In May 2023, Thermo Fisher Scientific partnered with Indonesia's National Research and Innovation Agency (BRIN) to enhance the country's research infrastructure and capabilities. This collaboration aims to bolster research competencies and expand capacity in the region.
In December 2023, Nitto Denko Corporation and Air Water Inc. initiated a project to produce formic acid from CO₂ sourced from livestock manure biomass. This effort seeks to support the decarbonization of the livestock industry by generating carbon-negative formic acid through Nitto's CO₂ chemical conversion technology.
| Report Attributes | Details |
| Market Size in 2023 | US$ 2.12 Billion |
| Market Size by 2032 | US$ 3.42 Billion |
| CAGR | CAGR of 5.47% From 2024 to 2032 |
| Base Year | 2023 |
| Forecast Period | 2024-2032 |
| Historical Data | 2020-2022 |
| Report Scope & Coverage | Market Size, Segments Analysis, Competitive Landscape, Regional Analysis, DROC & SWOT Analysis, Forecast Outlook |
| Key Segments | •By Type (Grade 85%, Grade 94%, Grade 99%, Others) •By Application (Agriculture, Leather & Textile, Rubber, Chemical & Pharmaceutical, Others) |
| Regional Analysis/Coverage | North America (US, Canada, Mexico), Europe (Eastern Europe [Poland, Romania, Hungary, Turkey, Rest of Eastern Europe] Western Europe] Germany, France, UK, Italy, Spain, Netherlands, Switzerland, Austria, Rest of Western Europe]), Asia Pacific (China, India, Japan, South Korea, Vietnam, Singapore, Australia, Rest of Asia Pacific), Middle East & Africa (Middle East [UAE, Egypt, Saudi Arabia, Qatar, Rest of Middle East], Africa [Nigeria, South Africa, Rest of Africa], Latin America (Brazil, Argentina, Colombia, Rest of Latin America) |
| Company Profiles | BASF SE, Eastman Chemical Company, Perstorp Holding AB, Feicheng Acid Chemicals Co., Ltd., LUXI Group Co., Ltd., Gujarat Narmada Valley Fertilizers & Chemicals Limited, Shandong Acid Technology Co., Ltd., Kemira Oyj, Rashtriya Chemicals and Fertilizers Limited, Wuhan Ruisunny Chemical Co., Ltd., Chongqing Chuandong Chemical (Group) Co., Ltd., Fleurchem, Inc., Yara International ASA, POLIOLI SpA, PT Pupuk Kujang, NuGenTec, Thermo Fisher Scientific Inc., Haviland Enterprises Inc., ClearTech Industries, Inc., Univar Solutions Ltd. |
Ans: The Formic Acid Market was valued at USD 2.12 Billion in 2023.
Ans: The expected CAGR of the global Formic Acid Market during the forecast period is 5.47%
Ans: The Grade 85% will grow rapidly in the Formic Acid Market from 2024-2032.
Ans: Rising adoption in the leather & textile industry which drives market growth.
Ans: Asia Pacific led the Formic Acid Market in the region with the highest revenue share in 2023.
Table of Contents:
1. Introduction
1.1 Market Definition
1.2 Scope (Inclusion and Exclusions)
1.3 Research Assumptions
2. Executive Summary
2.1 Market Overview
2.2 Regional Synopsis
2.3 Competitive Summary
3. Research Methodology
3.1 Top-Down Approach
3.2 Bottom-up Approach
3.3. Data Validation
3.4 Primary Interviews
4. Market Dynamics Impact Analysis
4.1 Market Driving Factors Analysis
4.1.2 Drivers
4.1.2 Restraints
4.1.3 Opportunities
4.1.4 Challenges
4.2 PESTLE Analysis
4.3 Porter’s Five Forces Model
5. Statistical Insights and Trends Reporting
5.1 Production Capacity and Utilization, by Country, By Type, 2023
5.2 Feedstock Prices, by Country, By Type, 2023
5.3 Regulatory Impact, by Country, By Type 2023.
5.4 Environmental Metrics: Emissions Data, Waste Management Practices, and Sustainability Initiatives, by Region
5.5 Innovation and R&D, Type, 2023
6. Competitive Landscape
6.1 List of Major Companies, By Region
6.2 Market Share Analysis, By Region
6.3 Product Benchmarking
6.3.1 Product specifications and features
6.3.2 Pricing
6.4 Strategic Initiatives
6.4.1 Marketing and promotional activities
6.4.2 Distribution and Supply Chain Strategies
6.4.3 Expansion Plans and New Product Launches
6.4.4 Strategic partnerships and collaborations
6.5 Technological Advancements
6.6 Market Positioning and Branding
7. Formic Acid Market Segmentation, By Type
7.1 Chapter Overview
7.2 Grade 85%
7.2.1 Grade 85% Trends Analysis (2020-2032)
7.2.2 Grade 85% Market Size Estimates and Forecasts to 2032 (USD Billion)
7.3 Grade 94%
7.3.1 Grade 94% Market Trends Analysis (2020-2032)
7.3.2 Grade 94% Market Size Estimates and Forecasts to 2032 (USD Billion)
7.4 Grade 99%
7.4.1 Grade 99% Trends Analysis (2020-2032)
7.4.2 Grade 99% Market Size Estimates and Forecasts to 2032 (USD Billion)
7.5 Others
7.5.1 Others Market Trends Analysis (2020-2032)
7.5.2 Others Market Size Estimates and Forecasts to 2032 (USD Billion)
8. Formic Acid Market Segmentation, by Application
8.1 Chapter Overview
8.2 Agriculture
8.2.1 Agriculture Market Trends Analysis (2020-2032)
8.2.2 Agriculture Market Size Estimates and Forecasts to 2032 (USD Billion)
8.3 Leather & Textile
8.3.1 Leather & Textile Market Trends Analysis (2020-2032)
8.3.2 Leather & Textile Market Size Estimates and Forecasts to 2032 (USD Billion)
8.4 Rubber
8.4.1 Rubber Market Trends Analysis (2020-2032)
8.4.2 Rubber Market Size Estimates and Forecasts to 2032 (USD Billion)
8.5 Chemical & Pharmaceutical
8.5.1 Chemical & Pharmaceutical Market Trends Analysis (2020-2032)
8.5.2 Chemical & Pharmaceutical Market Size Estimates and Forecasts to 2032 (USD Billion)
8.6 Others
8.6.1 Others Market Trends Analysis (2020-2032)
8.6.2 Others Market Size Estimates and Forecasts to 2032 (USD Billion)
9. Regional Analysis
9.1 Chapter Overview
9.2 North America
9.2.1 Trends Analysis
9.2.2 North America Formic Acid Market Estimates and Forecasts, by Country (2020-2032) (USD Billion)
9.2.3 North America Formic Acid Market Estimates and Forecasts, By Type (2020-2032) (USD Billion)
9.2.4 North America Formic Acid Market Estimates and Forecasts, by Application (2020-2032) (USD Billion)
9.2.5 USA
9.2.5.1 USA Formic Acid Market Estimates and Forecasts, By Type (2020-2032) (USD Billion)
9.2.5.2 USA Formic Acid Market Estimates and Forecasts, by Application (2020-2032) (USD Billion)
9.2.6 Canada
9.2.6.1 Canada Formic Acid Market Estimates and Forecasts, By Type (2020-2032) (USD Billion)
9.2.6.2 Canada Formic Acid Market Estimates and Forecasts, by Application (2020-2032) (USD Billion)
9.2.7 Mexico
9.2.7.1 Mexico Formic Acid Market Estimates and Forecasts, By Type (2020-2032) (USD Billion)
9.2.7.2 Mexico Formic Acid Market Estimates and Forecasts, by Application (2020-2032) (USD Billion)
9.3 Europe
9.3.1 Eastern Europe
9.3.1.1 Trends Analysis
9.3.1.2 Eastern Europe Formic Acid Market Estimates and Forecasts, by Country (2020-2032) (USD Billion)
9.3.1.3 Eastern Europe Formic Acid Market Estimates and Forecasts, By Type (2020-2032) (USD Billion)
9.3.1.4 Eastern Europe Formic Acid Market Estimates and Forecasts, by Application (2020-2032) (USD Billion)
9.3.1.5 Poland
9.3.1.5.1 Poland Formic Acid Market Estimates and Forecasts, By Type (2020-2032) (USD Billion)
9.3.1.5.2 Poland Formic Acid Market Estimates and Forecasts, by Application (2020-2032) (USD Billion)
9.3.1.6 Romania
9.3.1.6.1 Romania Formic Acid Market Estimates and Forecasts, By Type (2020-2032) (USD Billion)
9.3.1.6.2 Romania Formic Acid Market Estimates and Forecasts, by Application (2020-2032) (USD Billion)
9.3.1.7 Hungary
9.3.1.7.1 Hungary Formic Acid Market Estimates and Forecasts, By Type (2020-2032) (USD Billion)
9.3.1.7.2 Hungary Formic Acid Market Estimates and Forecasts, by Application (2020-2032) (USD Billion)
9.3.1.8 Turkey
9.3.1.8.1 Turkey Formic Acid Market Estimates and Forecasts, By Type (2020-2032) (USD Billion)
9.3.1.8.2 Turkey Formic Acid Market Estimates and Forecasts, by Application (2020-2032) (USD Billion)
9.3.1.9 Rest of Eastern Europe
9.3.1.9.1 Rest of Eastern Europe Formic Acid Market Estimates and Forecasts, By Type (2020-2032) (USD Billion)
9.3.1.9.2 Rest of Eastern Europe Formic Acid Market Estimates and Forecasts, by Application (2020-2032) (USD Billion)
9.3.2 Western Europe
9.3.2.1 Trends Analysis
9.3.2.2 Western Europe Formic Acid Market Estimates and Forecasts, by Country (2020-2032) (USD Billion)
9.3.2.3 Western Europe Formic Acid Market Estimates and Forecasts, By Type (2020-2032) (USD Billion)
9.3.2.4 Western Europe Formic Acid Market Estimates and Forecasts, by Application (2020-2032) (USD Billion)
9.3.2.5 Germany
9.3.2.5.1 Germany Formic Acid Market Estimates and Forecasts, By Type (2020-2032) (USD Billion)
9.3.2.5.2 Germany Formic Acid Market Estimates and Forecasts, by Application (2020-2032) (USD Billion)
9.3.2.6 France
9.3.2.6.1 France Formic Acid Market Estimates and Forecasts, By Type (2020-2032) (USD Billion)
9.3.2.6.2 France Formic Acid Market Estimates and Forecasts, by Application (2020-2032) (USD Billion)
9.3.2.7 UK
9.3.2.7.1 UK Formic Acid Market Estimates and Forecasts, By Type (2020-2032) (USD Billion)
9.3.2.7.2 UK Formic Acid Market Estimates and Forecasts, by Application (2020-2032) (USD Billion)
9.3.2.8 Italy
9.3.2.8.1 Italy Formic Acid Market Estimates and Forecasts, By Type (2020-2032) (USD Billion)
9.3.2.8.2 Italy Formic Acid Market Estimates and Forecasts, by Application (2020-2032) (USD Billion)
9.3.2.9 Spain
9.3.2.9.1 Spain Formic Acid Market Estimates and Forecasts, By Type (2020-2032) (USD Billion)
9.3.2.9.2 Spain Formic Acid Market Estimates and Forecasts, by Application (2020-2032) (USD Billion)
9.3.2.10 Netherlands
9.3.2.10.1 Netherlands Formic Acid Market Estimates and Forecasts, By Type (2020-2032) (USD Billion)
9.3.2.10.2 Netherlands Formic Acid Market Estimates and Forecasts, by Application (2020-2032) (USD Billion)
9.3.2.11 Switzerland
9.3.2.11.1 Switzerland Formic Acid Market Estimates and Forecasts, By Type (2020-2032) (USD Billion)
9.3.2.11.2 Switzerland Formic Acid Market Estimates and Forecasts, by Application (2020-2032) (USD Billion)
9.3.2.12 Austria
9.3.2.12.1 Austria Formic Acid Market Estimates and Forecasts, By Type (2020-2032) (USD Billion)
9.3.2.12.2 Austria Formic Acid Market Estimates and Forecasts, by Application (2020-2032) (USD Billion)
9.3.2.13 Rest of Western Europe
9.3.2.13.1 Rest of Western Europe Formic Acid Market Estimates and Forecasts, By Type (2020-2032) (USD Billion)
9.3.2.13.2 Rest of Western Europe Formic Acid Market Estimates and Forecasts, by Application (2020-2032) (USD Billion)
9.4 Asia Pacific
9.4.1 Trends Analysis
9.4.2 Asia Pacific Formic Acid Market Estimates and Forecasts, by Country (2020-2032) (USD Billion)
9.4.3 Asia Pacific Formic Acid Market Estimates and Forecasts, By Type (2020-2032) (USD Billion)
9.4.4 Asia Pacific Formic Acid Market Estimates and Forecasts, by Application (2020-2032) (USD Billion)
9.4.5 China
9.4.5.1 China Formic Acid Market Estimates and Forecasts, By Type (2020-2032) (USD Billion)
9.4.5.2 China Formic Acid Market Estimates and Forecasts, by Application (2020-2032) (USD Billion)
9.4.6 India
9.4.5.1 India Formic Acid Market Estimates and Forecasts, By Type (2020-2032) (USD Billion)
9.4.5.2 India Formic Acid Market Estimates and Forecasts, by Application (2020-2032) (USD Billion)
9.4.5 Japan
9.4.5.1 Japan Formic Acid Market Estimates and Forecasts, By Type (2020-2032) (USD Billion)
9.4.5.2 Japan Formic Acid Market Estimates and Forecasts, by Application (2020-2032) (USD Billion)
9.4.6 South Korea
9.4.6.1 South Korea Formic Acid Market Estimates and Forecasts, By Type (2020-2032) (USD Billion)
9.4.6.2 South Korea Formic Acid Market Estimates and Forecasts, by Application (2020-2032) (USD Billion)
9.4.7 Vietnam
9.4.7.1 Vietnam Formic Acid Market Estimates and Forecasts, By Type (2020-2032) (USD Billion)
9.2.7.2 Vietnam Formic Acid Market Estimates and Forecasts, by Application (2020-2032) (USD Billion)
9.4.8 Singapore
9.4.8.1 Singapore Formic Acid Market Estimates and Forecasts, By Type (2020-2032) (USD Billion)
9.4.8.2 Singapore Formic Acid Market Estimates and Forecasts, by Application (2020-2032) (USD Billion)
9.4.9 Australia
9.4.9.1 Australia Formic Acid Market Estimates and Forecasts, By Type (2020-2032) (USD Billion)
9.4.9.2 Australia Formic Acid Market Estimates and Forecasts, by Application (2020-2032) (USD Billion)
9.4.10 Rest of Asia Pacific
9.4.10.1 Rest of Asia Pacific Formic Acid Market Estimates and Forecasts, By Type (2020-2032) (USD Billion)
9.4.10.2 Rest of Asia Pacific Formic Acid Market Estimates and Forecasts, by Application (2020-2032) (USD Billion)
9.5 Middle East and Africa
9.5.1 Middle East
9.5.1.1 Trends Analysis
9.5.1.2 Middle East Formic Acid Market Estimates and Forecasts, by Country (2020-2032) (USD Billion)
9.5.1.3 Middle East Formic Acid Market Estimates and Forecasts, By Type (2020-2032) (USD Billion)
9.5.1.4 Middle East Formic Acid Market Estimates and Forecasts, by Application (2020-2032) (USD Billion)
9.5.1.5 UAE
9.5.1.5.1 UAE Formic Acid Market Estimates and Forecasts, By Type (2020-2032) (USD Billion)
9.5.1.5.2 UAE Formic Acid Market Estimates and Forecasts, by Application (2020-2032) (USD Billion)
9.5.1.6 Egypt
9.5.1.6.1 Egypt Formic Acid Market Estimates and Forecasts, By Type (2020-2032) (USD Billion)
9.5.1.6.2 Egypt Formic Acid Market Estimates and Forecasts, by Application (2020-2032) (USD Billion)
9.5.1.7 Saudi Arabia
9.5.1.7.1 Saudi Arabia Formic Acid Market Estimates and Forecasts, By Type (2020-2032) (USD Billion)
9.5.1.7.2 Saudi Arabia Formic Acid Market Estimates and Forecasts, by Application (2020-2032) (USD Billion)
9.5.1.8 Qatar
9.5.1.8.1 Qatar Formic Acid Market Estimates and Forecasts, By Type (2020-2032) (USD Billion)
9.5.1.8.2 Qatar Formic Acid Market Estimates and Forecasts, by Application (2020-2032) (USD Billion)
9.5.1.9 Rest of Middle East
9.5.1.9.1 Rest of Middle East Formic Acid Market Estimates and Forecasts, By Type (2020-2032) (USD Billion)
9.5.1.9.2 Rest of Middle East Formic Acid Market Estimates and Forecasts, by Application (2020-2032) (USD Billion)
9.5.2 Africa
9.5.2.1 Trends Analysis
9.5.2.2 Africa Formic Acid Market Estimates and Forecasts, by Country (2020-2032) (USD Billion)
9.5.2.3 Africa Formic Acid Market Estimates and Forecasts, By Type (2020-2032) (USD Billion)
9.5.2.4 Africa Formic Acid Market Estimates and Forecasts, by Application (2020-2032) (USD Billion)
9.5.2.5 South Africa
9.5.2.5.1 South Africa Formic Acid Market Estimates and Forecasts, By Type (2020-2032) (USD Billion)
9.5.2.5.2 South Africa Formic Acid Market Estimates and Forecasts, by Application (2020-2032) (USD Billion)
9.5.2.6 Nigeria
9.5.2.6.1 Nigeria Formic Acid Market Estimates and Forecasts, By Type (2020-2032) (USD Billion)
9.5.2.6.2 Nigeria Formic Acid Market Estimates and Forecasts, by Application (2020-2032) (USD Billion)
9.6 Latin America
9.6.1 Trends Analysis
9.6.2 Latin America Formic Acid Market Estimates and Forecasts, by Country (2020-2032) (USD Billion)
9.6.3 Latin America Formic Acid Market Estimates and Forecasts, By Type (2020-2032) (USD Billion)
9.6.4 Latin America Formic Acid Market Estimates and Forecasts, by Application (2020-2032) (USD Billion)
9.6.5 Brazil
9.6.5.1 Brazil Formic Acid Market Estimates and Forecasts, By Type (2020-2032) (USD Billion)
9.6.5.2 Brazil Formic Acid Market Estimates and Forecasts, by Application (2020-2032) (USD Billion)
9.6.6 Argentina
9.6.6.1 Argentina Formic Acid Market Estimates and Forecasts, By Type (2020-2032) (USD Billion)
9.6.6.2 Argentina Formic Acid Market Estimates and Forecasts, by Application (2020-2032) (USD Billion)
9.6.7 Colombia
9.6.7.1 Colombia Formic Acid Market Estimates and Forecasts, By Type (2020-2032) (USD Billion)
9.6.7.2 Colombia Formic Acid Market Estimates and Forecasts, by Application (2020-2032) (USD Billion)
9.6.8 Rest of Latin America
9.6.8.1 Rest of Latin America Formic Acid Market Estimates and Forecasts, By Type (2020-2032) (USD Billion)
9.6.8.2 Rest of Latin America Formic Acid Market Estimates and Forecasts, by Application (2020-2032) (USD Billion)
10. Company Profiles
10.1 BASF SE
10.1.1 Company Overview
10.1.2 Financial
10.1.3 Product / Services Offered
10.1.4 SWOT Analysis
10.2 Eastman Chemical Company
10.2.1 Company Overview
10.2.2 Financial
10.2.3 Product/ Services Offered
10.2.4 SWOT Analysis
10.3 Perstorp Holding AB
10.3.1 Company Overview
10.3.2 Financial
10.3.3 Product/ Services Offered
10.3.4 SWOT Analysis
10.4 Feicheng Acid Chemicals Co., Ltd
10.4.1 Company Overview
10.4.2 Financial
10.4.3 Product/ Services Offered
10.4.4 SWOT Analysis
10.5 LUXI Group Co., Ltd.
10.5.1 Company Overview
10.5.2 Financial
10.5.3 Product/ Services Offered
10.5.4 SWOT Analysis
10.6 Gujarat Narmada Valley Fertilizers & Chemicals Limited
10.6.1 Company Overview
10.6.2 Financial
10.6.3 Product/ Services Offered
10.6.4 SWOT Analysis
10.7 Shandong Acid Technology Co., Ltd.
10.7.1 Company Overview
10.7.2 Financial
10.7.3 Product/ Services Offered
10.7.4 SWOT Analysis
10.8 Kemira Oyj
10.8.1 Company Overview
10.8.2 Financial
10.8.3 Product/ Services Offered
10.8.4 SWOT Analysis
10.9 Rashtriya Chemicals and Fertilizers Limited
10.9.1 Company Overview
10.9.2 Financial
10.9.3 Product/ Services Offered
10.9.4 SWOT Analysis
10.10 Wuhan Ruisunny Chemical Co., Ltd.
10.10.1 Company Overview
10.10.2 Financial
10.10.3 Product/ Services Offered
10.10.4 SWOT Analysis
11. Use Cases and Best Practices
12. Conclusion
An accurate research report requires proper strategizing as well as implementation. There are multiple factors involved in the completion of good and accurate research report and selecting the best methodology to compete the research is the toughest part. Since the research reports we provide play a crucial role in any company’s decision-making process, therefore we at SNS Insider always believe that we should choose the best method which gives us results closer to reality. This allows us to reach at a stage wherein we can provide our clients best and accurate investment to output ratio.
Each report that we prepare takes a timeframe of 350-400 business hours for production. Starting from the selection of titles through a couple of in-depth brain storming session to the final QC process before uploading our titles on our website we dedicate around 350 working hours. The titles are selected based on their current market cap and the foreseen CAGR and growth.
The 5 steps process:
Step 1: Secondary Research:
Secondary Research or Desk Research is as the name suggests is a research process wherein, we collect data through the readily available information. In this process we use various paid and unpaid databases which our team has access to and gather data through the same. This includes examining of listed companies’ annual reports, Journals, SEC filling etc. Apart from this our team has access to various associations across the globe across different industries. Lastly, we have exchange relationships with various university as well as individual libraries.

Step 2: Primary Research
When we talk about primary research, it is a type of study in which the researchers collect relevant data samples directly, rather than relying on previously collected data. This type of research is focused on gaining content specific facts that can be sued to solve specific problems. Since the collected data is fresh and first hand therefore it makes the study more accurate and genuine.
We at SNS Insider have divided Primary Research into 2 parts.
Part 1 wherein we interview the KOLs of major players as well as the upcoming ones across various geographic regions. This allows us to have their view over the market scenario and acts as an important tool to come closer to the accurate market numbers. As many as 45 paid and unpaid primary interviews are taken from both the demand and supply side of the industry to make sure we land at an accurate judgement and analysis of the market.
This step involves the triangulation of data wherein our team analyses the interview transcripts, online survey responses and observation of on filed participants. The below mentioned chart should give a better understanding of the part 1 of the primary interview.

Part 2: In this part of primary research the data collected via secondary research and the part 1 of the primary research is validated with the interviews from individual consultants and subject matter experts.
Consultants are those set of people who have at least 12 years of experience and expertise within the industry whereas Subject Matter Experts are those with at least 15 years of experience behind their back within the same space. The data with the help of two main processes i.e., FGDs (Focused Group Discussions) and IDs (Individual Discussions). This gives us a 3rd party nonbiased primary view of the market scenario making it a more dependable one while collation of the data pointers.
Step 3: Data Bank Validation
Once all the information is collected via primary and secondary sources, we run that information for data validation. At our intelligence centre our research heads track a lot of information related to the market which includes the quarterly reports, the daily stock prices, and other relevant information. Our data bank server gets updated every fortnight and that is how the information which we collected using our primary and secondary information is revalidated in real time.

Step 4: QA/QC Process
After all the data collection and validation our team does a final level of quality check and quality assurance to get rid of any unwanted or undesired mistakes. This might include but not limited to getting rid of the any typos, duplication of numbers or missing of any important information. The people involved in this process include technical content writers, research heads and graphics people. Once this process is completed the title gets uploader on our platform for our clients to read it.
Step 5: Final QC/QA Process:
This is the last process and comes when the client has ordered the study. In this process a final QA/QC is done before the study is emailed to the client. Since we believe in giving our clients a good experience of our research studies, therefore, to make sure that we do not lack at our end in any way humanly possible we do a final round of quality check and then dispatch the study to the client.
Key Segments:
By Type
Grade 85%
Grade 94%
Grade 99%
Others
By Application
Agriculture
Animal Feed
Leather & Textile
Rubber
Chemical & Pharmaceutical
Others
Request for Segment Customization as per your Business Requirement: Segment Customization Request
Regional Coverage:
North America
US
Canada
Mexico
Europe
Eastern Europe
Poland
Romania
Hungary
Turkey
Rest of Eastern Europe
Western Europe
Germany
France
UK
Italy
Spain
Netherlands
Switzerland
Austria
Rest of Western Europe
Asia Pacific
China
India
Japan
South Korea
Vietnam
Singapore
Australia
Rest of Asia Pacific
Middle East & Africa
Middle East
UAE
Egypt
Saudi Arabia
Qatar
Rest of Middle East
Africa
Nigeria
South Africa
Rest of Africa
Latin America
Brazil
Argentina
Colombia
Rest of Latin America
Request for Country Level Research Report: Country Level Customization Request
Available Customization
With the given market data, SNS Insider offers customization as per the company’s specific needs. The following customization options are available for the report:
Detailed Volume Analysis
Criss-Cross segment analysis (e.g. Product X Application)
Competitive Product Benchmarking
Geographic Analysis
Additional countries in any of the regions
Customized Data Representation
Detailed analysis and profiling of additional market players
The Geocomposites Market Size was valued at USD 445.3 million in 2023, and is expected to reach USD 776.0 million by 2032, and grow at a CAGR of 6.4% over the forecast period 2024-2032.
The Natural Dyes Market Size was valued at USD 4.57 Billion in 2023 and is expected to reach USD 7.54 Billion by 2032, growing at a CAGR of 5.73% over the forecast period of 2024-2032.
The Thermal conductive polymer material Market size was USD 155.7 million in 2023 and is expected to Reach USD 456.9 million by 2032 and grow at a CAGR of 12.7% over the forecast period of 2024-2032.
Acrylic Processing Aid Market was USD 731.04 million in 2023 and is expected to reach USD 1213.94 million by 2032, at a CAGR of 5.80% from 2024 to 2032.
The Drilling Fluids Market was valued at $ 10.06 Billion in 2023 and is expected to reach $ 14.75 Billion by 2032, growing at a CAGR of 4.72% from 2024-2032.
The Polyimide Films and Tapes Market size was valued at USD 1.9 Billion in 2023. It is expected to grow to USD 3.6 Billion by 2032 and grow at a CAGR of 8.2% over the forecast period of 2024-2032.

Hi! Click one of our member below to chat on Phone
© 2025 All Rights Reserved by SNS Insider Pvt Ltd


