The Forensic Accounting Services Market Size was valued at USD 13.79 Billion in 2023 and is expected to reach USD 25.89 Billion by 2032 and grow at a CAGR of 7.31% over the forecast period 2024-2032.
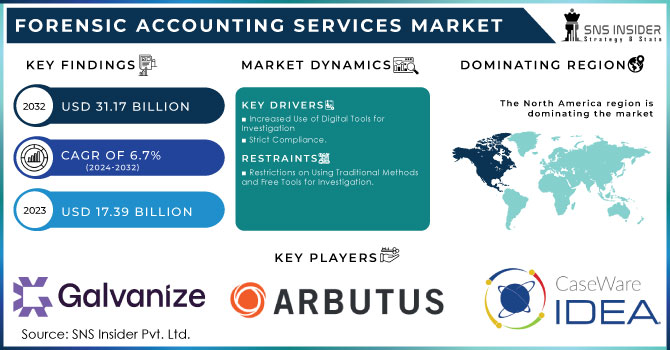
The Market is growing rapidly due to rising corporate fraud, financial crimes, and regulatory compliance needs. Industries like banking, insurance, law enforcement, and government are leveraging forensic accounting to prevent fraud and support litigation. Advanced technologies such as AI, big data, blockchain, and machine learning enhance fraud detection and risk assessment. Leading firms like Deloitte, PwC, KPMG, CaseWare IDEA, and OpenText are expanding AI-driven forensic solutions. Increased cybercrime, stricter regulations, and corporate governance reforms drive market demand. With growing investments in forensic technology and fraud prevention, forensic accounting is becoming essential for due diligence, ensuring transparency and compliance.
Get More Information on Forensic Accounting Services Market - Request Free Sample Report
Key Drivers:
Increasing Corporate Fraud and Regulatory Compliance Requirements Propel the Forensic Accounting Services Market Growth
The rising incidences of corporate fraud, financial crimes, and money laundering have fueled the demand for forensic accounting services. Governments and financial regulators worldwide are implementing stricter compliance laws, anti-money laundering (AML) regulations, and financial reporting standards, compelling organizations to adopt forensic accounting solutions. With the growing complexity of financial transactions, mergers, acquisitions, and tax compliance, businesses are increasingly relying on forensic accountants to identify financial irregularities, conduct fraud investigations, and mitigate risks.
Moreover, high-profile corporate scandals and financial misstatements have intensified the need for transparent auditing and fraud prevention frameworks. Companies are leveraging AI-driven forensic tools, blockchain-based audits, and predictive analytics to strengthen their fraud detection mechanisms. Industries such as banking, insurance, government, and law enforcement are the primary adopters of forensic accounting solutions, ensuring compliance with evolving regulatory frameworks. This increasing focus on financial transparency and risk mitigation is driving the rapid growth of the forensic accounting services market.
Restraint:
High Cost of Forensic Accounting Services Limits Adoption Among Small and Medium-Sized Enterprises (SMEs)
Despite the growing importance of forensic accounting, the high cost of forensic investigations, auditing tools, and compliance software poses a significant challenge, especially for SMEs and startups. Hiring forensic accountants or outsourcing forensic services can be expensive, making it difficult for smaller businesses to invest in fraud detection solutions.
Additionally, advanced forensic technologies such as AI-powered fraud analytics, blockchain auditing, and big data analysis tools require substantial financial investment, infrastructure, and skilled professionals, further increasing costs. Many organizations opt for traditional auditing methods rather than investing in forensic accounting solutions due to budget constraints. Moreover, forensic investigations can be time-consuming and resource-intensive, adding to operational expenses. The lack of affordable forensic accounting solutions for small businesses restricts market penetration, as larger enterprises remain the primary users. Addressing cost-related concerns through scalable, cost-effective forensic solutions could help drive broader adoption across diverse industry verticals.
Opportunity:
Integration of AI, Big Data, and Blockchain Enhances Efficiency in Forensic Accounting Services
The integration of artificial intelligence (AI), big data analytics, and blockchain technology is revolutionizing forensic accounting services by improving fraud detection, risk assessment, and compliance auditing. AI-powered tools can analyze vast amounts of financial data, identify anomalies, and detect fraudulent activities in real-time, reducing human error and investigation time. Big data analytics enables forensic accountants to track financial transactions across global networks, strengthening fraud prevention mechanisms.
Meanwhile, blockchain technology offers a transparent and immutable ledger, ensuring financial records remain secure and tamper-proof. Leading forensic firms, including Deloitte, PwC, and KPMG, are adopting AI-driven forensic tools and blockchain auditing systems to enhance financial transparency and fraud detection capabilities. The growing demand for automated forensic solutions presents a significant opportunity for market expansion, enabling businesses to adopt cost-effective and efficient forensic accounting practices that comply with evolving financial regulations and corporate governance standards.
Challenge:
Shortage of Skilled Forensic Accountants and Experts Hampers Market Growth
The forensic accounting services market faces a significant talent gap, as there is a shortage of qualified forensic accountants, fraud examiners, and forensic auditors with expertise in handling complex financial investigations. The increasing use of AI, machine learning, and blockchain in forensic accounting requires professionals with technical proficiency and analytical skills, but there is a limited workforce with the necessary qualifications. Many organizations struggle to find trained forensic specialists who can interpret forensic data, analyze financial discrepancies, and provide litigation support.
Furthermore, forensic accounting requires certifications such as Certified Fraud Examiner (CFE), Chartered Accountant (CA), and Certified Forensic Accountant (CFA), which demand extensive training and experience. The lack of specialized educational programs and hands-on training in forensic accounting technologies further contributes to the talent shortage. To bridge this gap, industry leaders are investing in training programs, AI-driven forensic platforms, and collaborative initiatives to develop the next generation of forensic accounting professionals.
By Component
In 2023, the Services segment dominated the Forensic Accounting Services Market, accounting for 54% of total revenue due to the increasing demand for fraud investigation, litigation support, risk assessment, and regulatory compliance consulting. Companies and government agencies rely on forensic accounting firms to detect financial irregularities, conduct in-depth forensic audits, and ensure adherence to evolving financial regulations. Leading firms such as Deloitte, PwC, and KPMG have expanded their forensic services portfolio, integrating AI-driven forensic analytics, blockchain-based audit trails, and predictive fraud detection tools.
For instance, PwC launched an AI-powered forensic investigation tool in 2023, enhancing real-time fraud detection and transaction monitoring capabilities. Similarly, Deloitte introduced a blockchain forensic solution to improve the accuracy of financial fraud investigations.
The rise in cyber fraud, money laundering cases, and corporate scandals has further fueled demand for forensic accounting services. Additionally, forensic accounting plays a critical role in mergers and acquisitions, bankruptcy investigations, and compliance auditing. The adoption of cloud-based forensic solutions and data analytics services has further strengthened the segment’s growth.
By End-user
In 2023, the Banking and Insurance segment dominated the Forensic Accounting Services Market, accounting for 38% of total revenue, driven by the rising cases of financial fraud, money laundering, and regulatory compliance requirements. Banks and insurance firms are increasingly investing in forensic accounting solutions to detect fraudulent transactions, prevent cybercrime, and ensure adherence to stringent regulations such as AML (Anti-Money Laundering) laws, KYC (Know Your Customer) norms, and IFRS (International Financial Reporting Standards). Leading financial institutions are partnering with forensic accounting firms to enhance fraud detection and risk mitigation.
Deloitte launched an AI-driven fraud analytics platform in 2023, offering real-time transaction monitoring and anomaly detection. Similarly, PwC introduced a blockchain-powered forensic solution to improve transparency in financial audits and claim assessments.
With the increasing adoption of AI, machine learning, and big data analytics, forensic accounting is playing a crucial role in strengthening financial security and operational efficiency in the banking and insurance sectors. The rise of digital banking, mobile payments, and cryptocurrency transactions has further intensified the need for advanced forensic investigation services.
The Law Enforcement Agencies segment is experiencing the fastest growth in the Forensic Accounting Services Market, with a CAGR of 8.24% during the forecast period, driven by the increasing need for financial crime investigations, cyber fraud detection, and asset recovery in criminal cases. Governments and regulatory bodies are actively adopting forensic accounting solutions to combat financial crimes, terrorism financing, and corruption. Law enforcement agencies rely on forensic accountants to track illicit financial activities, analyze money laundering schemes, and support legal proceedings.
With the rise of cyber-enabled financial crimes, ransomware attacks, and tax evasion cases, forensic accounting has become a crucial asset for law enforcement. Additionally, the growing collaboration between forensic accounting firms, cybersecurity agencies, and government bodies is accelerating the adoption of AI-driven fraud detection solutions.
In 2023, North America dominated the Forensic Accounting Services Market, accounting for an estimated 41% market share, driven by the region’s stringent financial regulations, high fraud incidence rates, and strong presence of forensic accounting firms. The U.S. and Canada are at the forefront, with regulatory bodies such as the Securities and Exchange Commission (SEC), Financial Crimes Enforcement Network (FinCEN), and Public Company Accounting Oversight Board (PCAOB) enforcing strict financial compliance measures.
Additionally, the rise in cyber-enabled financial crimes, corporate scandals, and increased litigation cases has fueled the demand for forensic accounting services. The North American market is expected to maintain its dominance, driven by technological advancements and regulatory enforcement actions in financial crime investigations.
Asia Pacific emerged as the fastest-growing region in the Forensic Accounting Services Market in 2023, with an estimated CAGR of 9.5%, driven by rising financial fraud cases, regulatory reforms, and rapid digital transformation. Countries such as China, India, Japan, and Singapore are experiencing a surge in corporate fraud investigations, cybercrime incidents, and money laundering activities, prompting businesses and governments to invest heavily in forensic accounting services.
In 2023, KPMG launched an AI-powered forensic risk assessment tool in India, strengthening fraud detection in the banking and corporate sectors. Similarly, Deloitte introduced blockchain-based forensic audit solutions in China, improving transparency in financial transactions. The increasing adoption of cloud-based forensic tools, AI-driven fraud analytics, and big data solutions is further driving market growth. With expanding financial sectors, stricter anti-fraud regulations, and growing awareness of financial crime risks, Asia Pacific is poised to become a key player in the forensic accounting landscape, with significant investment opportunities in the coming years.
Need any customization research on Forensic Accounting Services Market - Enquiry Now
Some of the major players in the Forensic Accounting Services Market are:
Galvanize (ACL Analytics, HighBond)
CaseWare IDEA (IDEA Data Analysis Software, CaseWare Monitor)
Arbutus Software Inc. (Arbutus Analyzer, Arbutus Connect)
Fulcrum Management (Fulcrum Audit, Fulcrum Risk Management)
Nuix Cygna Labs Corp (Nuix Workstation, Nuix Investigate)
e-fense (Helix3 Pro, Live Response)
Passware (Passware Kit Forensic, Passware Encryption Analyzer)
OpenText (EnCase Forensic, OpenText Axcelerate)
Cellebrite (UFED Cloud Analyzer, Cellebrite Pathfinder)
Sama Audit Systems & Software Pvt Ltd. (Sama Audit Tool, Sama Fraud Detection System)
Deloitte (Deloitte TrueVoice, Deloitte Radar)
PwC (Halo Forensics, PwC Fraud Detection Analytics)
Ernst & Young (EY Virtual Analytics Infrastructure, EY Helix)
Grant Thornton (Fraud Analytics Solution, GT Forensic Technology)
BDO International (BDO Digital Forensics, BDO Fraud Analytics)
KPMG International (KPMG Discovery Radar, KPMG Forensic Data Analytics)
May 2024: Galvanize introduced a new suite of AI-powered analytics tools designed to enhance forensic accounting capabilities, enabling auditors to detect anomalies and potential fraud more effectively.
September 2024: CaseWare extended the availability of its Environmental, Social, and Governance (ESG) reporting application to the Netherlands, Belgium, Luxembourg, and Denmark, supporting firms with sustainability reporting across all stages.
Report Attributes | Details |
---|---|
Market Size in 2023 | US$ 13.79 Billion |
Market Size by 2032 | US$ 25.89 Billion |
CAGR | CAGR of 7.31 % From 2024 to 2032 |
Base Year | 2023 |
Forecast Period | 2024-2032 |
Historical Data | 2020-2022 |
Report Scope & Coverage | Market Size, Segments Analysis, Competitive Landscape, Regional Analysis, DROC & SWOT Analysis, Forecast Outlook |
Key Segments | • By Component (Solution - Forensic Tools/Software, Audit/Accounting Software, Services) • By End-User (Banking and Insurance, Law Enforcement Agencies, Government, Accounting Firm) |
Regional Analysis/Coverage | North America (US, Canada, Mexico), Europe (Eastern Europe [Poland, Romania, Hungary, Turkey, Rest of Eastern Europe] Western Europe] Germany, France, UK, Italy, Spain, Netherlands, Switzerland, Austria, Rest of Western Europe]), Asia Pacific (China, India, Japan, South Korea, Vietnam, Singapore, Australia, Rest of Asia Pacific), Middle East & Africa (Middle East [UAE, Egypt, Saudi Arabia, Qatar, Rest of Middle East], Africa [Nigeria, South Africa, Rest of Africa], Latin America (Brazil, Argentina, Colombia, Rest of Latin America) |
Company Profiles | Galvanize, CaseWare IDEA, Arbutus Software Inc., Fulcrum Management, Nuix Cygna Labs Corp, e-fense, Passware, OpenText, Cellebrite, Sama Audit Systems & Software Pvt Ltd., Deloitte, PwC, Ernst & Young, Grant Thornton, BDO International, KPMG International |
Ans: The Forensic Accounting Services Market is expected to grow at a CAGR of 7.31% during 2024-2032.
Ans: The Forensic Accounting Services Market size was USD 13.79 billion in 2023 and is expected to Reach USD 25.89 billion by 2032.
Ans: The major growth factor of the Forensic Accounting Services Market is the increasing incidence of financial fraud, cybercrime, and stringent regulatory compliance requirements.
Ans: The banking and Insurance segment dominated the Forensic Accounting Services Market.
Ans: North America dominated the Forensic Accounting Services Market in 2023.
Table of Content
1. Introduction
1.1 Market Definition
1.2 Scope (Inclusion and Exclusions)
1.3 Research Assumptions
2. Executive Summary
2.1 Market Overview
2.2 Regional Synopsis
2.3 Competitive Summary
3. Research Methodology
3.1 Top-Down Approach
3.2 Bottom-up Approach
3.3. Data Validation
3.4 Primary Interviews
4. Market Dynamics Impact Analysis
4.1 Market Driving Factors Analysis
4.1.2 Drivers
4.1.2 Restraints
4.1.3 Opportunities
4.1.4 Challenges
4.2 PESTLE Analysis
4.3 Porter’s Five Forces Model
5. Statistical Insights and Trends Reporting
5.1 Industry-Specific Demand (2023)
5.2 Fraud Investigation Case Statistics
5.3 Regulatory Compliance Impact (2023)
5.4 Mergers & Acquisitions Activity
6. Competitive Landscape
6.1 List of Major Companies, By Region
6.2 Market Share Analysis, By Region
6.3 Product Benchmarking
6.3.1 Product specifications and features
6.3.2 Pricing
6.4 Strategic Initiatives
6.4.1 Marketing and promotional activities
6.4.2 Distribution and supply chain strategies
6.4.3 Expansion plans and new product launches
6.4.4 Strategic partnerships and collaborations
6.5 Technological Advancements
6.6 Market Positioning and Branding
7. Extreme Ultraviolet Lithography Market Segmentation, By End-User
7.1 Chapter Overview
7.2 Banking and Insurance
7.2.1 Banking and Insurance Market Trends Analysis (2020-2032)
7.2.2 Banking and Insurance Market Size Estimates and Forecasts to 2032 (USD Billion)
7.3 Law Enforcement Agencies
7.3.1 Law Enforcement Agencies Market Trends Analysis (2020-2032)
7.3.2 Law Enforcement Agencies Market Size Estimates and Forecasts to 2032 (USD Billion)
7.4 Government
7.4.1 Government Market Trends Analysis (2020-2032)
7.4.2 Government Market Size Estimates and Forecasts to 2032 (USD Billion)
7.5 Accounting Firm
7.5.1 Accounting Firm Market Trends Analysis (2020-2032)
7.5.2 Accounting Firm Market Size Estimates and Forecasts to 2032 (USD Billion)
8. Extreme Ultraviolet Lithography Market Segmentation, By Component
8.1 Chapter Overview
8.2 Solution- Forensic Tools/Software
8.2.1 Solution- Forensic Tools/Software Market Trends Analysis (2020-2032)
8.2.2 Solution- Forensic Tools/Software Market Size Estimates and Forecasts to 2032 (USD Billion)
8.3 Audit/Accounting software
8.3.1 Audit/Accounting software Market Trends Analysis (2020-2032)
8.3.2 Audit/Accounting software Market Size Estimates and Forecasts to 2032 (USD Billion)
8.4 Services
8.4.1 Services Market Trends Analysis (2020-2032)
8.4.2 Services Market Size Estimates and Forecasts to 2032 (USD Billion)
9. Regional Analysis
9.1 Chapter Overview
9.2 North America
9.2.1 Trends Analysis
9.2.2 North America Extreme Ultraviolet Lithography Market Estimates and Forecasts, by Country (2020-2032) (USD Billion)
9.2.3 North America Extreme Ultraviolet Lithography Market Estimates and Forecasts, By End-User (2020-2032) (USD Billion)
9.2.4 North America Extreme Ultraviolet Lithography Market Estimates and Forecasts, By Component (2020-2032) (USD Billion)
9.2.5 USA
9.2.5.1 USA Extreme Ultraviolet Lithography Market Estimates and Forecasts, By End-User (2020-2032) (USD Billion)
9.2.5.2 USA Extreme Ultraviolet Lithography Market Estimates and Forecasts, By Component (2020-2032) (USD Billion)
9.2.6 Canada
9.2.6.1 Canada Extreme Ultraviolet Lithography Market Estimates and Forecasts, By End-User (2020-2032) (USD Billion)
9.2.6.2 Canada Extreme Ultraviolet Lithography Market Estimates and Forecasts, By Component (2020-2032) (USD Billion)
9.2.7 Mexico
9.2.7.1 Mexico Extreme Ultraviolet Lithography Market Estimates and Forecasts, By End-User (2020-2032) (USD Billion)
9.2.7.2 Mexico Extreme Ultraviolet Lithography Market Estimates and Forecasts, By Component (2020-2032) (USD Billion)
9.3 Europe
9.3.1 Eastern Europe
9.3.1.1 Trends Analysis
9.3.1.2 Eastern Europe Extreme Ultraviolet Lithography Market Estimates and Forecasts, by Country (2020-2032) (USD Billion)
9.3.1.3 Eastern Europe Extreme Ultraviolet Lithography Market Estimates and Forecasts, By End-User (2020-2032) (USD Billion)
9.3.1.4 Eastern Europe Extreme Ultraviolet Lithography Market Estimates and Forecasts, By Component (2020-2032) (USD Billion)
9.3.1.5 Poland
9.3.1.5.1 Poland Extreme Ultraviolet Lithography Market Estimates and Forecasts, By End-User (2020-2032) (USD Billion)
9.3.1.5.2 Poland Extreme Ultraviolet Lithography Market Estimates and Forecasts, By Component (2020-2032) (USD Billion)
9.3.1.6 Romania
9.3.1.6.1 Romania Extreme Ultraviolet Lithography Market Estimates and Forecasts, By End-User (2020-2032) (USD Billion)
9.3.1.6.2 Romania Extreme Ultraviolet Lithography Market Estimates and Forecasts, By Component (2020-2032) (USD Billion)
9.3.1.7 Hungary
9.3.1.7.1 Hungary Extreme Ultraviolet Lithography Market Estimates and Forecasts, By End-User (2020-2032) (USD Billion)
9.3.1.7.2 Hungary Extreme Ultraviolet Lithography Market Estimates and Forecasts, By Component (2020-2032) (USD Billion)
9.3.1.8 Turkey
9.3.1.8.1 Turkey Extreme Ultraviolet Lithography Market Estimates and Forecasts, By End-User (2020-2032) (USD Billion)
9.3.1.8.2 Turkey Extreme Ultraviolet Lithography Market Estimates and Forecasts, By Component (2020-2032) (USD Billion)
9.3.1.9 Rest of Eastern Europe
9.3.1.9.1 Rest of Eastern Europe Extreme Ultraviolet Lithography Market Estimates and Forecasts, By End-User (2020-2032) (USD Billion)
9.3.1.9.2 Rest of Eastern Europe Extreme Ultraviolet Lithography Market Estimates and Forecasts, By Component (2020-2032) (USD Billion)
9.3.2 Western Europe
9.3.2.1 Trends Analysis
9.3.2.2 Western Europe Extreme Ultraviolet Lithography Market Estimates and Forecasts, by Country (2020-2032) (USD Billion)
9.3.2.3 Western Europe Extreme Ultraviolet Lithography Market Estimates and Forecasts, By End-User (2020-2032) (USD Billion)
9.3.2.4 Western Europe Extreme Ultraviolet Lithography Market Estimates and Forecasts, By Component (2020-2032) (USD Billion)
9.3.2.5 Germany
9.3.2.5.1 Germany Extreme Ultraviolet Lithography Market Estimates and Forecasts, By End-User (2020-2032) (USD Billion)
9.3.2.5.2 Germany Extreme Ultraviolet Lithography Market Estimates and Forecasts, By Component (2020-2032) (USD Billion)
9.3.2.6 France
9.3.2.6.1 France Extreme Ultraviolet Lithography Market Estimates and Forecasts, By End-User (2020-2032) (USD Billion)
9.3.2.6.2 France Extreme Ultraviolet Lithography Market Estimates and Forecasts, By Component (2020-2032) (USD Billion)
9.3.2.7 UK
9.3.2.7.1 UK Extreme Ultraviolet Lithography Market Estimates and Forecasts, By End-User (2020-2032) (USD Billion)
9.3.2.7.2 UK Extreme Ultraviolet Lithography Market Estimates and Forecasts, By Component (2020-2032) (USD Billion)
9.3.2.8 Italy
9.3.2.8.1 Italy Extreme Ultraviolet Lithography Market Estimates and Forecasts, By End-User (2020-2032) (USD Billion)
9.3.2.8.2 Italy Extreme Ultraviolet Lithography Market Estimates and Forecasts, By Component (2020-2032) (USD Billion)
9.3.2.9 Spain
9.3.2.9.1 Spain Extreme Ultraviolet Lithography Market Estimates and Forecasts, By End-User (2020-2032) (USD Billion)
9.3.2.9.2 Spain Extreme Ultraviolet Lithography Market Estimates and Forecasts, By Component (2020-2032) (USD Billion)
9.3.2.10 Netherlands
9.3.2.10.1 Netherlands Extreme Ultraviolet Lithography Market Estimates and Forecasts, By End-User (2020-2032) (USD Billion)
9.3.2.10.2 Netherlands Extreme Ultraviolet Lithography Market Estimates and Forecasts, By Component (2020-2032) (USD Billion)
9.3.2.11 Switzerland
9.3.2.11.1 Switzerland Extreme Ultraviolet Lithography Market Estimates and Forecasts, By End-User (2020-2032) (USD Billion)
9.3.2.11.2 Switzerland Extreme Ultraviolet Lithography Market Estimates and Forecasts, By Component (2020-2032) (USD Billion)
9.3.2.12 Austria
9.3.2.12.1 Austria Extreme Ultraviolet Lithography Market Estimates and Forecasts, By End-User (2020-2032) (USD Billion)
9.3.2.12.2 Austria Extreme Ultraviolet Lithography Market Estimates and Forecasts, By Component (2020-2032) (USD Billion)
9.3.2.13 Rest of Western Europe
9.3.2.13.1 Rest of Western Europe Extreme Ultraviolet Lithography Market Estimates and Forecasts, By End-User (2020-2032) (USD Billion)
9.3.2.13.2 Rest of Western Europe Extreme Ultraviolet Lithography Market Estimates and Forecasts, By Component (2020-2032) (USD Billion)
9.4 Asia Pacific
9.4.1 Trends Analysis
9.4.2 Asia Pacific Extreme Ultraviolet Lithography Market Estimates and Forecasts, by Country (2020-2032) (USD Billion)
9.4.3 Asia Pacific Extreme Ultraviolet Lithography Market Estimates and Forecasts, By End-User (2020-2032) (USD Billion)
9.4.4 Asia Pacific Extreme Ultraviolet Lithography Market Estimates and Forecasts, By Component (2020-2032) (USD Billion)
9.4.5 China
9.4.5.1 China Extreme Ultraviolet Lithography Market Estimates and Forecasts, By End-User (2020-2032) (USD Billion)
9.4.5.2 China Extreme Ultraviolet Lithography Market Estimates and Forecasts, By Component (2020-2032) (USD Billion)
9.4.6 India
9.4.5.1 India Extreme Ultraviolet Lithography Market Estimates and Forecasts, By End-User (2020-2032) (USD Billion)
9.4.5.2 India Extreme Ultraviolet Lithography Market Estimates and Forecasts, By Component (2020-2032) (USD Billion)
9.4.5 Japan
9.4.5.1 Japan Extreme Ultraviolet Lithography Market Estimates and Forecasts, By End-User (2020-2032) (USD Billion)
9.4.5.2 Japan Extreme Ultraviolet Lithography Market Estimates and Forecasts, By Component (2020-2032) (USD Billion)
9.4.6 South Korea
9.4.6.1 South Korea Extreme Ultraviolet Lithography Market Estimates and Forecasts, By End-User (2020-2032) (USD Billion)
9.4.6.2 South Korea Extreme Ultraviolet Lithography Market Estimates and Forecasts, By Component (2020-2032) (USD Billion)
9.4.7 Vietnam
9.4.7.1 Vietnam Extreme Ultraviolet Lithography Market Estimates and Forecasts, By End-User (2020-2032) (USD Billion)
9.2.7.2 Vietnam Extreme Ultraviolet Lithography Market Estimates and Forecasts, By Component (2020-2032) (USD Billion)
9.4.8 Singapore
9.4.8.1 Singapore Extreme Ultraviolet Lithography Market Estimates and Forecasts, By End-User (2020-2032) (USD Billion)
9.4.8.2 Singapore Extreme Ultraviolet Lithography Market Estimates and Forecasts, By Component (2020-2032) (USD Billion)
9.4.9 Australia
9.4.9.1 Australia Extreme Ultraviolet Lithography Market Estimates and Forecasts, By End-User (2020-2032) (USD Billion)
9.4.9.2 Australia Extreme Ultraviolet Lithography Market Estimates and Forecasts, By Component (2020-2032) (USD Billion)
9.4.10 Rest of Asia Pacific
9.4.10.1 Rest of Asia Pacific Extreme Ultraviolet Lithography Market Estimates and Forecasts, By End-User (2020-2032) (USD Billion)
9.4.10.2 Rest of Asia Pacific Extreme Ultraviolet Lithography Market Estimates and Forecasts, By Component (2020-2032) (USD Billion)
9.5 Middle East and Africa
9.5.1 Middle East
9.5.1.1 Trends Analysis
9.5.1.2 Middle East Extreme Ultraviolet Lithography Market Estimates and Forecasts, by Country (2020-2032) (USD Billion)
9.5.1.3 Middle East Extreme Ultraviolet Lithography Market Estimates and Forecasts, By End-User (2020-2032) (USD Billion)
9.5.1.4 Middle East Extreme Ultraviolet Lithography Market Estimates and Forecasts, By Component (2020-2032) (USD Billion)
9.5.1.5 UAE
9.5.1.5.1 UAE Extreme Ultraviolet Lithography Market Estimates and Forecasts, By End-User (2020-2032) (USD Billion)
9.5.1.5.2 UAE Extreme Ultraviolet Lithography Market Estimates and Forecasts, By Component (2020-2032) (USD Billion)
9.5.1.6 Egypt
9.5.1.6.1 Egypt Extreme Ultraviolet Lithography Market Estimates and Forecasts, By End-User (2020-2032) (USD Billion)
9.5.1.6.2 Egypt Extreme Ultraviolet Lithography Market Estimates and Forecasts, By Component (2020-2032) (USD Billion)
9.5.1.7 Saudi Arabia
9.5.1.7.1 Saudi Arabia Extreme Ultraviolet Lithography Market Estimates and Forecasts, By End-User (2020-2032) (USD Billion)
9.5.1.7.2 Saudi Arabia Extreme Ultraviolet Lithography Market Estimates and Forecasts, By Component (2020-2032) (USD Billion)
9.5.1.8 Qatar
9.5.1.8.1 Qatar Extreme Ultraviolet Lithography Market Estimates and Forecasts, By End-User (2020-2032) (USD Billion)
9.5.1.8.2 Qatar Extreme Ultraviolet Lithography Market Estimates and Forecasts, By Component (2020-2032) (USD Billion)
9.5.1.9 Rest of Middle East
9.5.1.9.1 Rest of Middle East Extreme Ultraviolet Lithography Market Estimates and Forecasts, By End-User (2020-2032) (USD Billion)
9.5.1.9.2 Rest of Middle East Extreme Ultraviolet Lithography Market Estimates and Forecasts, By Component (2020-2032) (USD Billion)
9.5.2 Africa
9.5.2.1 Trends Analysis
9.5.2.2 Africa Extreme Ultraviolet Lithography Market Estimates and Forecasts, by Country (2020-2032) (USD Billion)
9.5.2.3 Africa Extreme Ultraviolet Lithography Market Estimates and Forecasts, By End-User (2020-2032) (USD Billion)
9.5.2.4 Africa Extreme Ultraviolet Lithography Market Estimates and Forecasts, By Component (2020-2032) (USD Billion)
9.5.2.5 South Africa
9.5.2.5.1 South Africa Extreme Ultraviolet Lithography Market Estimates and Forecasts, By End-User (2020-2032) (USD Billion)
9.5.2.5.2 South Africa Extreme Ultraviolet Lithography Market Estimates and Forecasts, By Component (2020-2032) (USD Billion)
9.5.2.6 Nigeria
9.5.2.6.1 Nigeria Extreme Ultraviolet Lithography Market Estimates and Forecasts, By End-User (2020-2032) (USD Billion)
9.5.2.6.2 Nigeria Extreme Ultraviolet Lithography Market Estimates and Forecasts, By Component (2020-2032) (USD Billion)
9.5.2.7 Rest of Africa
9.5.2.7.1 Rest of Africa Extreme Ultraviolet Lithography Market Estimates and Forecasts, By End-User (2020-2032) (USD Billion)
9.5.2.7.2 Rest of Africa Extreme Ultraviolet Lithography Market Estimates and Forecasts, By Component (2020-2032) (USD Billion)
9.6 Latin America
9.6.1 Trends Analysis
9.6.2 Latin America Extreme Ultraviolet Lithography Market Estimates and Forecasts, by Country (2020-2032) (USD Billion)
9.6.3 Latin America Extreme Ultraviolet Lithography Market Estimates and Forecasts, By End-User (2020-2032) (USD Billion)
9.6.4 Latin America Extreme Ultraviolet Lithography Market Estimates and Forecasts, By Component (2020-2032) (USD Billion)
9.6.5 Brazil
9.6.5.1 Brazil Extreme Ultraviolet Lithography Market Estimates and Forecasts, By End-User (2020-2032) (USD Billion)
9.6.5.2 Brazil Extreme Ultraviolet Lithography Market Estimates and Forecasts, By Component (2020-2032) (USD Billion)
9.6.6 Argentina
9.6.6.1 Argentina Extreme Ultraviolet Lithography Market Estimates and Forecasts, By End-User (2020-2032) (USD Billion)
9.6.6.2 Argentina Extreme Ultraviolet Lithography Market Estimates and Forecasts, By Component (2020-2032) (USD Billion)
9.6.7 Colombia
9.6.7.1 Colombia Extreme Ultraviolet Lithography Market Estimates and Forecasts, By End-User (2020-2032) (USD Billion)
9.6.7.2 Colombia Extreme Ultraviolet Lithography Market Estimates and Forecasts, By Component (2020-2032) (USD Billion)
9.6.8 Rest of Latin America
9.6.8.1 Rest of Latin America Extreme Ultraviolet Lithography Market Estimates and Forecasts, By End-User (2020-2032) (USD Billion)
9.6.8.2 Rest of Latin America Extreme Ultraviolet Lithography Market Estimates and Forecasts, By Component (2020-2032) (USD Billion)
10. Company Profiles
10.1 Galvanize
10.1.1 Company Overview
10.1.2 Financial
10.1.3 Products/ Services Offered
110.1.4 SWOT Analysis
10.2 CaseWare IDEA
10.2.1 Company Overview
10.2.2 Financial
10.2.3 Products/ Services Offered
10.2.4 SWOT Analysis
10.3 Arbutus Software Inc.
10.3.1 Company Overview
10.3.2 Financial
10.3.3 Products/ Services Offered
10.3.4 SWOT Analysis
10.4 Fulcrum Management
10.4.1 Company Overview
10.4.2 Financial
10.4.3 Products/ Services Offered
10.4.4 SWOT Analysis
10.5 Nuix Cygna Labs Corp
10.5.1 Company Overview
10.5.2 Financial
10.5.3 Products/ Services Offered
10.5.4 SWOT Analysis
10.6 e-fense
10.6.1 Company Overview
10.6.2 Financial
10.6.3 Products/ Services Offered
10.6.4 SWOT Analysis
10.7 Passware
10.7.1 Company Overview
10.7.2 Financial
10.7.3 Products/ Services Offered
10.7.4 SWOT Analysis
10.8 OpenText
10.8.1 Company Overview
10.8.2 Financial
10.8.3 Products/ Services Offered
10.8.4 SWOT Analysis
10.9 Cellebrite
10.9.1 Company Overview
10.9.2 Financial
10.9.3 Products/ Services Offered
10.9.4 SWOT Analysis
10.10 Sama Audit Systems & Software Pvt Ltd.
10.9.1 Company Overview
10.9.2 Financial
10.9.3 Products/ Services Offered
10.9.4 SWOT Analysis
11. Use Cases and Best Practices
12. Conclusion
An accurate research report requires proper strategizing as well as implementation. There are multiple factors involved in the completion of good and accurate research report and selecting the best methodology to compete the research is the toughest part. Since the research reports we provide play a crucial role in any company’s decision-making process, therefore we at SNS Insider always believe that we should choose the best method which gives us results closer to reality. This allows us to reach at a stage wherein we can provide our clients best and accurate investment to output ratio.
Each report that we prepare takes a timeframe of 350-400 business hours for production. Starting from the selection of titles through a couple of in-depth brain storming session to the final QC process before uploading our titles on our website we dedicate around 350 working hours. The titles are selected based on their current market cap and the foreseen CAGR and growth.
The 5 steps process:
Step 1: Secondary Research:
Secondary Research or Desk Research is as the name suggests is a research process wherein, we collect data through the readily available information. In this process we use various paid and unpaid databases which our team has access to and gather data through the same. This includes examining of listed companies’ annual reports, Journals, SEC filling etc. Apart from this our team has access to various associations across the globe across different industries. Lastly, we have exchange relationships with various university as well as individual libraries.
Step 2: Primary Research
When we talk about primary research, it is a type of study in which the researchers collect relevant data samples directly, rather than relying on previously collected data. This type of research is focused on gaining content specific facts that can be sued to solve specific problems. Since the collected data is fresh and first hand therefore it makes the study more accurate and genuine.
We at SNS Insider have divided Primary Research into 2 parts.
Part 1 wherein we interview the KOLs of major players as well as the upcoming ones across various geographic regions. This allows us to have their view over the market scenario and acts as an important tool to come closer to the accurate market numbers. As many as 45 paid and unpaid primary interviews are taken from both the demand and supply side of the industry to make sure we land at an accurate judgement and analysis of the market.
This step involves the triangulation of data wherein our team analyses the interview transcripts, online survey responses and observation of on filed participants. The below mentioned chart should give a better understanding of the part 1 of the primary interview.
Part 2: In this part of primary research the data collected via secondary research and the part 1 of the primary research is validated with the interviews from individual consultants and subject matter experts.
Consultants are those set of people who have at least 12 years of experience and expertise within the industry whereas Subject Matter Experts are those with at least 15 years of experience behind their back within the same space. The data with the help of two main processes i.e., FGDs (Focused Group Discussions) and IDs (Individual Discussions). This gives us a 3rd party nonbiased primary view of the market scenario making it a more dependable one while collation of the data pointers.
Step 3: Data Bank Validation
Once all the information is collected via primary and secondary sources, we run that information for data validation. At our intelligence centre our research heads track a lot of information related to the market which includes the quarterly reports, the daily stock prices, and other relevant information. Our data bank server gets updated every fortnight and that is how the information which we collected using our primary and secondary information is revalidated in real time.
Step 4: QA/QC Process
After all the data collection and validation our team does a final level of quality check and quality assurance to get rid of any unwanted or undesired mistakes. This might include but not limited to getting rid of the any typos, duplication of numbers or missing of any important information. The people involved in this process include technical content writers, research heads and graphics people. Once this process is completed the title gets uploader on our platform for our clients to read it.
Step 5: Final QC/QA Process:
This is the last process and comes when the client has ordered the study. In this process a final QA/QC is done before the study is emailed to the client. Since we believe in giving our clients a good experience of our research studies, therefore, to make sure that we do not lack at our end in any way humanly possible we do a final round of quality check and then dispatch the study to the client.
Key Segments:
By Component
Solution- Forensic Tools/Software
Audit/Accounting software
Services
By End-user
Banking and Insurance
Law Enforcement Agencies
Government
Accounting Firm
Request for Segment Customization as per your Business Requirement: Segment Customization Request
Regional Coverage:
North America
US
Canada
Mexico
Europe
Eastern Europe
Poland
Romania
Hungary
Turkey
Rest of Eastern Europe
Western Europe
Germany
France
UK
Italy
Spain
Netherlands
Switzerland
Austria
Rest of Western Europe
Asia Pacific
China
India
Japan
South Korea
Vietnam
Singapore
Australia
Rest of Asia Pacific
Middle East & Africa
Middle East
UAE
Egypt
Saudi Arabia
Qatar
Rest of Middle East
Africa
Nigeria
South Africa
Rest of Africa
Latin America
Brazil
Argentina
Colombia
Rest of Latin America
Request for Country Level Research Report: Country Level Customization Request
Available Customization
With the given market data, SNS Insider offers customization as per the company’s specific needs. The following customization options are available for the report:
Detailed Volume Analysis
Criss-Cross segment analysis (e.g. Product X Application)
Competitive Product Benchmarking
Geographic Analysis
Additional countries in any of the regions
Customized Data Representation
Detailed analysis and profiling of additional market players
IoT Energy Management Market was valued at USD 71.23 billion in 2023 and is expected to reach USD 311.86 billion by 2032, growing at a CAGR of 17.89% by 2032.
Hyperscale Computing Market was valued at USD 55.60 billion in 2023 and will reach USD 362.54 billion by 2032, growing at a CAGR of 23.22% by 2032.
Telecom Service Assurance Market was valued at USD 9.8 billion in 2023, is expected to grow at a CAGR of 9.8% over 2024-2032 to reach USD 22.6 billion by 2032.
The Microserver Market size was valued at USD 30.04 billion in 2023 and is expected to grow to USD 108.94 billion by 2031 and grow at a CAGR of 15.39% over the forecast period of 2024-2031.
The Carbon Accounting Software Market was valued at USD 16.1 billion in 2023 and will reach USD 102.9 billion by 2032, growing at a CAGR of 22.9% by 2032.
The Pharmaceutical and Life Sciences in Global Capability Centers Market is expected to reach USD 92.38 Bn by 2032 & grow at a CAGR of 14.88% by 2024-2032.
Hi! Click one of our member below to chat on Phone