Force Sensor Market Key Insights:
Get more information on Force Sensor Market - Request Sample Report
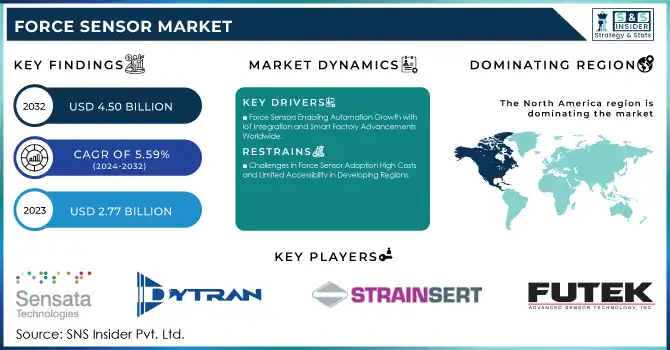
The Force Sensor Market Size was valued at USD 2.77 Billion in 2023 and is expected to reach USD 4.50 Billion by 2032 and grow at a CAGR of 5.59% over the forecast period 2024-2032.
The Force Sensor Market is experiencing robust growth with technological innovations, government policies, and the rising industrial automation in the countries of Japan, China, the USA, France, Germany, and India. The adoption of force sensors in robotics, medical devices, and automotive applications has witnessed significant growth in 2023 and 2024. The increasing focus on precision manufacturing and the adoption of high safety standards in industries have further increased the demand for these sensors. Government policies, such as Germany's Industry 4.0 and China's Made in China 2025, are actively promoting the use of smart sensors to enhance operational efficiency. Similarly, India's Make in India campaign has given a much-needed boost to the development of indigenous sensor technologies.
Technological advancements, such as miniaturization and the development of wireless and IoT-enabled force sensors, have been crucial in reshaping the market dynamics. For example, the advanced piezoelectric and capacitive force sensors introduced in 2023 have enhanced accuracy and durability. The global push towards sustainability has also influenced the market, with more than 30% of manufacturers focusing on the development of eco-friendly sensors in 2024.
In addition to that, government researches and collaborations with industry will push further innovation. Japan's National Institute of Advanced Industrial Science and Technology or AIST has already gained rise in funding for R&D sensor technology in 2024. The USA National Science Foundation also has launched new grants for supporting innovation of sensor in advanced manufacturing. As industries continue on their automation and AI trail, the force sensor market is set to grow uninterruptedly, with possible future growth areas including but not limited to autonomous cars and wearable technology.
Force Sensor Market Dynamics
KEY DRIVERS:
-
Force Sensors Enabling Automation Growth with IoT Integration and Smart Factory Advancements Worldwide
Countries like the USA, China, and Germany are leading the way in automation, with governments pushing for smart factories and Industry 4.0. In 2024, the International Federation of Robotics reported that industrial robot installations were 4,281,585 units worldwide, marking 10% increase from 2023. Force sensors are a vital component in robotics for tasks like material handling and assembly, which increases their demand. The use of IoT-enabling force sensors in automation not only facilitates better process efficiency but also better safety, further increasing business opportunities for such growth.
-
Force Sensors Revolutionizing Healthcare with Advancements in Prosthetics, Robotics, and Wearable Devices
In 2023, according to the WHO, a 15% rise was recorded in demand for prosthetics, led by a boom in the use of sensor technologies. In surgical robotics, force sensors offer real-time feedback, ensuring accuracy and reducing errors during surgery. Furthermore, wearable devices equipped with force sensors for health monitoring have become popular, thereby increasing the demand in the market. Governments and healthcare organizations in countries like Japan and France are heavily investing in sensor-based technologies to improve patient care and medical research.
RESTRAIN:
-
Challenges in Force Sensor Adoption High Costs and Limited Accessibility in Developing Regions
Piezoelectric and capacitive sensors are usually manufactured through complex processes and require special materials, making them expensive. In 2023, research showed that the average cost of high-precision force sensors increased by 10%, which raises the price for SMEs. The lack of proper technical support and high expense is other reasons that restrict their implementation in developing regions. Collaborative strategies for cost-reduction programs and incentives can be suggested by the governments and other industry stakeholders so that greater implementation is developed.
Force Sensor Market Segmentation Analysis
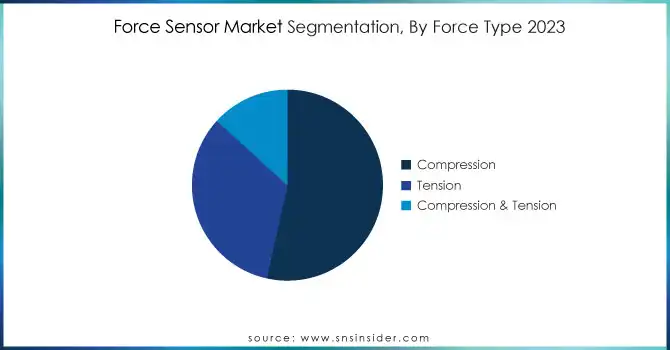
BY FORCE TYPE
The Compression segment had dominated Force Sensor Market with 53% market shares in 2023, where compression force sensors mainly utilized in the automobile & manufacturing industries for applications concerning load testing & quality validation due to their precision with high reliability.
The Compression & Tension segment is anticipated to grow with the fastest CAGR of 7% in the forecast period 2024-2032. It is due to their flexibility, as they can measure compressive and tensile forces simultaneously. These sensors are increasingly being used in the aerospace and construction sectors where dual-force measurement is important. The rising demand for multifunctional and cost-effective solutions is expected to further drive the growth of the compression & tension segment.
BY OPERATION
Analog sensors dominated in 2023, capturing a substantial 74% of the market. This type of sensor is considered superior due to its ease of use, lower costs, and compatibility with other legacy systems. For certain manufacturing and automotive applications requiring precision at a relatively affordable price, analog force sensors continue to be widely utilized.
Digital sensors are expected to have the highest growth rate of 7.14% during the forecast period of 2024-2032. The shift toward smart systems and IoT-enabled applications is a major reason for this segment. Digital force sensors have advantages like increased accuracy, real-time data transmission, and integration with automation systems. The growing usage in advanced robotics, healthcare, and consumer electronics also points to the increasing importance of digital force sensors in the modern industrial landscape.
Force Sensor Market Regional Outlook
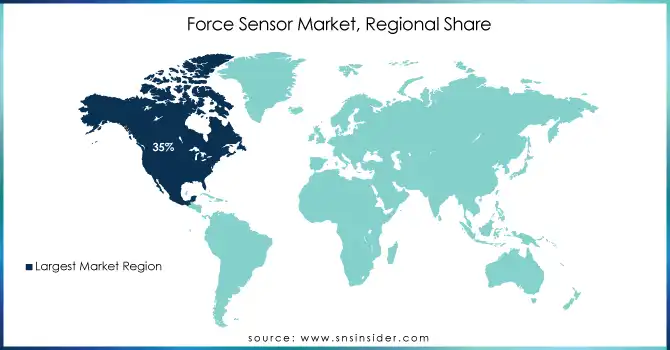
North America held the leadership position with 35% of the market share in 2023, owing to widespread adoption of advanced technologies, robust manufacturing sectors, and significant investment in research and development. Presence of key market players and favourable government policies further boost the market in this region.
Asia Pacific is expected to grow the fastest, with a CAGR of 6.15% during the forecast period 2024-2032. Growth in this region is mainly driven by countries such as China, Japan, and India, which are growing through increasing industrial automation, government initiatives, and growing demand for consumer electronics. The region's cost-effective manufacturing capabilities and expanding automotive and healthcare industries make it a hotspot for force sensor innovation and deployment.
Need any customization research on Force Sensor Market - Enquiry Now
KEY PLAYERS
Some of the major players in the Force Sensor Market are
-
Sensata Technologies (Force Sensors, Pressure Sensors)
-
Dytran Instruments, Inc. (IEPE Force Sensors, Accelerometers)
-
Strainsert Company (Load Cells, Force Sensors)
-
FUTEK Advanced Sensor Technology, Inc. (Load Cells, Torque Sensors)
-
Honeywell International Inc. (Force Sensors, Pressure Sensors)
-
Vishay Precision Group (Load Cells, Force Sensors)
-
Flintec (Load Cells, Force Sensors)
-
HBM (Load Cells, Force Sensors)
-
Omega Engineering (Load Cells, Force Sensors)
-
Kistler Group (Piezoelectric Force Sensors, Pressure Sensors)
-
TE Connectivity (Force Sensors, Pressure Sensors)
-
Baumer Group (Force Sensors, Pressure Sensors)
-
GE Measurement & Control Solutions (Force Sensors, Pressure Sensors)
-
HBM Test and Measurement (Load Cells, Force Sensors)
-
Mettler Toledo (Load Cells, Force Sensors)
-
Spectris plc (Force Sensors, Pressure Sensors)
-
Siemens AG (Force Sensors, Pressure Sensors)
-
Pepperl+Fuchs (Force Sensors, Pressure Sensors)
-
First Sensor AG (Force Sensors, Pressure Sensors)
-
SICK AG (Force Sensors, Pressure Sensors)
MAJOR SUPPLIERS (Components, Technologies)
-
Vishay Intertechnology
-
Honeywell International Inc.
-
3M Company
-
DuPont de Nemours, Inc.
-
Saint-Gobain
-
Schott AG
-
CeramTec GmbH
-
Kyocera Corporation
-
Murata Manufacturing Co., Ltd.
-
TDK Corporation
RECENT TRENDS
-
April 2024: Honeywell has designed sensors, called "resolvers," specifically for the needs of the Lilium Jet. The sensors will have a critical role in correctly sensing the position of the engine, so that the jet safely reaches the exact position required for a successful takeoff.
-
December 2024: Piezocryst Advanced Sensorics GmbH, Piezocryst announced that Spectris plc, SXS: LSE, has fully acquired through a comprehensive regulatory process in Austria, the acquisition is accomplished with an enterprise value of €133.5 million or £112.2 million.
| Report Attributes | Details |
|---|---|
| Market Size in 2023 | USD 2.77 Billion |
| Market Size by 2032 | USD 4.50 Billion |
| CAGR | CAGR of 5.59 % From 2024 to 2032 |
| Base Year | 2023 |
| Forecast Period | 2024-2032 |
| Historical Data | 2020-2022 |
| Report Scope & Coverage | Market Size, Segments Analysis, Competitive Landscape, Regional Analysis, DROC & SWOT Analysis, Forecast Outlook |
| Key Segments | • By Operation (Analog, Digital), • By Force Type (Compression, Tension, Compression & Tension), • By Technology (Piezoelectric Force Sensor, Capacitive Force Sensor, Magnetic Force Sensor, Load Cell, Strain Gauge, Others), • By End Use (Automotive, Locomotive, Manufacturing, Mining, Aerospace & Defence, Construction, Healthcare, Others) |
| Regional Analysis/Coverage | North America (US, Canada, Mexico), Europe (Eastern Europe [Poland, Romania, Hungary, Turkey, Rest of Eastern Europe] Western Europe] Germany, France, UK, Italy, Spain, Netherlands, Switzerland, Austria, Rest of Western Europe]), Asia Pacific (China, India, Japan, South Korea, Vietnam, Singapore, Australia, Rest of Asia Pacific), Middle East & Africa (Middle East [UAE, Egypt, Saudi Arabia, Qatar, Rest of Middle East], Africa [Nigeria, South Africa, Rest of Africa], Latin America (Brazil, Argentina, Colombia, Rest of Latin America) |
| Company Profiles | Sensata Technologies, Dytran Instruments, Inc., Strainsert Company, FUTEK Advanced Sensor Technology, Inc., Honeywell International Inc., Vishay Precision Group, Flintec, HBM, Omega Engineering, Kistler Group, TE Connectivity, Baumer Group, GE Measurement & Control Solutions, HBM Test and Measurement, Mettler Toledo, Spectris plc, Siemens AG, Pepperl+Fuchs, First Sensor AG, SICK AG. |
| Key Drivers | • Force Sensors Enabling Automation Growth with IoT Integration and Smart Factory Advancements Worldwide • Force Sensors Revolutionizing Healthcare with Advancements in Prosthetics, Robotics, and Wearable Devices |
| Restraints | • Challenges in Force Sensor Adoption High Costs and Limited Accessibility in Developing Regions |
