Get More Information on Food Grade Lubricants Market - Request Sample Report
The Food Grade Lubricants Market size was valued at USD 3.90 Billion in 2023 and is expected to reach USD 7.48 Billion by 2032 and grow at a CAGR of 7.67% over the forecast period of 2024-2032.
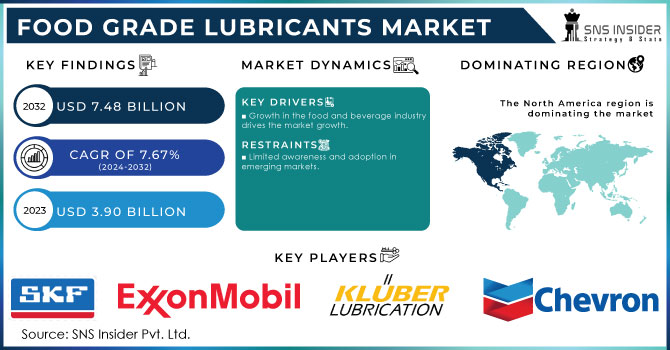
The defining factor driving the food-grade lubricants market is the escalating demand for processed and packaged food. As more customers become dependent on the ease and convenience of processed food, more and more facilities are emerging to meet these demands. According to the 2023 Food and Agriculture Organization report, global food production experienced a 1.3% increase due to rising popularity and demand for convenience foods. It entails that the need for food-safe lubricants that meet food safety standards is higher than ever because they are vital for minimizing any harmful contaminants into processed food. For example, the U.S. Food and Drug Administration strictly regulates the requirements for non-toxicity and food safety, meaning that all lubricants must comply with these requirements to be implemented into food-processing equipment.
In addition, the European Food Safety Authority reports that the number of regulations concerning machinery that comes into contact with food in one way or another has significantly increased to ensure that it does not come into contact with the product. Thus, it can be assumed that the use of food-grade lubricants increases as a direct consequence of the rising demand for processed food.
Some of the most recent trends indicate that companies attempt to innovate and cater to these needs. For example, the FUCHS Group has released its synthetic line of food-grade lubricants. The products are stated to be able to withstand harsh temperatures and extreme conditions to prolong the lifespan of machinery without risking processed food contamination.
In addition, the entire line of their products is optimized for maximum performance and food safety. On the other hand, in 2022, ExxonMobil has broadened its product range for food-grade lubricants, automation emphasizing environmentally friendly and biodegradable options. The latter can be especially important for businesses and countries as they strive to become greener as part of global sustainability efforts.
The trend having a substantial influence on the food-grade lubricants market is the shift to environmentally friendly and biodegradable lubricants. Such focus on sustainability can be explained by the impact that numerous lubricants cause, which encourages manufacturers to employ greener materials. The reductions in the environmental footprint do not imply that the lubricants have lower-desirable performance, as they are still designed to be effective components for the machinery used in the food and beverage sector. This trend is encouraged by the environmental initiatives of both consumers and the need for the industry to comply with the new standards developed in the regulatory field. For example, the European Green Deal or the initiatives of the U.S. EPA to promote greener lubricants have improved the adoption of biodegradable solutions.
Market Dynamics:
Drivers:
The food-grade lubricants growth is mainly driven by the expansion of the global food and beverage industry Developing production facilities and use of increasingly automated machinery and equipment in the food processing sector, require safe and high-performance products furnishing minimal contact with food. According to the Food and Agriculture Organization, increased by 2.1% in 2023, driven mostly by growing demand in the processed and packed food, especially on the markets of the Asia-Pacific and Latin America.
Governments are playing a crucial role in shaping the market. For instance, the European Union’s Farm to Fork strategy, introduced in 2020 as part of the European Green Deal, has emphasized the need for safe, sustainable food production, it has accelerated the adoption of food-grade lubricants across Europe. The U.S. Food and Drug Administration (FDA) and other regulatory bodies, such as the National Sanitation Foundation (NSF), continue to strengthen guidelines for lubricant use in food processing, ensuring that manufacturers utilize products that prevent contamination and meet hygiene standards.
This convergence of government regulations, industry innovation, and growing demand in the food and beverage sector is fostering the adoption of advanced food-grade lubricants that can operate efficiently while maintaining product safety and compliance.
Moreover, the overall growth of the food and beverage industry, coupled with government-imposed safety standards, continues to fuel the demand for food-grade lubricants in processing and packaging operations..
Restraints:
In many developing regions, the adoption of food-grade lubricants remains limited, largely due to less stringent regulatory frameworks and weak enforcement of safety standards. Unlike in developed markets, where strict guidelines from bodies like the FDA and EFSA mandate the use of non-toxic lubricants in food production, many emerging economies do not have the same level of oversight. As a result, manufacturers in these regions often opt for cheaper, non-food-grade lubricants to reduce costs, particularly in price-sensitive markets where profit margins are thin. These conventional lubricants, while cost-effective, pose potential risks of contamination and do not meet the high safety standards required to ensure consumer health.
The lower awareness of food safety regulations and the absence of stringent enforcement contribute to this trend, making it difficult for the food-grade lubricants market to gain traction in these regions. This reliance on non-compliant lubricants can compromise product safety and limit the global adoption of safer alternatives.
By Type
Synthetic oil-based lubricants held the largest market share around 37.95% in 2023. This dominance is driven by the superior performance characteristics of synthetic oils compared to mineral and bio-based alternatives. Therefore, a dominant position in this market is established through the quality of products, meaning that the industry continues to be dominated by synthetic products. The synthetic Dominance in the food processing/filling equipment market is highly justifiable as these products are superior in terms of performance, particularly compared to bio-based products. Overall, the combination of synthetic lubricants dominant position and their superior performance made this result highly predictable.
By Application
The food industry market share is around 58.23% in 2023. This dominance is due to the stringent safety and hygiene standards required in food processing, where even minimal contamination can have serious health consequences. Regulatory bodies such as the U.S. Food and Drug Administration (FDA) and the European Food Safety Authority (EFSA) impose strict guidelines for lubricants used in food production, ensuring they meet non-toxicity and food safety requirements. The growth of processed and packaged foods, especially with the rising demand for convenience foods globally, further boosts this segment. Manufacturers are increasingly prioritizing the use of high-performance, food-safe lubricants to comply with regulations and enhance equipment efficiency, making the food industry the largest application segment for food-grade lubricants.
By Form
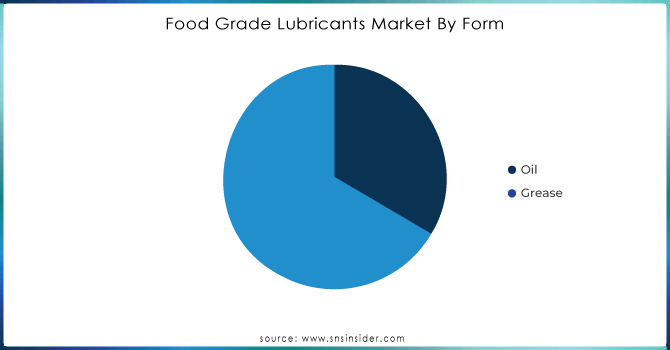
Grease held the largest market share around 66.54% in 2023. This dominance is largely due to the specific advantages that grease offers in food processing and manufacturing environments. Grease provides superior adhesion and lubrication for industrial lubricant such as, machinery components, reducing the frequency of re-lubrication and offering better protection against wear and corrosion. Its ability to stay in place and perform effectively under high pressure and varying temperatures makes it particularly suitable for equipment that operates in challenging conditions, such as in food processing lines and packaging machinery.
Get Customized Report as per Your Business Requirement - Request For Customized Report
Regional Analysis:
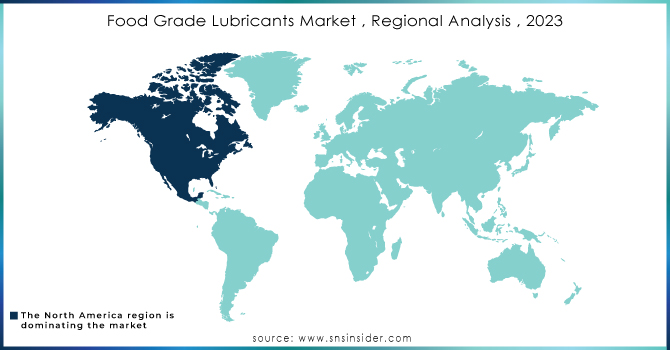
North America held the largest market share around 42.23% in 2023. The North America region is leading the food-grade lubricants market primarily due to advanced food-grade infrastructure, high awareness of product safety standards, and rigorous regulatory and safety guidelines. The regulations established by the U.S. Food and Drug Administration and associated regulatory bodies are contributing to the high demand for food-grade lubricants in the region. Recent developments in the North America region indicate the continuous growth of the industry. For example, in 2023, FUCHS Lubricants announced the introduction of its FoodGradePlus range for North America markets. These food-grade lubricants form have been specially designed to cater to the stringent North American food-processing requirements. In the previous year, the U.S. witnessed an unveiling by Kluger Lubrication, a part of Freudenberg Chemical Service that introduced innovative food-grade lubricants to North American markets to promote efficiency in machinery use and address evolving demands in the food and beverage sector.
Key Players:
Some of the Key Players are Chevron Corporation, Kluber SKF, Exxonmobil Corporation, Total Energies SE, BP plc., Lubrication Munchen SE & Co. KG, Petro-Canada Lubricants Inc., FUCHS Petrolub AG, The DOW Chemical Company And Illinois Tools Works Inc., other players.
Report Attributes | Details |
---|---|
Market Size in 2023 | US$ 3.90 Billion |
Market Size by 2032 | US$ 7.48 Billion |
CAGR | CAGR of 7.67% From 2024 to 2032 |
Base Year | 2023 |
Forecast Period | 2024-2032 |
Historical Data | 2020-2022 |
Report Scope & Coverage | Market Size, Segments Analysis, Competitive Landscape, Regional Analysis, DROC & SWOT Analysis, Forecast Outlook |
Key Segments | • By Type (Synthetic Oil, Mineral Oil, Bio-based) • By Application (Food, Beverages, Pharmaceuticals & Cosmetics, Others) • By Form (Oil, Grease) • By Grade (H1, H2, H3) |
Regional Analysis/Coverage | North America (US, Canada, Mexico), Europe (Eastern Europe [Poland, Romania, Hungary, Turkey, Rest of Eastern Europe] Western Europe] Germany, France, UK, Italy, Spain, Netherlands, Switzerland, Austria, Rest of Western Europe]), Asia Pacific (China, India, Japan, South Korea, Vietnam, Singapore, Australia, Rest of Asia Pacific), Middle East & Africa (Middle East [UAE, Egypt, Saudi Arabia, Qatar, Rest of Middle East], Africa [Nigeria, South Africa, Rest of Africa], Latin America (Brazil, Argentina, Colombia, Rest of Latin America) |
Company Profiles | Some of the key players are Chevron Corporation, Kluber SKF, exxonmobil Corporation, Total Energies SE, BP plc., Lubrication Munchen SE & Co. KG, total energies SE, Petro-Canada Lubricants Inc., FUCHS Petrolub AG, The DOW Chemical Company And Illinois Tools Works Inc., other players. |
DRIVERS | • Growth in the food and beverage industry's drives the market growth. • Food safety regulations are very strict. |
Restraints | • Limited awareness and adoption in emerging markets. |
Ans: Manufacturers, Consultant, aftermarket players, association, Research institute, private and universities libraries, suppliers and distributors of the product.
Ans: Chevron Corporation (US), Kluber SKF (Sweden) exxonmobil Corporation (US), Total Energies SE (France), BP plc. (UK), Lubrication Munchen SE & Co. KG (Germany), total energies SE (France), Petro-Canada Lubricants Inc. (Canada), FUCHS Petrolub AG (Germany), The DOW Chemical Company (US) And Illinois Tools Works Inc. (US) are the major key players of Food Grade Lubricants Market.
Ans: COVID-19 prompted lockdowns and other restrictions in a number of nations throughout the world in order to halt the virus's spread. As a result, supply chain activities such as production, logistics, and trade were disrupted. As a result, in 2020, the market for food-grade lubricants is predicted to fall. The COVID-19 epidemic and the variable price of raw materials needed to create food grade lubricants have hampered the expansion of the food grade lubricants market. Countries such as China and the United States, among others, are resuming normal operations.
Ans: The food and beverage industry's expansion and Food safety regulations are very strict are the drivers for Food Grade Lubricants Market.
Ans: Food Grade Lubricants Market Size was valued at USD 3.90 billion in 2023, and expected to reach USD 7.48 billion by 2032, and grow at a CAGR of 7.67 % over the forecast period 2024-2032.
1. Introduction
1.1 Market Definition
1.2 Scope (Inclusion and Exclusions)
1.3 Research Assumptions
2. Executive Summary
2.1 Market Overview
2.2 Regional Synopsis
2.3 Competitive Summary
3. Research Methodology
3.1 Top-Down Approach
3.2 Bottom-up Approach
3.3. Data Validation
3.4 Primary Interviews
4. Market Dynamics Impact Analysis
4.1 Market Driving Factors Analysis
4.1.1 Drivers
4.1.2 Restraints
4.1.3 Opportunities
4.1.4 Challenges
4.2 PESTLE Analysis
4.3 Porter’s Five Forces Model
5. Statistical Insights and Trends Reporting
5.1 Production Capacity and Utilization, by Country, by Type, 2023
5.2 Feedstock Prices, by Country, by Type, 2023
5.3 Regulatory Impact, by Country, by Type, 2023.
5.4 Environmental Metrics: Emissions Data, Waste Management Practices, and Sustainability Initiatives, by region
5.5 Innovation and R&D, by Type, 2023
6. Competitive Landscape
6.1 List of Major Companies, By Region
6.2 Market Share Analysis, By Region
6.3 Product Benchmarking
6.3.1 Product specifications and features
6.3.2 Pricing
6.4 Strategic Initiatives
6.4.1 Marketing and promotional activities
6.4.2 Distribution and supply chain strategies
6.4.3 Expansion plans and new product launches
6.4.4 Strategic partnerships and collaborations
6.5 Technological Advancements
6.6 Market Positioning and Branding
7. Food Grade Lubricants Market Segmentation, by Type
7.1 Chapter Overview
7.2 Synthetic Oil
7.2.1 Synthetic Oil Market Trends Analysis (2020-2032)
7.2.2 Synthetic Oil Market Size Estimates and Forecasts to 2032 (USD Billion)
7.2.3 PAO
7.2.3.1 PAO Market Trends Analysis (2020-2032)
7.2.3.2 PAO Market Size Estimates and Forecasts to 2032 (USD Billion)
7.2.4 PAG
7.2.4.1 PAG Market Trends Analysis (2020-2032)
7.2.4.2 PAG Market Size Estimates and Forecasts to 2032 (USD Billion)
7.2.5 Others
7.2.5.1 Others Market Trends Analysis (2020-2032)
7.2.5.2 Others Market Size Estimates and Forecasts to 2032 (USD Billion)
7.3 Mineral Oil
7.3.1 Mineral Oil Market Trends Analysis (2020-2032)
7.3.2 Mineral Oil Market Size Estimates and Forecasts to 2032 (USD Billion)
7.4 Bio-based
7.4.1 Bio-based Market Trends Analysis (2020-2032)
7.4.2 Bio-based Market Size Estimates and Forecasts to 2032 (USD Billion)
8. Food Grade Lubricants Market Segmentation, by Application
8.1 Chapter Overview
8.2 Food
8.2.1 Food Market Trends Analysis (2020-2032)
8.2.2 Food Market Size Estimates and Forecasts to 2032 (USD Billion)
8.2.3 Bakery
8.2.3.1 Bakery Market Trends Analysis (2020-2032)
8.2.3.2 Bakery Market Size Estimates and Forecasts to 2032 (USD Billion)
8.2.4 Dairy
8.2.4.1 Dairy Market Trends Analysis (2020-2032)
8.2.4.2 Dairy Market Size Estimates and Forecasts to 2032 (USD Billion)
8.2.5 Sugar
8.2.5.1 Sugar Market Trends Analysis (2020-2032)
8.2.5.2 Sugar Market Size Estimates and Forecasts to 2032 (USD Billion)
8.2.6 Meat, poultry & seafood
8.2.6.1 Meat, poultry & seafood Market Trends Analysis (2020-2032)
8.2.6.2 Meat, poultry & seafood Market Size Estimates and Forecasts to 2032 (USD Billion)
8.2.7 Animal feed
8.2.7.1 Animal Feed Market Trends Analysis (2020-2032)
8.2.7.2 Animal Feed Market Size Estimates and Forecasts to 2032 (USD Billion)
8.2.8 Others
8.2.8.1 Others Market Trends Analysis (2020-2032)
8.2.8.2 Others Market Size Estimates and Forecasts to 2032 (USD Billion)
8.3 Beverages
8.3.1 Beverages Market Trends Analysis (2020-2032)
8.3.2 Beverages Market Size Estimates and Forecasts to 2032 (USD Billion)
8.4 Pharmaceuticals & Cosmetics
8.4.1 Pharmaceuticals & Cosmetics Market Trends Analysis (2020-2032)
8.4.2 Pharmaceuticals & Cosmetics Market Size Estimates and Forecasts to 2032 (USD Billion)
8.5 Others
8.5.1 Others Market Trends Analysis (2020-2032)
8.5.2 Others Market Size Estimates and Forecasts to 2032 (USD Billion)
9. Food Grade Lubricants Market Segmentation, by Form
9.1 Chapter Overview
9.2 Oil
9.2.1 Oil Market Trends Analysis (2020-2032)
9.2.2 Oil Market Size Estimates and Forecasts to 2032 (USD Billion)
9.3 Grease
9.3.1 Grease Market Trends Analysis (2020-2032)
9.3.2 Grease Market Size Estimates and Forecasts to 2032 (USD Billion)
10. Food Grade Lubricants Market Segmentation, by Grade
10.1 Chapter Overview
10.2 H1
10.2.1 H1 Market Trends Analysis (2020-2032)
10.2.2 H1 Market Size Estimates and Forecasts to 2032 (USD Billion)
10.3 H2
10.3.1 H2 Market Trends Analysis (2020-2032)
10.3.2 H2 Market Size Estimates and Forecasts to 2032 (USD Billion)
10.4 H3
10.4.1 H3 Market Trends Analysis (2020-2032)
10.4.2 H3 Market Size Estimates and Forecasts to 2032 (USD Billion)
11. Regional Analysis
11.1 Chapter Overview
11.2 North America
11.2.1 Trends Analysis
11.2.2 North America Food Grade Lubricants Market Estimates and Forecasts, by Country (2020-2032) (USD Billion)
11.2.3 North America Food Grade Lubricants Market Estimates and Forecasts, by Type (2020-2032) (USD Billion)
11.2.4 North America Food Grade Lubricants Market Estimates and Forecasts, by Application (2020-2032) (USD Billion)
11.2.5 North America Food Grade Lubricants Market Estimates and Forecasts, by Form (2020-2032) (USD Billion)
11.2.6 North America Food Grade Lubricants Market Estimates and Forecasts, by Grade (2020-2032) (USD Billion)
11.2.7 USA
11.2.7.1 USA Food Grade Lubricants Market Estimates and Forecasts, by Type (2020-2032) (USD Billion)
11.2.7.2 USA Food Grade Lubricants Market Estimates and Forecasts, by Application (2020-2032) (USD Billion)
11.2.7.3 USA Food Grade Lubricants Market Estimates and Forecasts, by Form (2020-2032) (USD Billion)
11.2.7.4 USA Food Grade Lubricants Market Estimates and Forecasts, by Grade (2020-2032) (USD Billion)
11.2.8 Canada
11.2.8.1 Canada Food Grade Lubricants Market Estimates and Forecasts, by Type (2020-2032) (USD Billion)
11.2.8.2 Canada Food Grade Lubricants Market Estimates and Forecasts, by Application (2020-2032) (USD Billion)
11.2.8.3 Canada Food Grade Lubricants Market Estimates and Forecasts, by Form (2020-2032) (USD Billion)
11.2.8.4 Canada Food Grade Lubricants Market Estimates and Forecasts, by Grade (2020-2032) (USD Billion)
11.2.9 Mexico
11.2.9.1 Mexico Food Grade Lubricants Market Estimates and Forecasts, by Type (2020-2032) (USD Billion)
11.2.9.2 Mexico Food Grade Lubricants Market Estimates and Forecasts, by Application (2020-2032) (USD Billion)
11.2.9.3 Mexico Food Grade Lubricants Market Estimates and Forecasts, by Form (2020-2032) (USD Billion)
11.2.9.4 Mexico Food Grade Lubricants Market Estimates and Forecasts, by Grade (2020-2032) (USD Billion)
11.3 Europe
11.3.1 Eastern Europe
11.3.1.1 Trends Analysis
11.3.1.2 Eastern Europe Food Grade Lubricants Market Estimates and Forecasts, by Country (2020-2032) (USD Billion)
11.3.1.3 Eastern Europe Food Grade Lubricants Market Estimates and Forecasts, by Type (2020-2032) (USD Billion)
11.3.1.4 Eastern Europe Food Grade Lubricants Market Estimates and Forecasts, by Application (2020-2032) (USD Billion)
11.3.1.5 Eastern Europe Food Grade Lubricants Market Estimates and Forecasts, by Form (2020-2032) (USD Billion)
11.3.1.6 Eastern Europe Food Grade Lubricants Market Estimates and Forecasts, by Grade (2020-2032) (USD Billion)
11.3.1.7 Poland
11.3.1.7.1 Poland Food Grade Lubricants Market Estimates and Forecasts, by Type (2020-2032) (USD Billion)
11.3.1.7.2 Poland Food Grade Lubricants Market Estimates and Forecasts, by Application (2020-2032) (USD Billion)
11.3.1.7.3 Poland Food Grade Lubricants Market Estimates and Forecasts, by Form (2020-2032) (USD Billion)
11.3.1.7.4 Poland Food Grade Lubricants Market Estimates and Forecasts, by Grade (2020-2032) (USD Billion)
11.3.1.8 Romania
11.3.1.8.1 Romania Food Grade Lubricants Market Estimates and Forecasts, by Type (2020-2032) (USD Billion)
11.3.1.8.2 Romania Food Grade Lubricants Market Estimates and Forecasts, by Application (2020-2032) (USD Billion)
11.3.1.8.3 Romania Food Grade Lubricants Market Estimates and Forecasts, by Form (2020-2032) (USD Billion)
11.3.1.8.4 Romania Food Grade Lubricants Market Estimates and Forecasts, by Grade (2020-2032) (USD Billion)
11.3.1.9 Hungary
11.3.1.9.1 Hungary Food Grade Lubricants Market Estimates and Forecasts, by Type (2020-2032) (USD Billion)
11.3.1.9.2 Hungary Food Grade Lubricants Market Estimates and Forecasts, by Application (2020-2032) (USD Billion)
11.3.1.9.3 Hungary Food Grade Lubricants Market Estimates and Forecasts, by Form (2020-2032) (USD Billion)
11.3.1.9.4 Hungary Food Grade Lubricants Market Estimates and Forecasts, by Grade (2020-2032) (USD Billion)
11.3.1.10 Turkey
11.3.1.10.1 Turkey Food Grade Lubricants Market Estimates and Forecasts, by Type (2020-2032) (USD Billion)
11.3.1.10.2 Turkey Food Grade Lubricants Market Estimates and Forecasts, by Application (2020-2032) (USD Billion)
11.3.1.10.3 Turkey Food Grade Lubricants Market Estimates and Forecasts, by Form (2020-2032) (USD Billion)
11.3.1.10.4 Turkey Food Grade Lubricants Market Estimates and Forecasts, by Grade (2020-2032) (USD Billion)
11.3.1.11 Rest of Eastern Europe
11.3.1.11.1 Rest of Eastern Europe Food Grade Lubricants Market Estimates and Forecasts, by Type (2020-2032) (USD Billion)
11.3.1.11.2 Rest of Eastern Europe Food Grade Lubricants Market Estimates and Forecasts, by Application (2020-2032) (USD Billion)
11.3.1.11.3 Rest of Eastern Europe Food Grade Lubricants Market Estimates and Forecasts, by Form (2020-2032) (USD Billion)
11.3.1.11.4 Rest of Eastern Europe Food Grade Lubricants Market Estimates and Forecasts, by Grade (2020-2032) (USD Billion)
11.3.2 Western Europe
11.3.2.1 Trends Analysis
11.3.2.2 Western Europe Food Grade Lubricants Market Estimates and Forecasts, by Country (2020-2032) (USD Billion)
11.3.2.3 Western Europe Food Grade Lubricants Market Estimates and Forecasts, by Type (2020-2032) (USD Billion)
11.3.2.4 Western Europe Food Grade Lubricants Market Estimates and Forecasts, by Application (2020-2032) (USD Billion)
11.3.2.5 Western Europe Food Grade Lubricants Market Estimates and Forecasts, by Form (2020-2032) (USD Billion)
11.3.2.6 Western Europe Food Grade Lubricants Market Estimates and Forecasts, by Grade (2020-2032) (USD Billion)
11.3.2.7 Germany
11.3.2.7.1 Germany Food Grade Lubricants Market Estimates and Forecasts, by Type (2020-2032) (USD Billion)
11.3.2.7.2 Germany Food Grade Lubricants Market Estimates and Forecasts, by Application (2020-2032) (USD Billion)
11.3.2.7.3 Germany Food Grade Lubricants Market Estimates and Forecasts, by Form (2020-2032) (USD Billion)
11.3.2.7.4 Germany Food Grade Lubricants Market Estimates and Forecasts, by Grade (2020-2032) (USD Billion)
11.3.2.8 France
11.3.2.8.1 France Food Grade Lubricants Market Estimates and Forecasts, by Type (2020-2032) (USD Billion)
11.3.2.8.2 France Food Grade Lubricants Market Estimates and Forecasts, by Application (2020-2032) (USD Billion)
11.3.2.8.3 France Food Grade Lubricants Market Estimates and Forecasts, by Form (2020-2032) (USD Billion)
11.3.2.8.4 France Food Grade Lubricants Market Estimates and Forecasts, by Grade (2020-2032) (USD Billion)
11.3.2.9 UK
11.3.2.9.1 UK Food Grade Lubricants Market Estimates and Forecasts, by Type (2020-2032) (USD Billion)
11.3.2.9.2 UK Food Grade Lubricants Market Estimates and Forecasts, by Application (2020-2032) (USD Billion)
11.3.2.9.3 UK Food Grade Lubricants Market Estimates and Forecasts, by Form (2020-2032) (USD Billion)
11.3.2.9.4 UK Food Grade Lubricants Market Estimates and Forecasts, by Grade (2020-2032) (USD Billion)
11.3.2.10 Italy
11.3.2.10.1 Italy Food Grade Lubricants Market Estimates and Forecasts, by Type (2020-2032) (USD Billion)
11.3.2.10.2 Italy Food Grade Lubricants Market Estimates and Forecasts, by Application (2020-2032) (USD Billion)
11.3.2.10.3 Italy Food Grade Lubricants Market Estimates and Forecasts, by Form (2020-2032) (USD Billion)
11.3.2.10.4 Italy Food Grade Lubricants Market Estimates and Forecasts, by Grade (2020-2032) (USD Billion)
11.3.2.11 Spain
11.3.2.11.1 Spain Food Grade Lubricants Market Estimates and Forecasts, by Type (2020-2032) (USD Billion)
11.3.2.11.2 Spain Food Grade Lubricants Market Estimates and Forecasts, by Application (2020-2032) (USD Billion)
11.3.2.11.3 Spain Food Grade Lubricants Market Estimates and Forecasts, by Form (2020-2032) (USD Billion)
11.3.2.11.4 Spain Food Grade Lubricants Market Estimates and Forecasts, by Grade (2020-2032) (USD Billion)
11.3.2.12 Netherlands
11.3.2.12.1 Netherlands Food Grade Lubricants Market Estimates and Forecasts, by Type (2020-2032) (USD Billion)
11.3.2.12.2 Netherlands Food Grade Lubricants Market Estimates and Forecasts, by Application (2020-2032) (USD Billion)
11.3.2.12.3 Netherlands Food Grade Lubricants Market Estimates and Forecasts, by Form (2020-2032) (USD Billion)
11.3.2.12.4 Netherlands Food Grade Lubricants Market Estimates and Forecasts, by Grade (2020-2032) (USD Billion)
11.3.2.13 Switzerland
11.3.2.13.1 Switzerland Food Grade Lubricants Market Estimates and Forecasts, by Type (2020-2032) (USD Billion)
11.3.2.13.2 Switzerland Food Grade Lubricants Market Estimates and Forecasts, by Application (2020-2032) (USD Billion)
11.3.2.13.3 Switzerland Food Grade Lubricants Market Estimates and Forecasts, by Form (2020-2032) (USD Billion)
11.3.2.13.4 Switzerland Food Grade Lubricants Market Estimates and Forecasts, by Grade (2020-2032) (USD Billion)
11.3.2.14 Austria
11.3.2.14.1 Austria Food Grade Lubricants Market Estimates and Forecasts, by Type (2020-2032) (USD Billion)
11.3.2.14.2 Austria Food Grade Lubricants Market Estimates and Forecasts, by Application (2020-2032) (USD Billion)
11.3.2.14.3 Austria Food Grade Lubricants Market Estimates and Forecasts, by Form (2020-2032) (USD Billion)
11.3.2.14.4 Austria Food Grade Lubricants Market Estimates and Forecasts, by Grade (2020-2032) (USD Billion)
11.3.2.15 Rest of Western Europe
11.3.2.15.1 Rest of Western Europe Food Grade Lubricants Market Estimates and Forecasts, by Type (2020-2032) (USD Billion)
11.3.2.15.2 Rest of Western Europe Food Grade Lubricants Market Estimates and Forecasts, by Application (2020-2032) (USD Billion)
11.3.2.15.3 Rest of Western Europe Food Grade Lubricants Market Estimates and Forecasts, by Form (2020-2032) (USD Billion)
11.3.2.15.4 Rest of Western Europe Food Grade Lubricants Market Estimates and Forecasts, by Grade (2020-2032) (USD Billion)
11.4 Asia Pacific
11.4.1 Trends Analysis
11.4.2 Asia Pacific Food Grade Lubricants Market Estimates and Forecasts, by Country (2020-2032) (USD Billion)
11.4.3 Asia Pacific Food Grade Lubricants Market Estimates and Forecasts, by Type (2020-2032) (USD Billion)
11.4.4 Asia Pacific Food Grade Lubricants Market Estimates and Forecasts, by Application (2020-2032) (USD Billion)
11.4.5 Asia Pacific Food Grade Lubricants Market Estimates and Forecasts, by Form (2020-2032) (USD Billion)
11.4.6 Asia Pacific Food Grade Lubricants Market Estimates and Forecasts, by Grade (2020-2032) (USD Billion)
11.4.7 China
11.4.7.1 China Food Grade Lubricants Market Estimates and Forecasts, by Type (2020-2032) (USD Billion)
11.4.7.2 China Food Grade Lubricants Market Estimates and Forecasts, by Application (2020-2032) (USD Billion)
11.4.7.3 China Food Grade Lubricants Market Estimates and Forecasts, by Form (2020-2032) (USD Billion)
11.4.7.4 China Food Grade Lubricants Market Estimates and Forecasts, by Grade (2020-2032) (USD Billion)
11.4.8 India
11.4.8.1 India Food Grade Lubricants Market Estimates and Forecasts, by Type (2020-2032) (USD Billion)
11.4.8.2 India Food Grade Lubricants Market Estimates and Forecasts, by Application (2020-2032) (USD Billion)
11.4.8.3 India Food Grade Lubricants Market Estimates and Forecasts, by Form (2020-2032) (USD Billion)
11.4.8.4 India Food Grade Lubricants Market Estimates and Forecasts, by Grade (2020-2032) (USD Billion)
11.4.9 Japan
11.4.9.1 Japan Food Grade Lubricants Market Estimates and Forecasts, by Type (2020-2032) (USD Billion)
11.4.9.2 Japan Food Grade Lubricants Market Estimates and Forecasts, by Application (2020-2032) (USD Billion)
11.4.9.3 Japan Food Grade Lubricants Market Estimates and Forecasts, by Form (2020-2032) (USD Billion)
11.4.9.4 Japan Food Grade Lubricants Market Estimates and Forecasts, by Grade (2020-2032) (USD Billion)
11.4.10 South Korea
11.4.10.1 South Korea Food Grade Lubricants Market Estimates and Forecasts, by Type (2020-2032) (USD Billion)
11.4.10.2 South Korea Food Grade Lubricants Market Estimates and Forecasts, by Application (2020-2032) (USD Billion)
11.4.10.3 South Korea Food Grade Lubricants Market Estimates and Forecasts, by Form (2020-2032) (USD Billion)
11.4.10.4 South Korea Food Grade Lubricants Market Estimates and Forecasts, by Grade (2020-2032) (USD Billion)
11.4.11 Vietnam
11.4.11.1 Vietnam Food Grade Lubricants Market Estimates and Forecasts, by Type (2020-2032) (USD Billion)
11.4.11.2 Vietnam Food Grade Lubricants Market Estimates and Forecasts, by Application (2020-2032) (USD Billion)
11.4.11.3 Vietnam Food Grade Lubricants Market Estimates and Forecasts, by Form (2020-2032) (USD Billion)
11.4.11.4 Vietnam Food Grade Lubricants Market Estimates and Forecasts, by Grade (2020-2032) (USD Billion)
11.4.12 Singapore
11.4.12.1 Singapore Food Grade Lubricants Market Estimates and Forecasts, by Type (2020-2032) (USD Billion)
11.4.12.2 Singapore Food Grade Lubricants Market Estimates and Forecasts, by Application (2020-2032) (USD Billion)
11.4.12.3 Singapore Food Grade Lubricants Market Estimates and Forecasts, by Form (2020-2032) (USD Billion)
11.4.12.4 Singapore Food Grade Lubricants Market Estimates and Forecasts, by Grade (2020-2032) (USD Billion)
11.4.13 Australia
11.4.13.1 Australia Food Grade Lubricants Market Estimates and Forecasts, by Type (2020-2032) (USD Billion)
11.4.13.2 Australia Food Grade Lubricants Market Estimates and Forecasts, by Application (2020-2032) (USD Billion)
11.4.13.3 Australia Food Grade Lubricants Market Estimates and Forecasts, by Form (2020-2032) (USD Billion)
11.4.13.4 Australia Food Grade Lubricants Market Estimates and Forecasts, by Grade (2020-2032) (USD Billion)
11.4.14 Rest of Asia Pacific
11.4.14.1 Rest of Asia Pacific Food Grade Lubricants Market Estimates and Forecasts, by Type (2020-2032) (USD Billion)
11.4.14.2 Rest of Asia Pacific Food Grade Lubricants Market Estimates and Forecasts, by Application (2020-2032) (USD Billion)
11.4.14.3 Rest of Asia Pacific Food Grade Lubricants Market Estimates and Forecasts, by Form (2020-2032) (USD Billion)
11.4.14.4 Rest of Asia Pacific Food Grade Lubricants Market Estimates and Forecasts, by Grade (2020-2032) (USD Billion)
11.5 Middle East and Africa
11.5.1 Middle East
11.5.1.1 Trends Analysis
11.5.1.2 Middle East Food Grade Lubricants Market Estimates and Forecasts, by Country (2020-2032) (USD Billion)
11.5.1.3 Middle East Food Grade Lubricants Market Estimates and Forecasts, by Type (2020-2032) (USD Billion)
11.5.1.4 Middle East Food Grade Lubricants Market Estimates and Forecasts, by Application (2020-2032) (USD Billion)
11.5.1.5 Middle East Food Grade Lubricants Market Estimates and Forecasts, by Form (2020-2032) (USD Billion)
11.5.1.6 Middle East Food Grade Lubricants Market Estimates and Forecasts, by Grade (2020-2032) (USD Billion)
11.5.1.7 UAE
11.5.1.7.1 UAE Food Grade Lubricants Market Estimates and Forecasts, by Type (2020-2032) (USD Billion)
11.5.1.7.2 UAE Food Grade Lubricants Market Estimates and Forecasts, by Application (2020-2032) (USD Billion)
11.5.1.7.3 UAE Food Grade Lubricants Market Estimates and Forecasts, by Form (2020-2032) (USD Billion)
11.5.1.7.4 UAE Food Grade Lubricants Market Estimates and Forecasts, by Grade (2020-2032) (USD Billion)
11.5.1.8 Egypt
11.5.1.8.1 Egypt Food Grade Lubricants Market Estimates and Forecasts, by Type (2020-2032) (USD Billion)
11.5.1.8.2 Egypt Food Grade Lubricants Market Estimates and Forecasts, by Application (2020-2032) (USD Billion)
11.5.1.8.3 Egypt Food Grade Lubricants Market Estimates and Forecasts, by Form (2020-2032) (USD Billion)
11.5.1.8.4 Egypt Food Grade Lubricants Market Estimates and Forecasts, by Grade (2020-2032) (USD Billion)
11.5.1.9 Saudi Arabia
11.5.1.9.1 Saudi Arabia Food Grade Lubricants Market Estimates and Forecasts, by Type (2020-2032) (USD Billion)
11.5.1.9.2 Saudi Arabia Food Grade Lubricants Market Estimates and Forecasts, by Application (2020-2032) (USD Billion)
11.5.1.9.3 Saudi Arabia Food Grade Lubricants Market Estimates and Forecasts, by Form (2020-2032) (USD Billion)
11.5.1.9.4 Saudi Arabia Food Grade Lubricants Market Estimates and Forecasts, by Grade (2020-2032) (USD Billion)
11.5.1.10 Qatar
11.5.1.10.1 Qatar Food Grade Lubricants Market Estimates and Forecasts, by Type (2020-2032) (USD Billion)
11.5.1.10.2 Qatar Food Grade Lubricants Market Estimates and Forecasts, by Application (2020-2032) (USD Billion)
11.5.1.10.3 Qatar Food Grade Lubricants Market Estimates and Forecasts, by Form (2020-2032) (USD Billion)
11.5.1.10.4 Qatar Food Grade Lubricants Market Estimates and Forecasts, by Grade (2020-2032) (USD Billion)
11.5.1.11 Rest of Middle East
11.5.1.11.1 Rest of Middle East Food Grade Lubricants Market Estimates and Forecasts, by Type (2020-2032) (USD Billion)
11.5.1.11.2 Rest of Middle East Food Grade Lubricants Market Estimates and Forecasts, by Application (2020-2032) (USD Billion)
11.5.1.11.3 Rest of Middle East Food Grade Lubricants Market Estimates and Forecasts, by Form (2020-2032) (USD Billion)
11.5.1.11.4 Rest of Middle East Food Grade Lubricants Market Estimates and Forecasts, by Grade (2020-2032) (USD Billion)
11.5.2 Africa
11.5.2.1 Trends Analysis
11.5.2.2 Africa Food Grade Lubricants Market Estimates and Forecasts, by Country (2020-2032) (USD Billion)
11.5.2.3 Africa Food Grade Lubricants Market Estimates and Forecasts, by Type (2020-2032) (USD Billion)
11.5.2.4 Africa Food Grade Lubricants Market Estimates and Forecasts, by Application (2020-2032) (USD Billion)
11.5.2.5 Africa Food Grade Lubricants Market Estimates and Forecasts, by Form (2020-2032) (USD Billion)
11.5.2.6 Africa Food Grade Lubricants Market Estimates and Forecasts, by Grade (2020-2032) (USD Billion)
11.5.2.7 South Africa
11.5.2.7.1 South Africa Food Grade Lubricants Market Estimates and Forecasts, by Type (2020-2032) (USD Billion)
11.5.2.7.2 South Africa Food Grade Lubricants Market Estimates and Forecasts, by Application (2020-2032) (USD Billion)
11.5.2.7.3 South Africa Food Grade Lubricants Market Estimates and Forecasts, by Form (2020-2032) (USD Billion)
11.5.2.7.4 South Africa Food Grade Lubricants Market Estimates and Forecasts, by Grade (2020-2032) (USD Billion)
11.5.2.8 Nigeria
11.5.2.8.1 Nigeria Food Grade Lubricants Market Estimates and Forecasts, by Type (2020-2032) (USD Billion)
11.5.2.8.2 Nigeria Food Grade Lubricants Market Estimates and Forecasts, by Application (2020-2032) (USD Billion)
11.5.2.8.3 Nigeria Food Grade Lubricants Market Estimates and Forecasts, by Form (2020-2032) (USD Billion)
11.5.2.8.4 Nigeria Food Grade Lubricants Market Estimates and Forecasts, by Grade (2020-2032) (USD Billion)
11.5.2.9 Rest of Africa
11.5.2.9.1 Rest of Africa Food Grade Lubricants Market Estimates and Forecasts, by Type (2020-2032) (USD Billion)
11.5.2.9.2 Rest of Africa Food Grade Lubricants Market Estimates and Forecasts, by Application (2020-2032) (USD Billion)
11.5.2.9.3 Rest of Africa Food Grade Lubricants Market Estimates and Forecasts, by Form (2020-2032) (USD Billion)
11.5.2.9.4 Rest of Africa Food Grade Lubricants Market Estimates and Forecasts, by Grade (2020-2032) (USD Billion)
11.6 Latin America
11.6.1 Trends Analysis
11.6.2 Latin America Food Grade Lubricants Market Estimates and Forecasts, by Country (2020-2032) (USD Billion)
11.6.3 Latin America Food Grade Lubricants Market Estimates and Forecasts, by Type (2020-2032) (USD Billion)
11.6.4 Latin America Food Grade Lubricants Market Estimates and Forecasts, by Application (2020-2032) (USD Billion)
11.6.5 Latin America Food Grade Lubricants Market Estimates and Forecasts, by Form (2020-2032) (USD Billion)
11.6.6 Latin America Food Grade Lubricants Market Estimates and Forecasts, by Grade (2020-2032) (USD Billion)
11.6.7 Brazil
11.6.7.1 Brazil Food Grade Lubricants Market Estimates and Forecasts, by Type (2020-2032) (USD Billion)
11.6.7.2 Brazil Food Grade Lubricants Market Estimates and Forecasts, by Application (2020-2032) (USD Billion)
11.6.7.3 Brazil Food Grade Lubricants Market Estimates and Forecasts, by Form (2020-2032) (USD Billion)
11.6.7.4 Brazil Food Grade Lubricants Market Estimates and Forecasts, by Grade (2020-2032) (USD Billion)
11.6.8 Argentina
11.6.8.1 Argentina Food Grade Lubricants Market Estimates and Forecasts, by Type (2020-2032) (USD Billion)
11.6.8.2 Argentina Food Grade Lubricants Market Estimates and Forecasts, by Application (2020-2032) (USD Billion)
11.6.8.3 Argentina Food Grade Lubricants Market Estimates and Forecasts, by Form (2020-2032) (USD Billion)
11.6.8.4 Argentina Food Grade Lubricants Market Estimates and Forecasts, by Grade (2020-2032) (USD Billion)
11.6.9 Colombia
11.6.9.1 Colombia Food Grade Lubricants Market Estimates and Forecasts, by Type (2020-2032) (USD Billion)
11.6.9.2 Colombia Food Grade Lubricants Market Estimates and Forecasts, by Application (2020-2032) (USD Billion)
11.6.9.3 Colombia Food Grade Lubricants Market Estimates and Forecasts, by Form (2020-2032) (USD Billion)
11.6.9.4 Colombia Food Grade Lubricants Market Estimates and Forecasts, by Grade (2020-2032) (USD Billion)
11.6.10 Rest of Latin America
11.6.10.1 Rest of Latin America Food Grade Lubricants Market Estimates and Forecasts, by Type (2020-2032) (USD Billion)
11.6.10.2 Rest of Latin America Food Grade Lubricants Market Estimates and Forecasts, by Application (2020-2032) (USD Billion)
11.6.10.3 Rest of Latin America Food Grade Lubricants Market Estimates and Forecasts, by Form (2020-2032) (USD Billion)
11.6.10.4 Rest of Latin America Food Grade Lubricants Market Estimates and Forecasts, by Grade (2020-2032) (USD Billion)
12. Company Profiles
12.1 Chevron Corporation
12.1.1 Company Overview
12.1.2 Financial
12.1.3 Products/ Services Offered
12.1.4 SWOT Analysis
12.2 Kluber SKF
12.2.1 Company Overview
12.2.2 Financial
12.2.3 Products/ Services Offered
12.2.4 SWOT Analysis
12.3 Exxonmobil Corporation,
12.3.1 Company Overview
12.3.2 Financial
12.3.3 Products/ Services Offered
12.3.4 SWOT Analysis
12.4 Total Energies SE
12.4.1 Company Overview
12.4.2 Financial
12.4.3 Products/ Services Offered
12.4.4 SWOT Analysis
12.5 BP plc.
12.5.1 Company Overview
12.5.2 Financial
12.5.3 Products/ Services Offered
12.5.4 SWOT Analysis
12.6 Lubrication Munchen SE & Co. KG
12.6.1 Company Overview
12.6.2 Financial
12.6.3 Products/ Services Offered
12.6.4 SWOT Analysis
12.7 Petro-Canada Lubricants Inc.
12.7.1 Company Overview
12.7.2 Financial
12.7.3 Products/ Services Offered
12.7.4 SWOT Analysis
12.8 FUCHS Petrolub AG
12.8.1 Company Overview
12.8.2 Financial
12.8.3 Products/ Services Offered
12.8.4 SWOT Analysis
12.9 The DOW Chemical Company
12.9.1 Company Overview
12.9.2 Financial
12.9.3 Products/ Services Offered
12.9.4 SWOT Analysis
12.10 Illinois Tools Works Inc.,
12.10.1 Company Overview
12.10.2 Financial
12.10.3 Products/ Services Offered
12.10.4 SWOT Analysis
13. Use Cases and Best Practices
14. Conclusion
An accurate research report requires proper strategizing as well as implementation. There are multiple factors involved in the completion of good and accurate research report and selecting the best methodology to compete the research is the toughest part. Since the research reports we provide play a crucial role in any company’s decision-making process, therefore we at SNS Insider always believe that we should choose the best method which gives us results closer to reality. This allows us to reach at a stage wherein we can provide our clients best and accurate investment to output ratio.
Each report that we prepare takes a timeframe of 350-400 business hours for production. Starting from the selection of titles through a couple of in-depth brain storming session to the final QC process before uploading our titles on our website we dedicate around 350 working hours. The titles are selected based on their current market cap and the foreseen CAGR and growth.
The 5 steps process:
Step 1: Secondary Research:
Secondary Research or Desk Research is as the name suggests is a research process wherein, we collect data through the readily available information. In this process we use various paid and unpaid databases which our team has access to and gather data through the same. This includes examining of listed companies’ annual reports, Journals, SEC filling etc. Apart from this our team has access to various associations across the globe across different industries. Lastly, we have exchange relationships with various university as well as individual libraries.
Step 2: Primary Research
When we talk about primary research, it is a type of study in which the researchers collect relevant data samples directly, rather than relying on previously collected data. This type of research is focused on gaining content specific facts that can be sued to solve specific problems. Since the collected data is fresh and first hand therefore it makes the study more accurate and genuine.
We at SNS Insider have divided Primary Research into 2 parts.
Part 1 wherein we interview the KOLs of major players as well as the upcoming ones across various geographic regions. This allows us to have their view over the market scenario and acts as an important tool to come closer to the accurate market numbers. As many as 45 paid and unpaid primary interviews are taken from both the demand and supply side of the industry to make sure we land at an accurate judgement and analysis of the market.
This step involves the triangulation of data wherein our team analyses the interview transcripts, online survey responses and observation of on filed participants. The below mentioned chart should give a better understanding of the part 1 of the primary interview.
Part 2: In this part of primary research the data collected via secondary research and the part 1 of the primary research is validated with the interviews from individual consultants and subject matter experts.
Consultants are those set of people who have at least 12 years of experience and expertise within the industry whereas Subject Matter Experts are those with at least 15 years of experience behind their back within the same space. The data with the help of two main processes i.e., FGDs (Focused Group Discussions) and IDs (Individual Discussions). This gives us a 3rd party nonbiased primary view of the market scenario making it a more dependable one while collation of the data pointers.
Step 3: Data Bank Validation
Once all the information is collected via primary and secondary sources, we run that information for data validation. At our intelligence centre our research heads track a lot of information related to the market which includes the quarterly reports, the daily stock prices, and other relevant information. Our data bank server gets updated every fortnight and that is how the information which we collected using our primary and secondary information is revalidated in real time.
Step 4: QA/QC Process
After all the data collection and validation our team does a final level of quality check and quality assurance to get rid of any unwanted or undesired mistakes. This might include but not limited to getting rid of the any typos, duplication of numbers or missing of any important information. The people involved in this process include technical content writers, research heads and graphics people. Once this process is completed the title gets uploader on our platform for our clients to read it.
Step 5: Final QC/QA Process:
This is the last process and comes when the client has ordered the study. In this process a final QA/QC is done before the study is emailed to the client. Since we believe in giving our clients a good experience of our research studies, therefore, to make sure that we do not lack at our end in any way humanly possible we do a final round of quality check and then dispatch the study to the client.
Key Segments:
By Type
Synthetic Oil
PAO
PAG
Others
Mineral Oil
Bio-based
By Application
Food
Bakery
Dairy
Sugar
Meat, poultry & seafood
Animal feed
Others
Beverages
Pharmaceuticals & Cosmetics
Others
By Form
Oil
Grease
By Grade
H1
H2
H3
Request for Segment Customization as per your Business Requirement: Segment Customization Request
Regional Coverage:
North America
US
Canada
Mexico
Europe
Eastern Europe
Poland
Romania
Hungary
Turkey
Rest of Eastern Europe
Western Europe
Germany
France
UK
Italy
Spain
Netherlands
Switzerland
Austria
Rest of Western Europe
Asia Pacific
China
India
Japan
South Korea
Vietnam
Singapore
Australia
Rest of Asia Pacific
Middle East & Africa
Middle East
UAE
Egypt
Saudi Arabia
Qatar
Rest of Middle East
Africa
Nigeria
South Africa
Rest of Africa
Latin America
Brazil
Argentina
Colombia
Rest of Latin America
Request for Country Level Research Report: Country Level Customization Request
Available Customization
With the given market data, SNS Insider offers customization as per the company’s specific needs. The following customization options are available for the report:
Product Analysis
Criss-Cross segment analysis (e.g. Product X Application)
Product Matrix which gives a detailed comparison of the product portfolio of each company
Geographic Analysis
Additional countries in any of the regions
Company Information
Detailed analysis and profiling of additional market players (Up to five)
The Chemical as a Service Market Size was valued at USD 9.07 billion in 2023 and will reach $13.50 billion by 2032 and grow at a CAGR of 7.96% by 2024-2032
Laminating Adhesives Market Size was valued at USD 3.54 Billion in 2023 and is expected to reach USD 5.80 Billion by 2032 and grow at a CAGR of 5.64% over the forecast period 2024-2032.
The Silane and Silicone Market is expected to reach USD 30.69 billion by 2031 and it was valued at USD 19.92 billion in 2023, and it will grow at a CAGR of 5.5% over the forecast period 2024-2031.
The Medical Textile Industry Market Size was valued at USD 33.2 billion in 2023 and is expected to reach USD 48.49 billion by 2032 and grow at a CAGR of 4.30% over the forecast period 2024-2032.
The Fireproofing Materials Market Size was valued at USD 1.1 billion in 2023 and is expected to reach USD 2.5 billion by 2032 and grow at a CAGR of 9.9% over the forecast period 2024-2032.
The Palmitic Acid Market Size was valued at USD 301.7 million in 2023, and is expected to reach USD 384.6 million by 2032, and grow at a CAGR of 2.8% over the forecast period 2024-2032.
Hi! Click one of our member below to chat on Phone