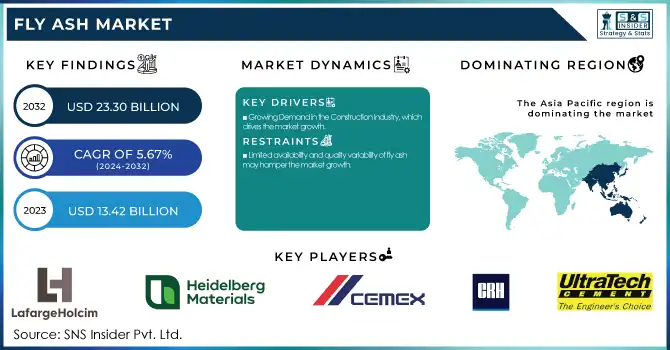
The Fly Ash Market size was USD 13.42 Billion in 2023 and is expected to reach USD 23.30 Billion by 2032 and grow at a CAGR of 5.67% over the forecast period of 2024-2032. The Fly Ash Market report provides comprehensive insights into production and utilization trends by country, highlighting key regional variations in supply and demand. It examines pricing trends and supply chain efficiency across major markets, along with regulatory impacts and environmental compliance measures influencing industry growth. The report also covers application trends in construction and infrastructure, detailing the rising adoption of fly ash in cement, concrete, and road development. Additionally, it explores advancements in processing technologies, including beneficiation and carbon reduction techniques, while analyzing global trade patterns, and export-import statistics.
To Get more information on Fly Ash Market - Request Free Sample Report
Drivers
Growing Demand in the Construction Industry, which drives the market growth.
Fly ash market is predominantly driven by the demand generated from the construction industry specifically by the beneficial properties of fly ash when used as a supplementary cementitious material in concrete, providing increased strength, durability, and workability. With the expansion of global infrastructure development projects such as highways, bridges, and airports, and residence buildings, the demand for economical and sustainable construction materials has increased. It reduces the consumption of cement, lowering GHGs and improving the sustainability of the construction practice. Further, further regulations, and also government business motivation for the use of industrial sector by-products in the structure phase have additionally boosted usage of SBI. It is used in the manufacture of blended cement, bricks, blocks, and numerous road stabilization usages. In addition, growing urbanization and smart city developments will increase the demand for fly ash-based materials in the forecast period.
Restraint
Limited availability and quality variability of fly ash may hamper the market growth.
The limited availability and heterogeneous quality of fly ash is one of the market restraints that restrict its large-scale utilization in various construction and industrial applications. Fly ash is mainly a by-product from coal-based thermal power plants and with the world moving towards renewable energy, the number of coal plants is reducing, hence fly ash production is also on a decreasing trend. Furthermore, fly ash properties are highly dependent upon the coal burnt, combustion conditions as well as collection methods such that maintaining consistent standards for construction applications is very difficult. Additionally, stringent regulations governing emissions from coal plants have changed the properties of fly ash, complicating its use.
Opportunity
Rising Adoption of fly ash in sustainable construction and infrastructure development creates market opportunities.
The growing trend towards sustainable construction and infrastructure development is expected to create lucrative sales opportunities for the fly ash market. Across the globe, various governments and regulatory bodies are encouraging the use of sustainable materials as a way to cut down on carbon emissions and fly ash can be a good replacement for cement in concrete which ultimately reduces the carbon footprint. Moreover, the increasing demand for green building and infrastructure projects especially in emerging economies, can drive the demand for fly ash-based products, including geopolymer concrete and blended cement. Also, technological advancements in the processing and refining of fly ash to further enhance its quality and consistency make fly ash an even more viable option in high-performance applications.
Challenges
Recycling and waste management issues may create a challenge for the market.
The challenge is around the variable nature of the fly ash product as well as the availability of it since it is very much reliant on the coal-fired power station the fly ash comes from. Thus, strict quality control is necessary, which increases production costs and makes its use in construction applications difficult. Secondly, the expansion of the market is also challenged by logistical barriers that hinder transportation, storage, as well as appropriate disposal. This makes life difficult for meat manufacturers, facing additional complications from regulatory constraints and rising environmental worries, as well as competition from different alternative supplementary materials.
By Type
Class F held the largest market share around 68% in 2023. It is mainly sourced from the burning of bituminous or anthracite coal, containing lower calcium, therefore it can be used as an SCM for high-performance concrete. Due to its characteristics of improving concrete strength, durability, and chemical attack, followed by a reduction in cement content, it has been one of the most important materials in the construction industry. At the same time, strict environmental laws and the expanding focus on sustainability in construction have also contributed to higher demand. Even today, Class F fly ash still holds a major share of the market, owing to its cost-effectiveness and quality reproducibility.
By Application
Cement & Concretes held the largest market share around 32% in 2023. It is one of the biggest consumers of fly ash which is used as a supplementary cementitious material, thus contributing to the highest market share. The production of concrete sometimes employs fly ash as a cement replacement which enhances the workability, durability, and long-term strength of concrete and contributes to a substantial reduction of the carbon footprint and the production costs. Concrete is highly resistant to chemical attacks and environmental degradation, partly due to the pozzolanic properties of the material, which also generates a certain amount of heat and thus mixes well with concrete, ensuring that it is used in various construction applications, whether for infrastructure, residential, or commercial.
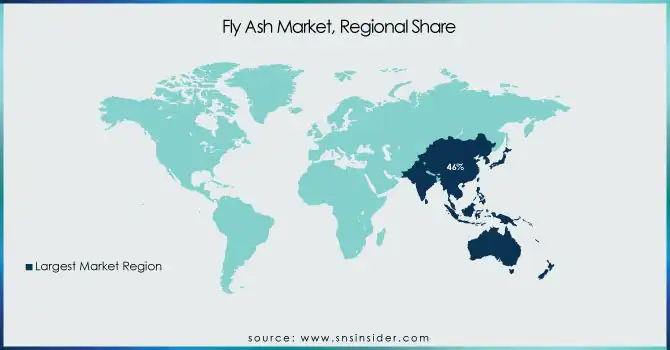
Asia Pacific held the largest market share around 46% in 2023. The high growth rate of this region is due to rapid industrialization, high infrastructure development, and massive urbanization of the region. Fly ash produced as a consequence of coal-fired power plants and its reuse in construction applications is enormous due to the presence of numerous coal-powered plants mostly in the continental areas such as China and India. From this surplus, fly ash has been widely utilized as an economical and efficient supplementary cementitious material in cement and concrete. In addition, government measures and sustainability policies encourage the recycling of industrial by-products, which has contributed to an increased demand for fly ash. This reinforces the region's clear market position from ongoing investments in modern power generation and construction technologies, low production costs, and developed supply chains. The increasing concerns about the environment and green building practices have facilitated the growing trend of carbon footprint reduction in construction projects through the incorporation of fly ash in Asia-Pacific.
North America held a significant market share in the market. The established construction industry in the region and stringent environmental regulations are responsible for the effective use of fly ash as an SCM for improving the durability and reducing carbon footprints of concrete. Furthermore, increased R&D efforts have enhanced fly ash processing methods, providing consistent quality and performance. The repurposing of industrial by-products is also bolstered by government incentives as well as regulatory frameworks, which further cements the position of fly ash as the go-to material in intensive construction activities. The combination of technological expertise, supportive regulations and a maturing construction industry make North America a key market for fly ash uses.
Get Customized Report as per Your Business Requirement - Enquiry Now
Key Players
LafargeHolcim (EcoBlend Fly Ash, GreenCement Ash)
HeidelbergCement (EcoAsh, High-Performance Fly Ash)
CEMEX (CEM-Fly Ash, EcoCEM Ash)
CRH plc (GreenRock Fly Ash, EcoConcrete Ash)
UltraTech Cement (UT Eco Ash, Fly Ash Advantage)
ACC Limited (ACC Green Ash, Fly Ash Pro)
Ambuja Cements (Ambuja Eco Ash, Fly Ash Supreme)
Dalmia Bharat (Dalmia Green Ash, Fly Ash Master)
Shree Cement (Shree Eco Ash, Fly Ash Plus)
JK Cement (JK Green Ash, Fly Ash X)
Star Cement (Star Eco Ash, Fly Ash Blend)
Buzzi Unicem (Buzzi Fly Ash, EcoCem Ash)
Titan Cement (Titan Eco Ash, Fly Ash Premium)
Cementos Argos (Argos Eco Ash, Fly Ash Extra)
Votorantim Cimentos (VotaGreen Ash, Fly Ash Select)
CNBM (CNBM Eco Ash, Fly Ash Grade A)
Anhui Conch Cement (Conch Eco Ash, Fly Ash Plus)
Siam Cement Group (SCG Eco Ash, Fly Ash Superior)
Italcementi (Ital Eco Ash, Fly Ash Advantage)
RMC Group (RMC Eco Ash, Fly Ash Elite)
Recent Development:
In 2023, CEMEX introduced a new fly ash product line designed to meet the rising demand for high-strength concrete while promoting sustainable construction practices. This innovative product enhances concrete durability and performance, making it ideal for modern, eco-friendly building solutions.
In 2023, HeidelbergCement rolled out advanced processing technology to enhance the quality and consistency of its fly ash products. This innovation aims to boost the performance and reliability of fly ash in construction applications.
| Report Attributes | Details |
|---|---|
| Market Size in 2023 | USD 13.42 Billion |
| Market Size by 2032 | USD 23.30 Billion |
| CAGR | CAGR of 5.67% From 2024 to 2032 |
| Base Year | 2023 |
| Forecast Period | 2024-2032 |
| Historical Data | 2020-2022 |
| Report Scope & Coverage | Market Size, Segments Analysis, Competitive Landscape, Regional Analysis, DROC & SWOT Analysis, Forecast Outlook |
| Key Segments | • By Type (Class F, Class C) • By End Use (Automotive, Building & Construction, Packaging, Medical, Electrical & Electronics, Others) |
| Regional Analysis/Coverage | North America (US, Canada, Mexico), Europe (Eastern Europe [Poland, Romania, Hungary, Turkey, Rest of Eastern Europe] Western Europe] Germany, France, UK, Italy, Spain, Netherlands, Switzerland, Austria, Rest of Western Europe]), Asia Pacific (China, India, Japan, South Korea, Vietnam, Singapore, Australia, Rest of Asia Pacific), Middle East & Africa (Middle East [UAE, Egypt, Saudi Arabia, Qatar, Rest of Middle East], Africa [Nigeria, South Africa, Rest of Africa], Latin America (Brazil, Argentina, Colombia, Rest of Latin America) |
| Company Profiles | LafargeHolcim, HeidelbergCement, CEMEX, CRH plc, UltraTech Cement, ACC Limited, Ambuja Cements, Dalmia Bharat, Shree Cement, JK Cement, Star Cement, Buzzi Unicem, Titan Cement, Cementos Argos, Votorantim Cimentos, CNBM, Anhui Conch Cement, Siam Cement Group, Italcementi, RMC Group Ensinger, Mitsubishi Chemical Corporation |
Ans: The Fly Ash Market was valued at USD 13.42 Billion in 2023.
Ans: The expected CAGR of the global Fly Ash Market during the forecast period is 5.67%.
Ans: Class F will grow rapidly in the Fly Ash Market from 2024-2032.
Ans: Growing Demand in the Construction Industry, which drives the market growth.
Ans: Asia Pacific led the Fly Ash Market in the region with the highest revenue share in 2023.
Table of Contents:
1. Introduction
1.1 Market Definition
1.2 Scope (Inclusion and Exclusions)
1.3 Research Assumptions
2. Executive Summary
2.1 Market Overview
2.2 Regional Synopsis
2.3 Competitive Summary
3. Research Methodology
3.1 Top-Down Approach
3.2 Bottom-up Approach
3.3. Data Validation
3.4 Primary Interviews
4. Market Dynamics Impact Analysis
3.1 Market Driving Factors Analysis
3.1.2 Drivers
3.1.2 Restraints
3.1.3 Opportunities
3.1.4 Challenges
3.2 PESTLE Analysis
3.3 Porter’s Five Forces Model
5. Statistical Insights and Trends Reporting
5.1 Production Capacity and Utilization, by Country, By Type, 2023
5.2 Feedstock Prices, by Country, By Type, 2023
5.3 Regulatory Impact, by Country, By Type 2023.
5.4 Environmental Metrics: Emissions Data, Waste Management Practices, and Sustainability Initiatives, by Region
5.5 Innovation and R&D, Type, 2023
6. Competitive Landscape
6.1 List of Major Companies, By Region
6.2 Market Share Analysis, By Region
6.3 Product Benchmarking
6.3.1 Product specifications and features
6.3.2 Pricing
6.4 Strategic Initiatives
6.4.1 Marketing and promotional activities
6.4.2 Distribution and Supply Chain Strategies
6.4.3 Expansion Plans and New Product Launches
6.4.4 Strategic partnerships and collaborations
6.5 Technological Advancements
6.6 Market Positioning and Branding
7. Fly Ash Market Segmentation, By Type
7.1 Chapter Overview
7.2 Class F
7.2.1 Class F Trends Analysis (2020-2032)
7.2.2 Class F Market Size Estimates and Forecasts to 2032 (USD Billion)
7.3 Class C
7.3.1 Class C Market Trends Analysis (2020-2032)
7.3.2 Class C Market Size Estimates and Forecasts to 2032 (USD Billion)
8. Fly Ash Market Segmentation, by Application
8.1 Chapter Overview
8.2 Cement & Concretes
8.2.1 Cement & Concretes Market Trends Analysis (2020-2032)
8.2.2 Cement & Concretes Market Size Estimates and Forecasts to 2032 (USD Billion)
8.3 Waste Stabilization
8.3.1 Waste Stabilization Market Trends Analysis (2020-2032)
8.3.2 Waste Stabilization Market Size Estimates and Forecasts to 2032 (USD Billion)
8.4 Mining
8.4.1 Mining Market Trends Analysis (2020-2032)
8.4.2 Mining Market Size Estimates and Forecasts to 2032 (USD Billion)
8.5 Fills & Embankments
8.5.1 Fills & Embankments Market Trends Analysis (2020-2032)
8.5.2 Fills & Embankments Market Size Estimates and Forecasts to 2032 (USD Billion)
8.6 Oilfield Service
8.6.1 Oilfield Service Market Trends Analysis (2020-2032)
8.6.2 Oilfield Service Market Size Estimates and Forecasts to 2032 (USD Billion)
8.7 Road Stabilization
8.7.1 Road Stabilization Market Trends Analysis (2020-2032)
8.7.2 Road Stabilization Market Size Estimates and Forecasts to 2032 (USD Billion)
8.8 Others
8.8.1 Others Market Trends Analysis (2020-2032)
8.8.2 Others Market Size Estimates and Forecasts to 2032 (USD Billion)
9. Regional Analysis
9.1 Chapter Overview
9.2 North America
9.2.1 Trends Analysis
9.2.2 North America Fly Ash Market Estimates and Forecasts, by Country (2020-2032) (USD Billion)
9.2.3 North America Fly Ash Market Estimates and Forecasts, By Type (2020-2032) (USD Billion)
9.2.4 North America Fly Ash Market Estimates and Forecasts, by Application (2020-2032) (USD Billion)
9.2.5 USA
9.2.5.1 USA Fly Ash Market Estimates and Forecasts, By Type (2020-2032) (USD Billion)
9.2.5.2 USA Fly Ash Market Estimates and Forecasts, by Application (2020-2032) (USD Billion)
9.2.6 Canada
9.2.6.1 Canada Fly Ash Market Estimates and Forecasts, By Type (2020-2032) (USD Billion)
9.2.6.2 Canada Fly Ash Market Estimates and Forecasts, by Application (2020-2032) (USD Billion)
9.2.7 Mexico
9.2.7.1 Mexico Fly Ash Market Estimates and Forecasts, By Type (2020-2032) (USD Billion)
9.2.7.2 Mexico Fly Ash Market Estimates and Forecasts, by Application (2020-2032) (USD Billion)
9.3 Europe
9.3.1 Eastern Europe
9.3.1.1 Trends Analysis
9.3.1.2 Eastern Europe Fly Ash Market Estimates and Forecasts, by Country (2020-2032) (USD Billion)
9.3.1.3 Eastern Europe Fly Ash Market Estimates and Forecasts, By Type (2020-2032) (USD Billion)
9.3.1.4 Eastern Europe Fly Ash Market Estimates and Forecasts, by Application (2020-2032) (USD Billion)
9.3.1.5 Poland
9.3.1.5.1 Poland Fly Ash Market Estimates and Forecasts, By Type (2020-2032) (USD Billion)
9.3.1.5.2 Poland Fly Ash Market Estimates and Forecasts, by Application (2020-2032) (USD Billion)
9.3.1.6 Romania
9.3.1.6.1 Romania Fly Ash Market Estimates and Forecasts, By Type (2020-2032) (USD Billion)
9.3.1.6.2 Romania Fly Ash Market Estimates and Forecasts, by Application (2020-2032) (USD Billion)
9.3.1.7 Hungary
9.3.1.7.1 Hungary Fly Ash Market Estimates and Forecasts, By Type (2020-2032) (USD Billion)
9.3.1.7.2 Hungary Fly Ash Market Estimates and Forecasts, by Application (2020-2032) (USD Billion)
9.3.1.8 Turkey
9.3.1.8.1 Turkey Fly Ash Market Estimates and Forecasts, By Type (2020-2032) (USD Billion)
9.3.1.8.2 Turkey Fly Ash Market Estimates and Forecasts, by Application (2020-2032) (USD Billion)
9.3.1.9 Rest of Eastern Europe
9.3.1.9.1 Rest of Eastern Europe Fly Ash Market Estimates and Forecasts, By Type (2020-2032) (USD Billion)
9.3.1.9.2 Rest of Eastern Europe Fly Ash Market Estimates and Forecasts, by Application (2020-2032) (USD Billion)
9.3.2 Western Europe
9.3.2.1 Trends Analysis
9.3.2.2 Western Europe Fly Ash Market Estimates and Forecasts, by Country (2020-2032) (USD Billion)
9.3.2.3 Western Europe Fly Ash Market Estimates and Forecasts, By Type (2020-2032) (USD Billion)
9.3.2.4 Western Europe Fly Ash Market Estimates and Forecasts, by Application (2020-2032) (USD Billion)
9.3.2.5 Germany
9.3.2.5.1 Germany Fly Ash Market Estimates and Forecasts, By Type (2020-2032) (USD Billion)
9.3.2.5.2 Germany Fly Ash Market Estimates and Forecasts, by Application (2020-2032) (USD Billion)
9.3.2.6 France
9.3.2.6.1 France Fly Ash Market Estimates and Forecasts, By Type (2020-2032) (USD Billion)
9.3.2.6.2 France Fly Ash Market Estimates and Forecasts, by Application (2020-2032) (USD Billion)
9.3.2.7 UK
9.3.2.7.1 UK Fly Ash Market Estimates and Forecasts, By Type (2020-2032) (USD Billion)
9.3.2.7.2 UK Fly Ash Market Estimates and Forecasts, by Application (2020-2032) (USD Billion)
9.3.2.8 Italy
9.3.2.8.1 Italy Fly Ash Market Estimates and Forecasts, By Type (2020-2032) (USD Billion)
9.3.2.8.2 Italy Fly Ash Market Estimates and Forecasts, by Application (2020-2032) (USD Billion)
9.3.2.9 Spain
9.3.2.9.1 Spain Fly Ash Market Estimates and Forecasts, By Type (2020-2032) (USD Billion)
9.3.2.9.2 Spain Fly Ash Market Estimates and Forecasts, by Application (2020-2032) (USD Billion)
9.3.2.10 Netherlands
9.3.2.10.1 Netherlands Fly Ash Market Estimates and Forecasts, By Type (2020-2032) (USD Billion)
9.3.2.10.2 Netherlands Fly Ash Market Estimates and Forecasts, by Application (2020-2032) (USD Billion)
9.3.2.11 Switzerland
9.3.2.11.1 Switzerland Fly Ash Market Estimates and Forecasts, By Type (2020-2032) (USD Billion)
9.3.2.11.2 Switzerland Fly Ash Market Estimates and Forecasts, by Application (2020-2032) (USD Billion)
9.3.2.12 Austria
9.3.2.12.1 Austria Fly Ash Market Estimates and Forecasts, By Type (2020-2032) (USD Billion)
9.3.2.12.2 Austria Fly Ash Market Estimates and Forecasts, by Application (2020-2032) (USD Billion)
9.3.2.13 Rest of Western Europe
9.3.2.13.1 Rest of Western Europe Fly Ash Market Estimates and Forecasts, By Type (2020-2032) (USD Billion)
9.3.2.13.2 Rest of Western Europe Fly Ash Market Estimates and Forecasts, by Application (2020-2032) (USD Billion)
9.4 Asia Pacific
9.4.1 Trends Analysis
9.4.2 Asia Pacific Fly Ash Market Estimates and Forecasts, by Country (2020-2032) (USD Billion)
9.4.3 Asia Pacific Fly Ash Market Estimates and Forecasts, By Type (2020-2032) (USD Billion)
9.4.4 Asia Pacific Fly Ash Market Estimates and Forecasts, by Application (2020-2032) (USD Billion)
9.4.5 China
9.4.5.1 China Fly Ash Market Estimates and Forecasts, By Type (2020-2032) (USD Billion)
9.4.5.2 China Fly Ash Market Estimates and Forecasts, by Application (2020-2032) (USD Billion)
9.4.6 India
9.4.5.1 India Fly Ash Market Estimates and Forecasts, By Type (2020-2032) (USD Billion)
9.4.5.2 India Fly Ash Market Estimates and Forecasts, by Application (2020-2032) (USD Billion)
9.4.5 Japan
9.4.5.1 Japan Fly Ash Market Estimates and Forecasts, By Type (2020-2032) (USD Billion)
9.4.5.2 Japan Fly Ash Market Estimates and Forecasts, by Application (2020-2032) (USD Billion)
9.4.6 South Korea
9.4.6.1 South Korea Fly Ash Market Estimates and Forecasts, By Type (2020-2032) (USD Billion)
9.4.6.2 South Korea Fly Ash Market Estimates and Forecasts, by Application (2020-2032) (USD Billion)
9.4.7 Vietnam
9.4.7.1 Vietnam Fly Ash Market Estimates and Forecasts, By Type (2020-2032) (USD Billion)
9.2.7.2 Vietnam Fly Ash Market Estimates and Forecasts, by Application (2020-2032) (USD Billion)
9.4.8 Singapore
9.4.8.1 Singapore Fly Ash Market Estimates and Forecasts, By Type (2020-2032) (USD Billion)
9.4.8.2 Singapore Fly Ash Market Estimates and Forecasts, by Application (2020-2032) (USD Billion)
9.4.9 Australia
9.4.9.1 Australia Fly Ash Market Estimates and Forecasts, By Type (2020-2032) (USD Billion)
9.4.9.2 Australia Fly Ash Market Estimates and Forecasts, by Application (2020-2032) (USD Billion)
9.4.10 Rest of Asia Pacific
9.4.10.1 Rest of Asia Pacific Fly Ash Market Estimates and Forecasts, By Type (2020-2032) (USD Billion)
9.4.10.2 Rest of Asia Pacific Fly Ash Market Estimates and Forecasts, by Application (2020-2032) (USD Billion)
9.5 Middle East and Africa
9.5.1 Middle East
9.5.1.1 Trends Analysis
9.5.1.2 Middle East Fly Ash Market Estimates and Forecasts, by Country (2020-2032) (USD Billion)
9.5.1.3 Middle East Fly Ash Market Estimates and Forecasts, By Type (2020-2032) (USD Billion)
9.5.1.4 Middle East Fly Ash Market Estimates and Forecasts, by Application (2020-2032) (USD Billion)
9.5.1.5 UAE
9.5.1.5.1 UAE Fly Ash Market Estimates and Forecasts, By Type (2020-2032) (USD Billion)
9.5.1.5.2 UAE Fly Ash Market Estimates and Forecasts, by Application (2020-2032) (USD Billion)
9.5.1.6 Egypt
9.5.1.6.1 Egypt Fly Ash Market Estimates and Forecasts, By Type (2020-2032) (USD Billion)
9.5.1.6.2 Egypt Fly Ash Market Estimates and Forecasts, by Application (2020-2032) (USD Billion)
9.5.1.7 Saudi Arabia
9.5.1.7.1 Saudi Arabia Fly Ash Market Estimates and Forecasts, By Type (2020-2032) (USD Billion)
9.5.1.7.2 Saudi Arabia Fly Ash Market Estimates and Forecasts, by Application (2020-2032) (USD Billion)
9.5.1.8 Qatar
9.5.1.8.1 Qatar Fly Ash Market Estimates and Forecasts, By Type (2020-2032) (USD Billion)
9.5.1.8.2 Qatar Fly Ash Market Estimates and Forecasts, by Application (2020-2032) (USD Billion)
9.5.1.9 Rest of Middle East
9.5.1.9.1 Rest of Middle East Fly Ash Market Estimates and Forecasts, By Type (2020-2032) (USD Billion)
9.5.1.9.2 Rest of Middle East Fly Ash Market Estimates and Forecasts, by Application (2020-2032) (USD Billion)
9.5.2 Africa
9.5.2.1 Trends Analysis
9.5.2.2 Africa Fly Ash Market Estimates and Forecasts, by Country (2020-2032) (USD Billion)
9.5.2.3 Africa Fly Ash Market Estimates and Forecasts, By Type (2020-2032) (USD Billion)
9.5.2.4 Africa Fly Ash Market Estimates and Forecasts, by Application (2020-2032) (USD Billion)
9.5.2.5 South Africa
9.5.2.5.1 South Africa Fly Ash Market Estimates and Forecasts, By Type (2020-2032) (USD Billion)
9.5.2.5.2 South Africa Fly Ash Market Estimates and Forecasts, by Application (2020-2032) (USD Billion)
9.5.2.6 Nigeria
9.5.2.6.1 Nigeria Fly Ash Market Estimates and Forecasts, By Type (2020-2032) (USD Billion)
9.5.2.6.2 Nigeria Fly Ash Market Estimates and Forecasts, by Application (2020-2032) (USD Billion)
9.6 Latin America
9.6.1 Trends Analysis
9.6.2 Latin America Fly Ash Market Estimates and Forecasts, by Country (2020-2032) (USD Billion)
9.6.3 Latin America Fly Ash Market Estimates and Forecasts, By Type (2020-2032) (USD Billion)
9.6.4 Latin America Fly Ash Market Estimates and Forecasts, by Application (2020-2032) (USD Billion)
9.6.5 Brazil
9.6.5.1 Brazil Fly Ash Market Estimates and Forecasts, By Type (2020-2032) (USD Billion)
9.6.5.2 Brazil Fly Ash Market Estimates and Forecasts, by Application (2020-2032) (USD Billion)
9.6.6 Argentina
9.6.6.1 Argentina Fly Ash Market Estimates and Forecasts, By Type (2020-2032) (USD Billion)
9.6.6.2 Argentina Fly Ash Market Estimates and Forecasts, by Application (2020-2032) (USD Billion)
9.6.7 Colombia
9.6.7.1 Colombia Fly Ash Market Estimates and Forecasts, By Type (2020-2032) (USD Billion)
9.6.7.2 Colombia Fly Ash Market Estimates and Forecasts, by Application (2020-2032) (USD Billion)
9.6.8 Rest of Latin America
9.6.8.1 Rest of Latin America Fly Ash Market Estimates and Forecasts, By Type (2020-2032) (USD Billion)
9.6.8.2 Rest of Latin America Fly Ash Market Estimates and Forecasts, by Application (2020-2032) (USD Billion)
10. Company Profiles
10.1 LafargeHolcim
10.1.1 Company Overview
10.1.2 Financial
10.1.3 Product / Services Offered
10.1.4 SWOT Analysis
10.2 HeidelbergCement
10.2.1 Company Overview
10.2.2 Financial
10.2.3 Product/ Services Offered
10.2.4 SWOT Analysis
10.3 CEMEX
10.3.1 Company Overview
10.3.2 Financial
10.3.3 Product/ Services Offered
10.3.4 SWOT Analysis
10.4 CRH plc
10.4.1 Company Overview
10.4.2 Financial
10.4.3 Product/ Services Offered
10.4.4 SWOT Analysis
10.5 UltraTech Cement
10.5.1 Company Overview
10.5.2 Financial
10.5.3 Product/ Services Offered
10.5.4 SWOT Analysis
10.6 ACC Limited
10.6.1 Company Overview
10.6.2 Financial
10.6.3 Product/ Services Offered
10.6.4 SWOT Analysis
10.7 Dalmia Bharat
10.7.1 Company Overview
10.7.2 Financial
10.7.3 Product/ Services Offered
10.7.4 SWOT Analysis
10.8 Cementos Argos
10.8.1 Company Overview
10.8.2 Financial
10.8.3 Product/ Services Offered
10.8.4 SWOT Analysis
10.9 Anhui Conch Cement
10.9.1 Company Overview
10.9.2 Financial
10.9.3 Product/ Services Offered
10.9.4 SWOT Analysis
10.10 Siam Cement Group
10.10.1 Company Overview
10.10.2 Financial
10.10.3 Product/ Services Offered
10.10.4 SWOT Analysis
11. Use Cases and Best Practices
12. Conclusion
An accurate research report requires proper strategizing as well as implementation. There are multiple factors involved in the completion of good and accurate research report and selecting the best methodology to compete the research is the toughest part. Since the research reports we provide play a crucial role in any company’s decision-making process, therefore we at SNS Insider always believe that we should choose the best method which gives us results closer to reality. This allows us to reach at a stage wherein we can provide our clients best and accurate investment to output ratio.
Each report that we prepare takes a timeframe of 350-400 business hours for production. Starting from the selection of titles through a couple of in-depth brain storming session to the final QC process before uploading our titles on our website we dedicate around 350 working hours. The titles are selected based on their current market cap and the foreseen CAGR and growth.
The 5 steps process:
Step 1: Secondary Research:
Secondary Research or Desk Research is as the name suggests is a research process wherein, we collect data through the readily available information. In this process we use various paid and unpaid databases which our team has access to and gather data through the same. This includes examining of listed companies’ annual reports, Journals, SEC filling etc. Apart from this our team has access to various associations across the globe across different industries. Lastly, we have exchange relationships with various university as well as individual libraries.

Step 2: Primary Research
When we talk about primary research, it is a type of study in which the researchers collect relevant data samples directly, rather than relying on previously collected data. This type of research is focused on gaining content specific facts that can be sued to solve specific problems. Since the collected data is fresh and first hand therefore it makes the study more accurate and genuine.
We at SNS Insider have divided Primary Research into 2 parts.
Part 1 wherein we interview the KOLs of major players as well as the upcoming ones across various geographic regions. This allows us to have their view over the market scenario and acts as an important tool to come closer to the accurate market numbers. As many as 45 paid and unpaid primary interviews are taken from both the demand and supply side of the industry to make sure we land at an accurate judgement and analysis of the market.
This step involves the triangulation of data wherein our team analyses the interview transcripts, online survey responses and observation of on filed participants. The below mentioned chart should give a better understanding of the part 1 of the primary interview.

Part 2: In this part of primary research the data collected via secondary research and the part 1 of the primary research is validated with the interviews from individual consultants and subject matter experts.
Consultants are those set of people who have at least 12 years of experience and expertise within the industry whereas Subject Matter Experts are those with at least 15 years of experience behind their back within the same space. The data with the help of two main processes i.e., FGDs (Focused Group Discussions) and IDs (Individual Discussions). This gives us a 3rd party nonbiased primary view of the market scenario making it a more dependable one while collation of the data pointers.
Step 3: Data Bank Validation
Once all the information is collected via primary and secondary sources, we run that information for data validation. At our intelligence centre our research heads track a lot of information related to the market which includes the quarterly reports, the daily stock prices, and other relevant information. Our data bank server gets updated every fortnight and that is how the information which we collected using our primary and secondary information is revalidated in real time.

Step 4: QA/QC Process
After all the data collection and validation our team does a final level of quality check and quality assurance to get rid of any unwanted or undesired mistakes. This might include but not limited to getting rid of the any typos, duplication of numbers or missing of any important information. The people involved in this process include technical content writers, research heads and graphics people. Once this process is completed the title gets uploader on our platform for our clients to read it.
Step 5: Final QC/QA Process:
This is the last process and comes when the client has ordered the study. In this process a final QA/QC is done before the study is emailed to the client. Since we believe in giving our clients a good experience of our research studies, therefore, to make sure that we do not lack at our end in any way humanly possible we do a final round of quality check and then dispatch the study to the client.
Key Segments:
By Type
Class F
Class C
By Application
Cement & Concretes
Waste Stabilization
Mining
Fills & Embankments
Oilfield Service
Road Stabilization
Others
Request for Segment Customization as per your Business Requirement: Segment Customization Request
Regional Coverage:
North America
US
Canada
Mexico
Europe
Eastern Europe
Poland
Romania
Hungary
Turkey
Rest of Eastern Europe
Western Europe
Germany
France
UK
Italy
Spain
Netherlands
Switzerland
Austria
Rest of Western Europe
Asia Pacific
China
India
Japan
South Korea
Vietnam
Singapore
Australia
Rest of Asia Pacific
Middle East & Africa
Middle East
UAE
Egypt
Saudi Arabia
Qatar
Rest of Middle East
Africa
Nigeria
South Africa
Rest of Africa
Latin America
Brazil
Argentina
Colombia
Rest of Latin America
Request for Country Level Research Report: Country Level Customization Request
Available Customization
With the given market data, SNS Insider offers customization as per the company’s specific needs. The following customization options are available for the report:
Product Analysis
Criss-Cross segment analysis (e.g. Product X Application)
Product Matrix which gives a detailed comparison of the product portfolio of each company
Geographic Analysis
Additional countries in any of the regions
Company Information
Detailed analysis and profiling of additional market players (Up to five)
The Engineered Stone Market Size was valued at USD 23.3 Billion in 2023 and will Reach to USD 39.2 Billion by 2032 and grow at a CAGR of 5.9% by 2024-2032.
The Dimer Acid Market Size was valued at USD 3.0 billion in 2023, and is expected to reach USD 5.2 billion by 2032, and grow at a CAGR of 6.4% over the forecast period 2024-2032.
The BOPET Film Market Size was valued at USD 7.9 billion in 2023 and is expected to reach USD 12.8 billion by 2032, and grow at a CAGR of 5.5% over the forecast period 2024-2032
Self-Healing Coatings Market was valued at USD 2.69 Billion in 2023 and is expected to reach USD 19.60 Billion by 2032, at a CAGR of 24.68% from 2024-2032.
Ultra-High Molecular Weight Polyethylene Market size was USD 2.75 Bn in 2023 and is expected to Reach USD 7.46 Bn by 2032 at a CAGR of 11.73% from 2024-2032.
Propylene Carbonate Market size was USD 396.40 Million in 2023 and is expected to reach USD 672.63 Million by 2032, growing at a CAGR of 6.05% from 2024-2032.

Hi! Click one of our member below to chat on Phone
© 2025 All Rights Reserved by SNS Insider Pvt Ltd


