Get More Information on Fluoroscopy Imaging Systems Market - Request Sample Report
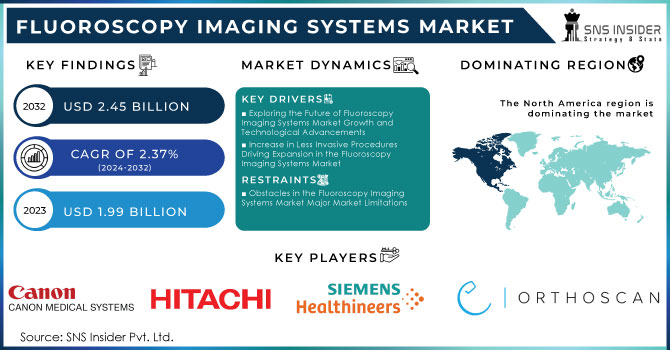
The Fluoroscopy Imaging Systems Market Size was valued at USD 1.99 billion in 2023 and is expected to reach USD 2.45 billion by 2032 and grow at a CAGR of 2.37% over the forecast period 2024-2032.
The fluoroscopy imaging systems market is anticipated to witness a robust growth as demand for real time imaging has been increasing in diagnosis and therapeutic procedures. Advances such these are helping to accelerate expansion, allowing for higher quality image output with lower radiation exposure — hence better patient safety through innovation (as seen in digital fluoroscopy). The increase in the number of chronic diseases, the rise in the population aged 60 and above years old, and the improvement of healthcare facilities across developing countries have also contributed to market growth. The market is buoyed by significant support from various governments worldwide to boost healthcare systems and facilitate the uptake of state-of-the-art imaging technologies in hospitals. Therefore, regulatory agencies such as the FDA and EMA play a vital role in ensuring these products are safe and effective which has an effect on market trends. The market is supported by the incorporation of high-end software and advanced 3D imaging technologies in fluoroscopy systems allows for accurate diagnosis. The fluoroscopy imaging systems market is anticipated to prosper as developments continue and investment expands in healthcare, the industry which it caters.
It is also experiencing a move towards energy efficiency, caused by increasing operational expenses and environmental worries. A recent study conducted at University Hospital Basel emphasizes the considerable opportunity for saving costs and improving the environment by making strategic operational changes, such as shutting down interventional imaging systems during non-working hours. The research showed that powering down unused systems could decrease energy usage by almost 145,000 kilowatt hours per year and lower electricity expenses by around USD 38,000, highlighting the significant economic and ecological benefits of enhanced energy control. This trend is gaining more importance as healthcare providers try to reduce the environmental impact of radiology equipment. The results emphasize the importance of energy-saving technologies and operational procedures in the fluoroscopy imaging systems sector. As the market grows, implementing energy-efficient strategies matches the larger objectives of sustainability and cost savings in healthcare. Incorporating these methods can improve the attractiveness of advanced fluoroscopy systems by providing better diagnostic abilities as well as lowering operational expenses and environmental footprint. The link between market expansion and energy efficiency efforts in healthcare shows an increasing focus on sustainable practices, leading to more innovation and the use of energy-efficient fluoroscopy imaging technologies.
The fluoroscopy imaging systems market is experiencing significant growth due to the increasing prevalence of chronic conditions like cardiovascular diseases, gastrointestinal disorders, and musculoskeletal injuries. Fluoroscopy, crucial for accurate diagnosis and treatment, is now a fundamental aspect of contemporary medical care. The increasing number of older people around the world highlights the importance of diagnostic imaging for treating chronic conditions such as heart disease, arthritis, and cancer. The growing importance of fluoroscopy is highlighted in minimally invasive procedures in various fields such as cardiology, orthopedics, oncology, and urology. Significant market potential is seen in procedures like angiography, spinal surgeries, and tumor ablations that rely on fluoroscopic guidance. Technological advancements, favorable healthcare policies, and increasing healthcare costs are boosting the market's growth by driving the use of fluoroscopy systems. Particularly, the move towards point-of-care imaging options, including portable fluoroscopy systems, handheld devices, and mobile C-arm units, aligns with the changing needs of healthcare professionals, particularly in emergency situations, outpatient surgery facilities, and distant areas. These advancements improve the ability to be carried, adaptability, and ease of use. Moreover, the increasing favoritism towards minimally invasive surgical methods, which provide benefits such as quicker recuperation, shorter hospital visits, and decreased complication rates, also drives the fluoroscopy industry. The increasing popularity of fluoroscopy is largely due to its crucial role in providing real-time imaging and guidance during medical procedures. Within the larger scope of medical imaging, techniques like ultrasonography, x-rays, CT scans, and nuclear medicine play a vital role in the diagnosis and treatment of diseases. The World Health Organization (WHO) is currently collaborating with partners to enhance diagnostic imaging services in low-income areas and improve medical imaging training, specifically emphasizing patient safety. This worldwide initiative to enhance and broaden imaging services corresponds with the increasing need for advanced fluoroscopy systems, underscoring the market's important contribution to modern healthcare.
The increase in minimally invasive procedures is a major driver of the fluoroscopy imaging systems market. Less invasive methods, characterized by smaller cuts and improved imaging for accurate direction, are gaining popularity due to their many benefits like faster healing, reduced risks, and shorter hospital visits. Fluoroscopy systems play a vital role in these procedures by providing live imaging for accurate guidance and performance. Fluoroscopy is commonly used in angiography procedures to visualize blood vessels and is essential for diagnosing and treating vascular problems. Coronary angiography is an illustration of a procedure that has become widely used in treating heart disease, involving the use of fluoroscopy to visualize the coronary arteries. The American Heart Association reports that approximately 7.9 Billion angiography procedures are performed annually in the United States, underscoring the high demand for fluoroscopy systems in cardiology. Improvements in medical technology, enhancing the functionalities of fluoroscopy systems, are also driving the shift towards less invasive methods. Improvements such as digital fluoroscopy, higher imaging quality, and advanced software integration are further boosting the growing popularity of these procedures. The rise in popularity of minimally invasive methods is anticipated to result in a greater need for fluoroscopy imaging systems, underscoring their crucial role in modern surgical procedures
Although the fluoroscopy imaging systems market is experiencing strong growth, various obstacles are hindering its expansion. A major obstacle is the expensive fluoroscopy systems and maintenance, making them unaffordable for smaller healthcare facilities and those in low-income areas. The expenses include both the initial cost and continuous expenses for system maintenance, updates, and training. Additionally, another limitation is the risk of radiation exposure from fluoroscopic procedures. While modern systems aim to reduce radiation, fluoroscopy still carries health risks for patients and healthcare workers if not managed correctly due to its inherent nature. The necessity of following radiation safety protocols is emphasized by the IAEA, but many institutions face challenges in complying with these practices due to logistical and financial reasons (IAEA Radiation Protection).Moreover, an increasing worry surrounds the environmental effects of fluoroscopy systems. The energy usage and e-waste produced by these systems add to the overall problem of sustainability in the environment. Healthcare facilities face additional complexity in reducing their carbon footprint due to disposing and recycling old systems and components (Environmental Protection Agency (EPA)).These constraints in the market emphasize the importance of continuous innovation and strategic planning in tackling the financial, safety, and environmental issues linked to fluoroscopy imaging systems.
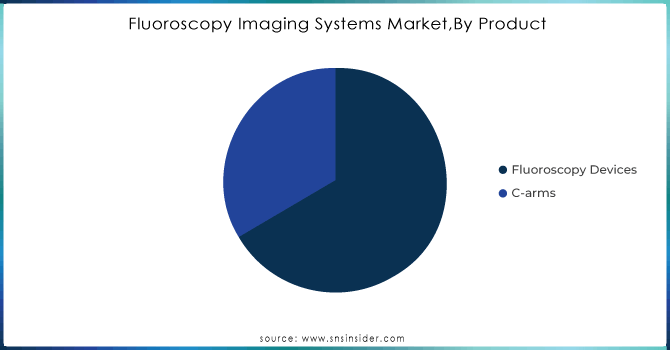
By Product
Based on Product,Fluoroscopy devices dominate the fluoroscopy imaging systems market, accounting for 67% of the market revenue in 2023. This control demonstrates their essential function in offering live imaging for a range of medical uses, from diagnostic tests to intricate surgical interventions. The reason why the market favors fluoroscopy devices is due to their advanced imaging abilities that allow for accurate guidance in procedures like angiography, spinal surgeries, and minimally invasive interventions. Top companies are leading the way in innovation in this field, improving the features and efficiency of fluoroscopy systems. As an example, GE Healthcare has launched the "Allia IGS 7" fluoroscopy system, blending cutting-edge imaging technology with artificial intelligence (AI) to enhance image quality and lower radiation exposure. The artificial intelligence in this system improves images in real-time and automatically optimizes doses, leading to improved patient results and operational efficiency (GE Healthcare). In the same way, Siemens Healthineers created the "Artis Pheno," an advanced fluoroscopy system with high-quality imaging and modern software for efficient workflow coordination. This system has capabilities such as 3D imaging and technologies that reduce doses, improving accuracy and lowering radiation exposure for both patients and operators (Siemens Healthineers). The growth of the fluoroscopy devices segment is being propelled by advancements that improve diagnostic accuracy, enhance procedural outcomes, and tackle radiation safety challenges. With the continual progression of technology, the fluoroscopy devices sector is predicted to uphold its top market status, thanks to continual improvements enhancing their vital role in current medical imaging.
Need any customization research on Fluoroscopy Imaging Systems Market - Enquiry Now
Based on End Users, Hospitals and specialty clinics hold the lead in the fluoroscopy imaging systems market as the biggest end-users, securing 45% of the market share in 2023. This large portion highlights the vital role played by these institutions in employing fluoroscopy for various diagnostic and interventional procedures. Hospitals and specialty clinics use fluoroscopy imaging systems for their advanced real-time imaging capabilities, which are crucial for procedures like angiography, spinal interventions, and minimally invasive surgeries. The increased need in these environments is caused by the requirement for accurate imaging to assist in surgical procedures, detect vascular conditions, and perform thorough patient assessments. Advancements in fluoroscopy technology have a significant influence in these healthcare settings. An example would be the "Azurion" series by Philips Healthcare, which includes advanced image processing and user-friendly touchscreen controls to improve fluoroscopic procedures' effectiveness and precision. This system smoothly blends into hospital operations, offering clear imaging and immediate guidance for various interventional procedures (Philips Healthcare). Furthermore, the Ziehm Imaging "Ziehm Vision RFD" mobile fluoroscopy system provides hospitals with increased flexibility and portability. These systems are created to quickly set up in different clinical environments like operating rooms and emergency departments, enhancing accessibility and workflow efficiency (Ziehm Imaging).The current focus in fluoroscopy systems within hospitals and specialty clinics is on enhancing image quality, minimizing radiation exposure, and improving integration with hospital information systems. These developments guarantee healthcare providers can provide accurate, secure, and effective care, strengthening the crucial role of hospitals and specialty clinics in boosting the growth of the fluoroscopy imaging systems market.
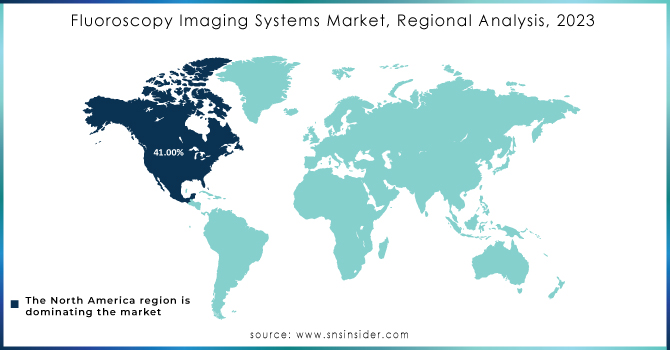
In the year 2023, North America dominated the fluoroscopy imaging systems market with a 41% market share. The region's leading position is due to its advanced healthcare facilities, widespread use of modern medical advancements, and substantial investments in research and development. The presence of leading medical device manufacturers in the United States, along with a growing demand for minimally invasive procedures, is key in driving the market. Leading the way in innovation in fluoroscopy imaging systems are companies like GE Healthcare, Siemens Healthineers, and Philips Healthcare, who have introduced new products to improve imaging precision, reduce radiation exposure, and enhance procedural outcomes. For instance, the "OEC Elite CFD" system by GE Healthcare, released in North America, combines sophisticated fluoroscopic features with a small design, making it suitable for both hospital and outpatient clinic settings. This system provides better image quality and dose efficiency, crucial for complex procedures like orthopedic surgeries and cardiovascular interventions. Also, Siemens Healthineers has unveiled the "Cios Alpha," a portable C-arm system equipped with a flat-panel detector that provides high-quality images and accommodates a wide variety of surgical procedures. The rise of innovation in North America is boosted by the introduction of AI-powered fluoroscopy systems like Philips Healthcare's "Azurion with FlexArm," improving procedural flexibility and enhancing imaging angles in surgeries (Philips Healthcare). The progress in technology, along with positive reimbursement policies and a growing emphasis on minimally invasive methods, further establish North America's dominance in the worldwide fluoroscopy imaging systems market.
In the fluoroscopy imaging systems market, the Asia-Pacific region held the second-largest portion of the market in 2023, representing 24% of the total global market share. The significant portion of the market is influenced by the region's quickly developing healthcare facilities, rising medical tourism, and growing incidence of chronic illnesses which necessitate advanced diagnostic imaging. Nations such as China, Japan, and India are leading the way in this expansion, making substantial contributions with their investments in healthcare and technological progress. China's focus on improving healthcare facilities has resulted in the widespread use of fluoroscopy systems, developed by local companies such as Mindray and Neusoft Medical Systems, offering affordable and groundbreaking imaging solutions. Japan, which is renowned for its technology capabilities, is still pushing the boundaries with companies such as Canon Medical Systems releasing state-of-the-art fluoroscopy systems that use artificial intelligence to improve image quality and procedural effectiveness. At the same time, India's healthcare industry is experiencing rapid expansion due to rising interest in less invasive medical techniques, as multinational corporations such as Siemens Healthineers and GE Healthcare are increasing their presence and range of products in the nation. Government efforts to enhance healthcare accessibility and affordability are reinforcing the expansion of this region, solidifying Asia-Pacific's position as a significant participant in the worldwide fluoroscopy imaging systems market.
The Major Players are Canon Medical Systems Corporation., Hitachi Medical Systems, Siemens Healthineers, Koninklijke Philips NV, GE HealthCare, Ziehm Imaging GmbH, Shimadzu, Orthoscan Inc., Hologic Inc, Carestream Health & Others Players
In July of 2023, a multipurpose fluoroscopic table with new features called Zexira i9 digital X-ray RF system was introduced by Canon Medical Systems. It is a digital X-ray RF system that comes with all the necessary features to fulfill clinical requirements.
In October 2021, Siemens Healthineers revealed the initial placement of LUMINOS Lotus Max at Long Island Jewish Valley Stream in the United States.
| Report Attributes | Details |
| Market Size in 2023 | USD 1.99 Billion |
| Market Size by 2032 | USD 2.45 Billion |
| CAGR | CAGR of 2.37 % From 2024 to 2032 |
| Base Year | 2023 |
| Forecast Period | 2024-2032 |
| Historical Data | 2020-2022 |
| Report Scope & Coverage | Market Size, Segments Analysis, Competitive Landscape, Regional Analysis, DROC & SWOT Analysis, Forecast Outlook |
| Key Segments | • By Type (Natural Language Processing (NLP), Machine Learning (ML), Others) • By Application (Medical Record Mining, Medical Imaging Analysis, Medicine Development, Emergency Assistance, Others) |
| Regional Analysis/Coverage | North America (US, Canada, Mexico), Europe (Eastern Europe [Poland, Romania, Hungary, Turkey, Rest of Eastern Europe] Western Europe] Germany, France, UK, Italy, Spain, Netherlands, Switzerland, Austria, Rest of Western Europe]), Asia-Pacific (China, India, Japan, South Korea, Vietnam, Singapore, Australia, Rest of Asia-Pacific), Middle East & Africa (Middle East [UAE, Egypt, Saudi Arabia, Qatar, Rest of Middle East], Africa [Nigeria, South Africa, Rest of Africa], Latin America (Brazil, Argentina, Colombia, Rest of Latin America) |
| Company Profiles | Canon Medical Systems Corporation., Hitachi Medical Systems,Siemens Healthineers, Koninklijke Philips NV,GE HealthCare,Ziehm Imaging GmbH,Shimadzu,Orthoscan Inc.,Hologic Inc,Carestream Health & Others |
| Key Drivers | • Exploring the Future of Fluoroscopy Imaging Systems Market Growth and Technological Advancements • Increase in Less Invasive Procedures Driving Expansion in the Fluoroscopy Imaging Systems Market |
| RESTRAINTS | • Obstacles in the Fluoroscopy Imaging Systems Market Major Market Limitations |
Ans: The Fluoroscopy Imaging Systems Market is expected to grow at a CAGR of 2.37% during 2024-2032.
Ans: The Fluoroscopy Imaging Systems Market Size was valued at USD 1.99 billion in 2023 and is expected to reach USD 2.45 billion by 2032
Ans: The major growth factor of the Fluoroscopy Imaging Systems Market is the increasing demand for minimally invasive surgical procedures, which rely heavily on real-time imaging for precision and safety.
Ans: The Fluoroscopy Devices segment dominated the Fluoroscopy Imaging Systems Market.
Ans: North America dominated the Fluoroscopy Imaging Systems Market in 2023.
Table of Contents
1. Introduction
1.1 Market Definition
1.2 Scope (Inclusion and Exclusions)
1.3 Research Assumptions
2. Executive Summary
2.1 Market Overview
2.2 Regional Synopsis
2.3 Competitive Summary
3. Research Methodology
3.1 Top-Down Approach
3.2 Bottom-up Approach
3.3. Data Validation
3.4 Primary Interviews
4. Market Dynamics Impact Analysis
4.1 Market Driving Factors Analysis
4.1.1 Drivers
4.1.2 Restraints
4.1.3 Opportunities
4.1.4 Challenges
4.2 PESTLE Analysis
4.3 Porter’s Five Forces Model
5. Statistical Insights and Trends Reporting
5.1 Incidence and Prevalence (2023)
5.2 Prescription Trends, (2023), by Region
5.3 Device Volume, by Region (2020-2032)
5.4 Healthcare Spending, by Region, (Government, Commercial, Private, Out-of-Pocket), 2023
6. Competitive Landscape
6.1 List of Major Companies, By Region
6.2 Market Share Analysis, By Region
6.3 Product Benchmarking
6.3.1 Product specifications and features
6.3.2 Pricing
6.4 Strategic Initiatives
6.4.1 Marketing and promotional activities
6.4.2 Distribution and supply chain strategies
6.4.3 Expansion plans and new product launches
6.4.4 Strategic partnerships and collaborations
6.5 Technological Advancements
6.6 Market Positioning and Branding
7. Fluoroscopy Imaging Systems Market Segmentation, by Product
7.1 Chapter Overview
7.2 Fluoroscopy Devices
7.2.1 Fluoroscopy Devices Market Trends Analysis (2020-2032)
7.2.2 Fluoroscopy Devices Market Size Estimates and Forecasts to 2032 (USD Billion)
7.3 C-arms
7.3.1 C-arms Market Trends Analysis (2020-2032)
7.3.2 C-arms Market Size Estimates and Forecasts to 2032 (USD Billion)
8. Fluoroscopy Imaging Systems Market Segmentation, by Application
8.1 Chapter Overview
8.2 Orthopedic
8.2.1 Orthopedic Market Trends Analysis (2020-2032)
8.2.2 Orthopedic Market Size Estimates and Forecasts to 2032 (USD Billion)
8.3 Cardiovascular
8.3.1 Cardiovascular Market Trends Analysis (2020-2032)
8.3.2 Cardiovascular Market Size Estimates and Forecasts to 2032 (USD Billion)
8.4 Pain Management & Trauma
8.4.1 Pain Management & Trauma Market Trends Analysis (2020-2032)
8.4.2 Pain Management & Trauma Market Size Estimates and Forecasts to 2032 (USD Billion)
8.5 Neurology
8.5.1 Neurology Market Trends Analysis (2020-2032)
8.5.2 Neurology Market Size Estimates and Forecasts to 2032 (USD Billion)
8.6 Gastrointestinal
8.6.1 Gastrointestinal Market Trends Analysis (2020-2032)
8.6.2 Gastrointestinal Market Size Estimates and Forecasts to 2032 (USD Billion)
8.7 Urology
8.7.1 Urology Market Trends Analysis (2020-2032)
8.7.2 Urology Market Size Estimates and Forecasts to 2032 (USD Billion)
8.8 General Surgery
8.8.1General Surgery Market Trends Analysis (2020-2032)
8.8.2 General Surgery Market Size Estimates and Forecasts to 2032 (USD Billion)
8.6 Others
8.6.1 Others Market Trends Analysis (2020-2032)
8.6.2 Others Market Size Estimates and Forecasts to 2032 (USD Billion)
9. Fluoroscopy Imaging Systems Market Segmentation, by End User
9.1 Chapter Overview
9.2 Hospitals & Specialty Clinics
9.2.1 Hospitals & Specialty Clinics Market Trends Analysis (2020-2032)
9.2.2 Hospitals & Specialty Clinics Market Size Estimates and Forecasts to 2032 (USD Billion)
9.3 Diagnostic Imaging centers
9.3.1 Diagnostic Imaging centers Market Trends Analysis (2020-2032)
9.3.2 Diagnostic Imaging centers Market Size Estimates and Forecasts to 2032 (USD Billion)
9.4 Others
9.4.1 Others Market Trends Analysis (2020-2032)
9.4.2 Others Market Size Estimates and Forecasts to 2032 (USD Billion)
10. Regional Analysis
10.1 Chapter Overview
10.2 North America
10.2.1 Trends Analysis
10.2.2 North America Fluoroscopy Imaging Systems Market Estimates and Forecasts, by Country (2020-2032) (USD Billion)
10.2.3 North America Fluoroscopy Imaging Systems Market Estimates and Forecasts, by Product (2020-2032) (USD Billion)
10.2.4 North America Fluoroscopy Imaging Systems Market Estimates and Forecasts, by Application (2020-2032) (USD Billion)
10.2.5 North America Fluoroscopy Imaging Systems Market Estimates and Forecasts, by End User (2020-2032) (USD Billion)
10.2.6 USA
10.2.6.1 USA Fluoroscopy Imaging Systems Market Estimates and Forecasts, by Product (2020-2032) (USD Billion)
10.2.6.2 USA Fluoroscopy Imaging Systems Market Estimates and Forecasts, by Application (2020-2032) (USD Billion)
10.2.6.3 USA Fluoroscopy Imaging Systems Market Estimates and Forecasts, by End User (2020-2032) (USD Billion)
10.2.7 Canada
10.2.7.1 Canada Fluoroscopy Imaging Systems Market Estimates and Forecasts, by Product (2020-2032) (USD Billion)
10.2.7.2 Canada Fluoroscopy Imaging Systems Market Estimates and Forecasts, by Application (2020-2032) (USD Billion)
10.2.7.3 Canada Fluoroscopy Imaging Systems Market Estimates and Forecasts, by End User (2020-2032) (USD Billion)
10.2.8 Mexico
10.2.8.1 Mexico Fluoroscopy Imaging Systems Market Estimates and Forecasts, by Product (2020-2032) (USD Billion)
10.2.8.2 Mexico Fluoroscopy Imaging SystemsMarket Estimates and Forecasts, by Application (2020-2032) (USD Billion)
10.2.8.3 Mexico Fluoroscopy Imaging SystemsMarket Estimates and Forecasts, by End User (2020-2032) (USD Billion)
10.3 Europe
10.3.1 Eastern Europe
10.3.1.1 Trends Analysis
10.3.1.2 Eastern Europe Fluoroscopy Imaging SystemsMarket Estimates and Forecasts, by Country (2020-2032) (USD Billion)
10.3.1.3 Eastern Europe Fluoroscopy Imaging SystemsMarket Estimates and Forecasts, by Product (2020-2032) (USD Billion)
10.3.1.4 Eastern Europe Fluoroscopy Imaging SystemsMarket Estimates and Forecasts, by Application (2020-2032) (USD Billion)
10.3.1.5 Eastern Europe Fluoroscopy Imaging SystemsMarket Estimates and Forecasts, by End User (2020-2032) (USD Billion)
10.3.1.6 Poland
10.3.1.6.1 Poland Fluoroscopy Imaging SystemsMarket Estimates and Forecasts, by Product (2020-2032) (USD Billion)
10.3.1.6.2 Poland Fluoroscopy Imaging SystemsMarket Estimates and Forecasts, by Application (2020-2032) (USD Billion)
10.3.1.6.3 Poland Fluoroscopy Imaging SystemsMarket Estimates and Forecasts, by End User (2020-2032) (USD Billion)
10.3.1.7 Romania
10.3.1.7.1 Romania Fluoroscopy Imaging SystemsMarket Estimates and Forecasts, by Product (2020-2032) (USD Billion)
10.3.1.7.2 Romania Fluoroscopy Imaging SystemsMarket Estimates and Forecasts, by Application (2020-2032) (USD Billion)
10.3.1.7.3 Romania Fluoroscopy Imaging SystemsMarket Estimates and Forecasts, by End User (2020-2032) (USD Billion)
10.3.1.8 Hungary
10.3.1.8.1 Hungary Fluoroscopy Imaging SystemsMarket Estimates and Forecasts, by Product (2020-2032) (USD Billion)
10.3.1.8.2 Hungary Fluoroscopy Imaging SystemsMarket Estimates and Forecasts, by Application (2020-2032) (USD Billion)
10.3.1.8.3 Hungary Fluoroscopy Imaging SystemsMarket Estimates and Forecasts, by End User (2020-2032) (USD Billion)
10.3.1.9 Turkey
10.3.1.9.1 Turkey Fluoroscopy Imaging SystemsMarket Estimates and Forecasts, by Product (2020-2032) (USD Billion)
10.3.1.9.2 Turkey Fluoroscopy Imaging SystemsMarket Estimates and Forecasts, by Application (2020-2032) (USD Billion)
10.3.1.9.3 Turkey Fluoroscopy Imaging SystemsMarket Estimates and Forecasts, by End User (2020-2032) (USD Billion)
10.3.1.10 Rest of Eastern Europe
10.3.1.10.1 Rest of Eastern Europe Fluoroscopy Imaging SystemsMarket Estimates and Forecasts, by Product (2020-2032) (USD Billion)
10.3.1.10.2 Rest of Eastern Europe Fluoroscopy Imaging SystemsMarket Estimates and Forecasts, by Application (2020-2032) (USD Billion)
10.3.1.10.3 Rest of Eastern Europe Fluoroscopy Imaging SystemsMarket Estimates and Forecasts, by End User (2020-2032) (USD Billion)
10.3.2 Western Europe
10.3.2.1 Trends Analysis
10.3.2.2 Western Europe Fluoroscopy Imaging SystemsMarket Estimates and Forecasts, by Country (2020-2032) (USD Billion)
10.3.2.3 Western Europe Fluoroscopy Imaging SystemsMarket Estimates and Forecasts, by Product (2020-2032) (USD Billion)
10.3.2.4 Western Europe Fluoroscopy Imaging SystemsMarket Estimates and Forecasts, by Application (2020-2032) (USD Billion)
10.3.2.5 Western Europe Fluoroscopy Imaging SystemsMarket Estimates and Forecasts, by End User (2020-2032) (USD Billion)
10.3.2.6 Germany
10.3.2.6.1 Germany Fluoroscopy Imaging SystemsMarket Estimates and Forecasts, by Product (2020-2032) (USD Billion)
10.3.2.6.2 Germany Fluoroscopy Imaging SystemsMarket Estimates and Forecasts, by Application (2020-2032) (USD Billion)
10.3.2.6.3 Germany Fluoroscopy Imaging SystemsMarket Estimates and Forecasts, by End User (2020-2032) (USD Billion)
10.3.2.7 France
10.3.2.7.1 France Fluoroscopy Imaging SystemsMarket Estimates and Forecasts, by Product (2020-2032) (USD Billion)
10.3.2.7.2 France Fluoroscopy Imaging SystemsMarket Estimates and Forecasts, by Application (2020-2032) (USD Billion)
10.3.2.7.3 France Fluoroscopy Imaging SystemsMarket Estimates and Forecasts, by End User (2020-2032) (USD Billion)
10.3.2.8 UK
10.3.2.8.1 UK Fluoroscopy Imaging SystemsMarket Estimates and Forecasts, by Product (2020-2032) (USD Billion)
10.3.2.8.2 UK Fluoroscopy Imaging SystemsMarket Estimates and Forecasts, by Application (2020-2032) (USD Billion)
10.3.2.8.3 UK Fluoroscopy Imaging SystemsMarket Estimates and Forecasts, by End User (2020-2032) (USD Billion)
10.3.2.9 Italy
10.3.2.9.1 Italy Fluoroscopy Imaging SystemsMarket Estimates and Forecasts, by Product (2020-2032) (USD Billion)
10.3.2.9.2 Italy Fluoroscopy Imaging SystemsMarket Estimates and Forecasts, by Application (2020-2032) (USD Billion)
10.3.2.9.3 Italy Fluoroscopy Imaging SystemsMarket Estimates and Forecasts, by End User (2020-2032) (USD Billion)
10.3.2.10 Spain
10.3.2.10.1 Spain Fluoroscopy Imaging SystemsMarket Estimates and Forecasts, by Product (2020-2032) (USD Billion)
10.3.2.10.2 Spain Fluoroscopy Imaging SystemsMarket Estimates and Forecasts, by Application (2020-2032) (USD Billion)
10.3.2.10.3 Spain Fluoroscopy Imaging SystemsMarket Estimates and Forecasts, by End User (2020-2032) (USD Billion)
10.3.2.11 Netherlands
10.3.2.11.1 Netherlands Fluoroscopy Imaging SystemsMarket Estimates and Forecasts, by Product (2020-2032) (USD Billion)
10.3.2.11.2 Netherlands Fluoroscopy Imaging SystemsMarket Estimates and Forecasts, by Application (2020-2032) (USD Billion)
10.3.2.11.3 Netherlands Fluoroscopy Imaging SystemsMarket Estimates and Forecasts, by End User (2020-2032) (USD Billion)
10.3.2.12 Switzerland
10.3.2.12.1 Switzerland Fluoroscopy Imaging SystemsMarket Estimates and Forecasts, by Product (2020-2032) (USD Billion)
10.3.2.12.2 Switzerland Fluoroscopy Imaging SystemsMarket Estimates and Forecasts, by Application (2020-2032) (USD Billion)
10.3.2.12.3 Switzerland Fluoroscopy Imaging SystemsMarket Estimates and Forecasts, by End User (2020-2032) (USD Billion)
10.3.2.13 Austria
10.3.2.13.1 Austria Fluoroscopy Imaging SystemsMarket Estimates and Forecasts, by Product (2020-2032) (USD Billion)
10.3.2.13.2 Austria Fluoroscopy Imaging SystemsMarket Estimates and Forecasts, by Application (2020-2032) (USD Billion)
10.3.2.13.3 Austria Fluoroscopy Imaging SystemsMarket Estimates and Forecasts, by End User (2020-2032) (USD Billion)
10.3.2.14 Rest of Western Europe
10.3.2.14.1 Rest of Western Europe Fluoroscopy Imaging SystemsMarket Estimates and Forecasts, by Product (2020-2032) (USD Billion)
10.3.2.14.2 Rest of Western Europe Fluoroscopy Imaging SystemsMarket Estimates and Forecasts, by Application (2020-2032) (USD Billion)
10.3.2.14.3 Rest of Western Europe Fluoroscopy Imaging SystemsMarket Estimates and Forecasts, by End User (2020-2032) (USD Billion)
10.4 Asia-Pacific
10.4.1 Trends Analysis
10.4.2 Asia-Pacific Fluoroscopy Imaging SystemsMarket Estimates and Forecasts, by Country (2020-2032) (USD Billion)
10.4.3 Asia-Pacific Fluoroscopy Imaging SystemsMarket Estimates and Forecasts, by Product (2020-2032) (USD Billion)
10.4.4 Asia-Pacific Fluoroscopy Imaging SystemsMarket Estimates and Forecasts, by Application (2020-2032) (USD Billion)
10.4.5 Asia-Pacific Fluoroscopy Imaging SystemsMarket Estimates and Forecasts, by End User (2020-2032) (USD Billion)
10.4.6 China
10.4.6.1 China Fluoroscopy Imaging SystemsMarket Estimates and Forecasts, by Product (2020-2032) (USD Billion)
10.4.6.2 China Fluoroscopy Imaging SystemsMarket Estimates and Forecasts, by Application (2020-2032) (USD Billion)
10.4.6.3 China Fluoroscopy Imaging SystemsMarket Estimates and Forecasts, by End User (2020-2032) (USD Billion)
10.4.7 India
10.4.7.1 India Fluoroscopy Imaging Systems Market Estimates and Forecasts, by Product (2020-2032) (USD Billion)
10.4.7.2 India Fluoroscopy Imaging SystemsMarket Estimates and Forecasts, by Application (2020-2032) (USD Billion)
10.4.7.3 India Fluoroscopy Imaging SystemsMarket Estimates and Forecasts, by End User (2020-2032) (USD Billion)
10.4.8 Japan
10.4.8.1 Japan Fluoroscopy Imaging SystemsMarket Estimates and Forecasts, by Product (2020-2032) (USD Billion)
10.4.8.2 Japan Fluoroscopy Imaging SystemsMarket Estimates and Forecasts, by Application (2020-2032) (USD Billion)
10.4.8.3 Japan Fluoroscopy Imaging SystemsMarket Estimates and Forecasts, by End User (2020-2032) (USD Billion)
10.4.9 South Korea
10.4.9.1 South Korea Fluoroscopy Imaging SystemsMarket Estimates and Forecasts, by Product (2020-2032) (USD Billion)
10.4.9.2 South Korea Fluoroscopy Imaging SystemsMarket Estimates and Forecasts, by Application (2020-2032) (USD Billion)
10.4.9.3 South Korea Fluoroscopy Imaging SystemsMarket Estimates and Forecasts, by End User (2020-2032) (USD Billion)
10.4.10 Vietnam
10.4.10.1 Vietnam Fluoroscopy Imaging SystemsMarket Estimates and Forecasts, by Product (2020-2032) (USD Billion)
10.4.10.2 Vietnam Fluoroscopy Imaging SystemsMarket Estimates and Forecasts, by Application (2020-2032) (USD Billion)
10.4.10.3 Vietnam Fluoroscopy Imaging SystemsMarket Estimates and Forecasts, by End User (2020-2032) (USD Billion)
10.4.11 Singapore
10.4.11.1 Singapore Fluoroscopy Imaging SystemsMarket Estimates and Forecasts, by Product (2020-2032) (USD Billion)
10.4.11.2 Singapore Fluoroscopy Imaging SystemsMarket Estimates and Forecasts, by Application (2020-2032) (USD Billion)
10.4.11.3 Singapore Fluoroscopy Imaging SystemsMarket Estimates and Forecasts, by End User (2020-2032) (USD Billion)
10.4.12 Australia
10.4.12.1 Australia Fluoroscopy Imaging SystemsMarket Estimates and Forecasts, by Product (2020-2032) (USD Billion)
10.4.12.2 Australia Fluoroscopy Imaging SystemsMarket Estimates and Forecasts, by Application (2020-2032) (USD Billion)
10.4.12.3 Australia Fluoroscopy Imaging SystemsMarket Estimates and Forecasts, by End User (2020-2032) (USD Billion)
10.4.13 Rest of Asia-Pacific
10.4.13.1 Rest of Asia-Pacific Fluoroscopy Imaging SystemsMarket Estimates and Forecasts, by Product (2020-2032) (USD Billion)
10.4.13.2 Rest of Asia-Pacific Fluoroscopy Imaging SystemsMarket Estimates and Forecasts, by Application (2020-2032) (USD Billion)
10.4.13.3 Rest of Asia-Pacific Fluoroscopy Imaging SystemsMarket Estimates and Forecasts, by End User (2020-2032) (USD Billion)
10.5 Middle East and Africa
10.5.1 Middle East
10.5.1.1 Trends Analysis
10.5.1.2 Middle East Fluoroscopy Imaging SystemsMarket Estimates and Forecasts, by Country (2020-2032) (USD Billion)
10.5.1.3 Middle East Fluoroscopy Imaging SystemsMarket Estimates and Forecasts, by Product (2020-2032) (USD Billion)
10.5.1.4 Middle East Fluoroscopy Imaging SystemsMarket Estimates and Forecasts, by Application (2020-2032) (USD Billion)
10.5.1.5 Middle East Fluoroscopy Imaging SystemsMarket Estimates and Forecasts, by End User (2020-2032) (USD Billion)
10.5.1.6 UAE
10.5.1.6.1 UAE Fluoroscopy Imaging SystemsMarket Estimates and Forecasts, by Product (2020-2032) (USD Billion)
10.5.1.6.2 UAE Fluoroscopy Imaging SystemsMarket Estimates and Forecasts, by Application (2020-2032) (USD Billion)
10.5.1.6.3 UAE Fluoroscopy Imaging SystemsMarket Estimates and Forecasts, by End User (2020-2032) (USD Billion)
10.5.1.7 Egypt
10.5.1.7.1 Egypt Fluoroscopy Imaging SystemsMarket Estimates and Forecasts, by Product (2020-2032) (USD Billion)
10.5.1.7.2 Egypt Fluoroscopy Imaging SystemsMarket Estimates and Forecasts, by Application (2020-2032) (USD Billion)
10.5.1.7.3 Egypt Fluoroscopy Imaging SystemsMarket Estimates and Forecasts, by End User (2020-2032) (USD Billion)
10.5.1.8 Saudi Arabia
10.5.1.8.1 Saudi Arabia Fluoroscopy Imaging Systems Market Estimates and Forecasts, by Product (2020-2032) (USD Billion)
10.5.1.8.2 Saudi Arabia Fluoroscopy Imaging SystemsMarket Estimates and Forecasts, by Application (2020-2032) (USD Billion)
10.5.1.8.3 Saudi Arabia Fluoroscopy Imaging SystemsMarket Estimates and Forecasts, by End User (2020-2032) (USD Billion)
10.5.1.9 Qatar
10.5.1.9.1 Qatar Fluoroscopy Imaging Systems Market Estimates and Forecasts, by Product (2020-2032) (USD Billion)
10.5.1.9.2 Qatar Fluoroscopy Imaging SystemsMarket Estimates and Forecasts, by Application (2020-2032) (USD Billion)
10.5.1.9.3 Qatar Fluoroscopy Imaging SystemsMarket Estimates and Forecasts, by End User (2020-2032) (USD Billion)
10.5.1.10 Rest of Middle East
10.5.1.10.1 Rest of Middle East Fluoroscopy Imaging Systems Market Estimates and Forecasts, by Product (2020-2032) (USD Billion)
10.5.1.10.2 Rest of Middle East Fluoroscopy Imaging SystemsMarket Estimates and Forecasts, by Application (2020-2032) (USD Billion)
10.5.1.10.3 Rest of Middle East Fluoroscopy Imaging SystemsMarket Estimates and Forecasts, by End User (2020-2032) (USD Billion)
10.5.2 Africa
10.5.2.1 Trends Analysis
10.5.2.2 Africa Fluoroscopy Imaging SystemsMarket Estimates and Forecasts, by Country (2020-2032) (USD Billion)
10.5.2.3 Africa Fluoroscopy Imaging SystemsMarket Estimates and Forecasts, by Product (2020-2032) (USD Billion)
10.5.2.4 Africa Fluoroscopy Imaging SystemsMarket Estimates and Forecasts, by Application (2020-2032) (USD Billion)
10.5.2.5 Africa Fluoroscopy Imaging SystemsMarket Estimates and Forecasts, by End User (2020-2032) (USD Billion)
10.5.2.6 South Africa
10.5.2.6.1 South Africa Fluoroscopy Imaging SystemsMarket Estimates and Forecasts, by Product (2020-2032) (USD Billion)
10.5.2.6.2 South Africa Fluoroscopy Imaging SystemsMarket Estimates and Forecasts, by Application (2020-2032) (USD Billion)
10.5.2.6.3 South Africa Fluoroscopy Imaging SystemsMarket Estimates and Forecasts, by End User (2020-2032) (USD Billion)
10.5.2.7 Nigeria
10.5.2.7.1 Nigeria Fluoroscopy Imaging SystemsMarket Estimates and Forecasts, by Product (2020-2032) (USD Billion)
10.5.2.7.2 Nigeria Fluoroscopy Imaging SystemsMarket Estimates and Forecasts, by Application (2020-2032) (USD Billion)
10.5.2.7.3 Nigeria Fluoroscopy Imaging SystemsMarket Estimates and Forecasts, by End User (2020-2032) (USD Billion)
10.5.2.8 Rest of Africa
10.5.2.8.1 Rest of Africa Fluoroscopy Imaging SystemsMarket Estimates and Forecasts, by Product (2020-2032) (USD Billion)
10.5.2.8.2 Rest of Africa Fluoroscopy Imaging SystemsMarket Estimates and Forecasts, by Application (2020-2032) (USD Billion)
10.5.2.8.3 Rest of Africa Fluoroscopy Imaging SystemsMarket Estimates and Forecasts, by End User (2020-2032) (USD Billion)
10.6 Latin America
10.6.1 Trends Analysis
10.6.2 Latin America Fluoroscopy Imaging SystemsMarket Estimates and Forecasts, by Country (2020-2032) (USD Billion)
10.6.3 Latin America Fluoroscopy Imaging SystemsMarket Estimates and Forecasts, by Product (2020-2032) (USD Billion)
10.6.4 Latin America Fluoroscopy Imaging SystemsMarket Estimates and Forecasts, by Application (2020-2032) (USD Billion)
10.6.5 Latin America Fluoroscopy Imaging SystemsMarket Estimates and Forecasts, by End User (2020-2032) (USD Billion)
10.6.6 Brazil
10.6.6.1 Brazil Fluoroscopy Imaging Systems Market Estimates and Forecasts, by Product (2020-2032) (USD Billion)
10.6.6.2 Brazil Fluoroscopy Imaging Systems Market Estimates and Forecasts, by Application (2020-2032) (USD Billion)
10.6.6.3 Brazil Fluoroscopy Imaging Systems Market Estimates and Forecasts, by End User (2020-2032) (USD Billion)
10.6.7 Argentina
10.6.7.1 Argentina Fluoroscopy Imaging SystemsMarket Estimates and Forecasts, by Product (2020-2032) (USD Billion)
10.6.7.2 Argentina Fluoroscopy Imaging SystemsMarket Estimates and Forecasts, by Application (2020-2032) (USD Billion)
10.6.7.3 Argentina Fluoroscopy Imaging SystemsMarket Estimates and Forecasts, by End User (2020-2032) (USD Billion)
10.6.8 Colombia
10.6.8.1 Colombia Fluoroscopy Imaging SystemsMarket Estimates and Forecasts, by Product (2020-2032) (USD Billion)
10.6.8.2 Colombia Fluoroscopy Imaging SystemsMarket Estimates and Forecasts, by Application (2020-2032) (USD Billion)
10.6.8.3 Colombia Fluoroscopy Imaging SystemsMarket Estimates and Forecasts, by End User (2020-2032) (USD Billion)
10.6.9 Rest of Latin America
10.6.9.1 Rest of Latin America Fluoroscopy Imaging SystemsMarket Estimates and Forecasts, by Product (2020-2032) (USD Billion)
10.6.9.2 Rest of Latin America Fluoroscopy Imaging SystemsMarket Estimates and Forecasts, by Application (2020-2032) (USD Billion)
10.6.9.3 Rest of Latin America Fluoroscopy Imaging SystemsMarket Estimates and Forecasts, by End User (2020-2032) (USD Billion)
11. Company Profiles
11.1 Canon Medical Systems Corporation.
11.1.1 Company Overview
11.1.2 Financial
11.1.3 Products/ Services Offered
11.1.4 SWOT Analysis
11.2 Hitachi Medical Systems
11.2.1 Company Overview
11.2.2 Financial
11.2.3 Products/ Services Offered
11.2.4 SWOT Analysis
11.3 Siemens Healthineers
11.3.1 Company Overview
11.3.2 Financial
11.3.3 Products/ Services Offered
11.3.4 SWOT Analysis
11.4 Koninklijke Philips NV
11.4.1 Company Overview
11.4.2 Financial
11.4.3 Products/ Services Offered
11.4.4 SWOT Analysis
11.5 GE HealthCare
11.5.1 Company Overview
11.5.2 Financial
11.5.3 Products/ Services Offered
11.5.4 SWOT Analysis
11.6 Ziehm Imaging GmbH
11.6.1 Company Overview
11.6.2 Financial
11.6.3 Products/ Services Offered
11.6.4 SWOT Analysis
11.7 Shimadzu
11.7.1 Company Overview
11.7.2 Financial
11.7.3 Products/ Services Offered
11.7.4 SWOT Analysis
11.8 Orthoscan Inc.,
11.8.1 Company Overview
11.8.2 Financial
11.8.3 Products/ Services Offered
11.8.4 SWOT Analysis
11.9 Hologic Inc
11.9.1 Company Overview
11.9.2 Financial
11.9.3 Products/ Services Offered
11.9.4 SWOT Analysis
11.10 Carestream Health
11.10.1 Company Overview
11.10.2 Financial
11.10.3 Products/ Services Offered
11.10.4 SWOT Analysis
12. Use Cases and Best Practices
13. Conclusion
An accurate research report requires proper strategizing as well as implementation. There are multiple factors involved in the completion of good and accurate research report and selecting the best methodology to compete the research is the toughest part. Since the research reports we provide play a crucial role in any company’s decision-making process, therefore we at SNS Insider always believe that we should choose the best method which gives us results closer to reality. This allows us to reach at a stage wherein we can provide our clients best and accurate investment to output ratio.
Each report that we prepare takes a timeframe of 350-400 business hours for production. Starting from the selection of titles through a couple of in-depth brain storming session to the final QC process before uploading our titles on our website we dedicate around 350 working hours. The titles are selected based on their current market cap and the foreseen CAGR and growth.
The 5 steps process:
Step 1: Secondary Research:
Secondary Research or Desk Research is as the name suggests is a research process wherein, we collect data through the readily available information. In this process we use various paid and unpaid databases which our team has access to and gather data through the same. This includes examining of listed companies’ annual reports, Journals, SEC filling etc. Apart from this our team has access to various associations across the globe across different industries. Lastly, we have exchange relationships with various university as well as individual libraries.

Step 2: Primary Research
When we talk about primary research, it is a type of study in which the researchers collect relevant data samples directly, rather than relying on previously collected data. This type of research is focused on gaining content specific facts that can be sued to solve specific problems. Since the collected data is fresh and first hand therefore it makes the study more accurate and genuine.
We at SNS Insider have divided Primary Research into 2 parts.
Part 1 wherein we interview the KOLs of major players as well as the upcoming ones across various geographic regions. This allows us to have their view over the market scenario and acts as an important tool to come closer to the accurate market numbers. As many as 45 paid and unpaid primary interviews are taken from both the demand and supply side of the industry to make sure we land at an accurate judgement and analysis of the market.
This step involves the triangulation of data wherein our team analyses the interview transcripts, online survey responses and observation of on filed participants. The below mentioned chart should give a better understanding of the part 1 of the primary interview.

Part 2: In this part of primary research the data collected via secondary research and the part 1 of the primary research is validated with the interviews from individual consultants and subject matter experts.
Consultants are those set of people who have at least 12 years of experience and expertise within the industry whereas Subject Matter Experts are those with at least 15 years of experience behind their back within the same space. The data with the help of two main processes i.e., FGDs (Focused Group Discussions) and IDs (Individual Discussions). This gives us a 3rd party nonbiased primary view of the market scenario making it a more dependable one while collation of the data pointers.
Step 3: Data Bank Validation
Once all the information is collected via primary and secondary sources, we run that information for data validation. At our intelligence centre our research heads track a lot of information related to the market which includes the quarterly reports, the daily stock prices, and other relevant information. Our data bank server gets updated every fortnight and that is how the information which we collected using our primary and secondary information is revalidated in real time.

Step 4: QA/QC Process
After all the data collection and validation our team does a final level of quality check and quality assurance to get rid of any unwanted or undesired mistakes. This might include but not limited to getting rid of the any typos, duplication of numbers or missing of any important information. The people involved in this process include technical content writers, research heads and graphics people. Once this process is completed the title gets uploader on our platform for our clients to read it.
Step 5: Final QC/QA Process:
This is the last process and comes when the client has ordered the study. In this process a final QA/QC is done before the study is emailed to the client. Since we believe in giving our clients a good experience of our research studies, therefore, to make sure that we do not lack at our end in any way humanly possible we do a final round of quality check and then dispatch the study to the client.
Key Market Segments:
By Product
Fluoroscopy Devices
C-arms
By Application
Orthopedic
Cardiovascular
Pain Management & Trauma
Neurology
Gastrointestinal
Urology
General Surgery
Others
By End User
Hospitals & Specialty Clinics
Diagnostic Imaging centers
Others
Request for Segment Customization as per your Business Requirement: Segment Customization Request
REGIONAL COVERAGE:
North America
US
Canada
Mexico
Europe
Eastern Europe
Poland
Romania
Hungary
Turkey
Rest of Eastern Europe
Western Europe
Germany
France
UK
Italy
Spain
Netherlands
Switzerland
Austria
Rest of Western Europe
Asia-Pacific
China
India
Japan
South Korea
Vietnam
Singapore
Australia
Rest of Asia-Pacific
Middle East & Africa
Middle East
UAE
Egypt
Saudi Arabia
Qatar
Rest of the Middle East
Africa
Nigeria
South Africa
Rest of Africa
Latin America
Brazil
Argentina
Colombia
Request for Country Level Research Report: Country Level Customization Request
Available Customization
With the given market data, SNS Insider offers customization as per the company’s specific needs. The following customization options are available for the report:
Product Analysis
Criss-Cross segment analysis (e.g. Product X Application)
Product Matrix which gives a detailed comparison of the product portfolio of each company
Geographic Analysis
Additional countries in any of the regions
Company Information
Detailed analysis and profiling of additional market players (Up to five)
Medical Gas Market Size was valued at USD 14.16 Billion in 2023 and is expected to reach USD 28.25 billion by 2032, growing at a CAGR of 8.0% over the forecast period 2024-2032.
The Patch-Based Wound Healing Products Market was valued at USD 1.35 billion in 2023 and is expected to reach USD 1.99 billion by 2032, growing at a CAGR of 4.42% over the forecast period 2024-2032.
Apoptosis Assay Market was valued at USD 5.77 billion in 2023 and is expected to reach USD 12.86 billion by 2032, growing at a CAGR of 9.37% from 2024 to 2032.
The Hospital Furniture market size was USD 9.06 billion in 2023 and is expected to reach USD 16.34 billion by 2032 and grow at a CAGR of 6.83% over the forecast period of 2024-2032.
Healthcare Chatbots Market Size was valued at USD 269.7 million in 2023 and is expected to reach USD 6557.2 million by 2032, growing at a CAGR of 23.88% over the forecast period 2024-2032.
The Large Molecule Bioanalytical Testing Services Market Size was valued at USD 1.98 billion in 2023 and is expected to reach USD 4.55 billion by 2032 and grow at a CAGR of 9.70% over the forecast period 2024-2032.

Hi! Click one of our member below to chat on Phone
© 2025 All Rights Reserved by SNS Insider Pvt Ltd


