image

Fluid Handling Systems Market Scope & Overview:

Fluid Handling Systems Market Revenue Analysis

To get more information on Fluid Handling Systems  Market - Request Free Sample Report

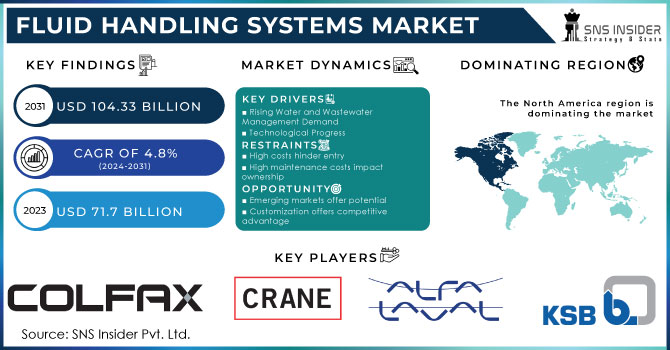
The Fluid Handling Systems Market Size was estimated at USD 74.55 billion in 2023 and is expected to arrive at USD 111.28 billion by 2032 with a growing CAGR of 4.55% over the forecast period 2024-2032. This report offers unique insights into the Fluid Handling Systems Market by examining technological innovation and adoption trends across regions, highlighting advancements in system design and automation. It also delves into capacity utilization rates over recent years, providing a snapshot of operational efficiency in key regions. The analysis includes regional supply chain and distribution metrics, offering valuable perspectives on logistics optimization. Additionally, it explores import/export trends, indicating the shifting dynamics in global trade. The report also identifies growing adoption of smart fluid handling solutions, driven by industrial IoT integration and sustainability efforts.

In the Fluid Handling Systems Market, the United States shows a steady growth trajectory from 2023 to 2032. Starting at USD 14.73 in 2023, the market value is projected to increase annually, USD 22.57 by 2032. This reflects a compound annual growth rate (CAGR) of 4.85% over the forecast period. The growth is driven by advancements in fluid handling technology, industrial automation, and increasing demand from key sectors such as chemicals, pharmaceuticals, and energy. The U.S. market is expected to remain a dominant force in North America, with continuous investments in infrastructure, sustainability, and smart fluid-handling systems.

Market Dynamics

Drivers

  • The rapid growth and automation in industries like chemicals, oil & gas, pharmaceuticals, and food & beverage are driving the demand for efficient, advanced fluid handling systems.

The rapid industrial growth in sectors such as chemicals, oil & gas, pharmaceuticals, and food & beverage is significantly driving the demand for fluid handling systems. With this growth comes the requirement for systems that can manage this flow, which means ensuring they are as efficient and reliable as possible. Also, increasing automation and technological advancements in these industries are elevating the demand for fluid handling solutions that are compatible with automation. Fluid handling systems are critical to operating at high performance as automation helps improve production efficiency, minimize human error, and increase safety. Rising productivity requirements from industries have paved to the evolution of smart fluid handling systems with features such as real-time monitoring, predictive maintenance, and remote-control solutions. The movement towards automation and modernization is also projected to keep fluid handling systems demand increase on an upward trajectory, with businesses focusing on more secure, economical, and easily scalable solutions.

Restraint

  • The high upfront cost of installing fluid handling systems, especially for complex applications, can be a barrier for small and medium-sized enterprises (SMEs).

The high initial investment required to set up fluid handling systems can be a significant barrier, particularly for small and medium-sized enterprises (SMEs). They have complex components (pumps, valves, pipes, control mechanisms) that require significant initial investments. Also, the cost of installation, customization for individual industrial applications, and integration with existing infrastructure can drive initial costs even higher. For SMEs, the cost of implementing such systems may outweigh the benefits perceived from using them, resulting in hesitancy to invest. This financial barrier can limit market growth by forcing small companies to choose lower-end cost options or postpone their investment in fluid management systems. This, coupled with high implementation complexities, means manufacturers and vendors need to find more economical solutions and financing options which can help the systems penetrate to wider applicant base, but especially at businesses pitched after the budget.

Opportunities

  • The growing focus on sustainability is driving industries to adopt eco-friendly fluid handling systems that reduce waste, improve water treatment, and lower energy consumption.

As environmental sustainability becomes a key concern across industries, there is increasing pressure on companies to adopt eco-friendly practices, including in fluid handling systems. This is an important step for making sustainability progress in some industries, among others, especially water treatment, chemical processing, and food & beverage can all be improved by reducing waste, offering more effective water management capabilities, and reducing energy use. Furthermore, firms are also investing in new age technologies that emphasize reducing environmental impact, including systems that reuse and recycle fluid more efficiently or run on renewable energy. Switching to sustainable fluid handling practices allows businesses to comply with tighter environmental regulations, but also improves operational performance to save on long-term costs. The increasing focus on green technology innovation creates a notable opportunity for market development, enabling a new class of fluid handling systems to emerge as industries strive to meet developing sustainable practices while moving toward cleaner end-of-process technologies.

Challenges

  • Supply chain disruptions, driven by various external factors, cause delays in procuring critical components, impacting production schedules and market growth

Supply chain disruptions have become a significant challenge in recent years, causing delays in the procurement of critical components necessary for manufacturing fluid handling systems. Geopolitical tensions, natural disasters, and transportation bottlenecks can all significantly disrupt the timely flow of raw materials and specialized parts. This causes manufacturers a lot of headaches with scheduling production runs and potentially getting product deliveries out on time and at a reasonable cost. Business continuity has taken a severe hit because of these disruptions, caused to a much larger extent by the pandemic, affecting inventory management and overall supply chain efficiency by rendering it difficult for businesses to meet growing demand. In fast-paced industries, this can result in lost opportunities and revenue growth as component lead times stretch. For fluid handling systems companies, the challenge will be to manage supply chain risks and create more resilient, more flexible supply chains to maintain competitive advantage in the current landscape, and to allow for continued growth despite unprecedented disruptions.

Segmentation Analysis

By Component

The pumps segment dominated with a market share of over 48% in 2023, owing to its critical part in transporting liquids and gases in different industries. Pumps are essential components in industries like oil & gas, chemicals, water treatment, and food processing, where the effective transportation of fluids is a core operational need. The systems can be found in applications spanning from water supply and waste management to industrial manufacturing processes. The broad-based application and requirement of pumps in commercial and industrial sectors of the playing field are major factors driving this market share. Moreover, ongoing improvements in pump technology, like greater energy efficiency and automation, also enhance their demand, and ensure that pumps hold the most share among all the components in fluid handling systems all over the world.

By End-Use Industry

The Chemical segment dominated with a market share of over 32% in 2023, due to its widespread use of these systems across multiple phases of chemical processing. They play a crucial role in safely moving, storing, and mixing chemicals during the production process, ensuring operations are efficient and safe. These systems are designed to handle all sorts of low and high temperature, volatile, corrosive fluids, and therefore require chemical equipment tailored to the requirements. The growth of industries utilizing chemicals, including manufacturing, agriculture, and pharmaceuticals, necessitates dependable fluid handling solutions. Moreover, strict regulations on safety and environmental protection simply make the industry more inclined toward using state-of-the-art fluid handling technologies.
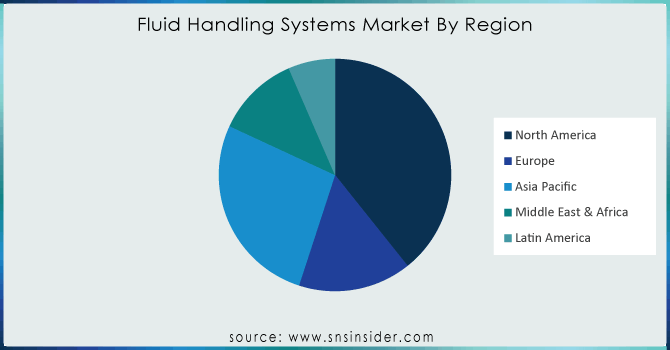
Key Regional Analysis

The Asia-Pacific region dominated with a market share of over 42% in 2023, which is expected to grow owing to rapid industrialization alongwith robust infrastructure development in countries such as China, India, and Japan. Some of these countries are witnessing high growth in their manufacturing sectors, especially oil & gas, chemicals, and water treatment sectors, which require better fluid handling systems. As industries like oil and gas, chemicals, and food & beverage continue to expand and modernize to meet growing production demands and regulatory requirements, the need for advanced fluid handling solutions is increasing. Furthermore, due to the enhanced industrial base and continuous developments in infrastructure projects, the demand for efficient and high-performance fluid handling systems is increasing in this region, thus contributing to Asia-Pacific being the largest region in terms of market share.

North America is experiencing the fastest growth in the Fluid Handling Systems Market, owing to the key industries, including oil & gas, chemicals, pharmaceuticals, and food & beverages. The U.S. and Canada are significant parts of a strong industrial base that the region enjoys. Rising Demand for Redefined Fluid Handling Systems for Enhanced Productivity and Safety Drives Market Growth. In addition, the increasing adoption of automation and intelligent technologies in fluid management processes is improving operational productivity across several sectors. Such advances, coupled with massive investments in the infrastructure and industrial processes sector, have been substantially expanding the fluid handling solutions market, and North America is one of the prominent regions in the overall fluid handling solutions market.

Fluid-Handling-Systems-Market-By-Region

Need any customization research on Fluid Handling Systems Market - Enquiry Now

Key players in the Fluid Handling Systems Market

  • Alfa Laval, (Heat Exchangers, Pumps, Valves)

  • KSB Company (Pumps, Valves, Fluid Handling Systems)

  • Crane Co. (Valves, Actuators, Control Systems)

  • Colfax Fluid Handling (Pumps, Filtration Systems)

  • Graco (Pumps, Dispensing Systems, Lubrication Equipment)

  • VRC Industrial Solutions (Fluid Handling Equipment, Pumps, Compressors)

  • Watec Fluid Handling Systems Co., Ltd. (Water Pumps, Fluid Handling Solutions)

  • Raymond Network (Fluid Handling and Storage Systems, Conveyors)

  • Parker Hannifin (Pumps, Valves, Filters, Hoses, Actuators)

  • Chesterton (Sealing Solutions, Pumps, Valves, Lubrication Systems)

  • LobePro (Positive Displacement Pumps)

  • IFH Group (Fluid Handling, Industrial Systems, Pumps)

  • Alemite Lubrication (Lubrication Equipment, Fluid Handling Systems)

  • Des-Case Corporation (Filtration Systems, Fluid Handling Solutions)

  • Dover (Fluid Handling, Pumping Systems, Dispensing Equipment)

  • Alfa Wasserman (Fluid Handling Equipment, Pumps)

  • Fraser Ross Ltd. (Pumps, Fluid Transfer Systems, Filtration Equipment)

  • Verder Group (Pumps, Fluid Handling, Filtration Systems)

  • SPX FLOW (Pumps, Valves, Heat Exchangers, Filtration Systems)

  • Pentair (Pumps, Valves, Filtration Systems, Water Treatment Solutions)

Suppliers for (pumps, valves, and filtration solutions for water treatment, energy, and industrial sectors) on the Fluid Handling Systems Market

  • Flowserve Corporation

  • ITT Inc.

  • Alfa Laval

  • Graco Inc.

  • Pentair plc

  • SPX Flow

  • KSB SE & Co. KGaA

  • Verder Group

  • Crane Co.

  • Xylem Inc.

Recent Development

In October 2023: Flowserve Corporation announced the signing of a definitive agreement to acquire Velan, a leading manufacturer of industrial valves with a strong presence in the nuclear, cryogenic, and defense sectors.

In September 2023: CIRCOR International, Inc. revealed the expansion of its Allweiler screw pump portfolio, now including vertical pump configurations in the SNA series, designed for installation in lube and hydraulic oil reservoirs.

Fluid Handling Systems Market Report Scope:

Report Attributes Details
Market Size in 2023 USD 74.55 Billion
Market Size by 2032 USD 111.28 Billion
CAGR CAGR of 4.55% From 2024 to 2032
Base Year 2023
Forecast Period 2024-2032
Historical Data 2020-2022
Report Scope & Coverage Market Size, Segments Analysis, Competitive  Landscape, Regional Analysis, DROC & SWOT Analysis, Forecast Outlook
Key Segments • By Component (Pumps (Centrifugal, Positive Displacement),Cntrol Valves) Sliding, Rotary, Others (Storage Tanks) Others)
• By End-Use Industry (Chemical, Food Processing, Power Generation, Marine, Others)
Regional Analysis/Coverage North America (US, Canada, Mexico), Europe (Eastern Europe [Poland, Romania, Hungary, Turkey, Rest of Eastern Europe] Western Europe] Germany, France, UK, Italy, Spain, Netherlands, Switzerland, Austria, Rest of Western Europe]), Asia Pacific (China, India, Japan, South Korea, Vietnam, Singapore, Australia, Rest of Asia Pacific), Middle East & Africa (Middle East [UAE, Egypt, Saudi Arabia, Qatar, Rest of Middle East], Africa [Nigeria, South Africa, Rest of Africa], Latin America (Brazil, Argentina, Colombia, Rest of Latin America)
Company Profiles Alfa Laval, KSB Company, Crane Co., Colfax Fluid Handling, Graco, VRC Industrial Solutions, Watec Fluid Handling Systems Co., Ltd., Raymond Network, Parker Hannifin, Chesterton, LobePro, IFH Group, Alemite Lubrication, Des-Case Corporation, Dover, Alfa Wasserman, Fraser Ross Ltd., Verder Group, SPX FLOW, Pentair.


Frequently Asked Questions

Ans: Asia-Pacific dominated the Fluid Handling Systems Market in 2023

Ans: The “pumps” segment dominated the Fluid Handling Systems Market.

 Ans: The rapid growth and automation in industries like chemicals, oil & gas, pharmaceuticals, and food & beverage are driving the demand for efficient, advanced fluid handling systems.

 Ans: The Fluid Handling Systems Market was USD 74.55 billion in 2023 and is expected to reach USD 111.28 billion by 2032.

Ans:  The Fluid Handling Systems Market is expected to grow at a CAGR of 4.55% from 2024-2032.

Table of Contents

1. Introduction

1.1 Market Definition

1.2 Scope (Inclusion and Exclusions)

1.3 Research Assumptions

2. Executive Summary

2.1 Market Overview

2.2 Regional Synopsis

2.3 Competitive Summary

3. Research Methodology

3.1 Top-Down Approach

3.2 Bottom-up Approach

3.3. Data Validation

3.4 Primary Interviews

4. Market Dynamics Impact Analysis

4.1 Market Driving Factors Analysis

4.1.2 Drivers

4.1.2 Restraints

4.1.3 Opportunities

4.1.4 Challenges

4.2 PESTLE Analysis

    1. Porter’s Five Forces Model

5. Statistical Insights and Trends Reporting

5.1 Technological Innovation and Adoption, by Region

5.2 Capacity Utilization Rates, by Region (2020-2023)

5.3 Supply Chain and Distribution Metrics, by Region

5.4 Import/Export Trends and Volumes, by Region (2023)

6. Competitive Landscape

6.1 List of Major Companies, By Region

6.2 Market Share Analysis, By Region

6.3 Product Benchmarking

6.3.1 Product specifications and features

6.3.2 Pricing

6.4 Strategic Initiatives

6.4.1 Marketing and promotional activities

6.4.2 Distribution and supply chain strategies

6.4.3 Expansion plans and new product launches

6.4.4 Strategic partnerships and collaborations

6.5 Technological Advancements

6.6 Market Positioning and Branding

7. Fluid Handling Systems Market Segmentation, By Component

7.1 Chapter Overview

7.2 Pumps

7.2.1 Pumps Market Trends Analysis (2020-2032)

7.2.2 Pumps Market Size Estimates and Forecasts to 2032 (USD Billion)

7.2.3 Centrifugal

7.2.3.1 Centrifugal Market Trends Analysis (2020-2032)

7.2.3.2 Centrifugal Market Size Estimates and Forecasts to 2032 (USD Billion)

7.2.4 Positive Displacement

7.2.4.1 Positive Displacement Market Trends Analysis (2020-2032)

7.2.4.2 Positive Displacement Market Size Estimates and Forecasts to 2032 (USD Billion)

7.3 Control Valves

7.3.1 Control Valves Market Trends Analysis (2020-2032)

7.3.2 Control Valves Market Size Estimates and Forecasts to 2032 (USD Billion)

7.3.3 Sliding

7.3.3.1 Sliding Market Trends Analysis (2020-2032)

7.3.3.2 Sliding Market Size Estimates and Forecasts to 2032 (USD Billion)

7.3.4 Rotary

7.3.4.1 Rotary Market Trends Analysis (2020-2032)

7.3.4.2 Rotary Market Size Estimates and Forecasts to 2032 (USD Billion)

7.3.5 Others

7.3.5.1 Others Market Trends Analysis (2020-2032)

7.3.5.2 Others Market Size Estimates and Forecasts to 2032 (USD Billion)

7.4 Storage Tanks

7.3.1 Storage Tanks Market Trends Analysis (2020-2032)

7.3.2 Storage Tanks Market Size Estimates and Forecasts to 2032 (USD Billion)

7.5 Others

7.5.1 Others Market Trends Analysis (2020-2032)

7.5.2 Others Market Size Estimates and Forecasts to 2032 (USD Billion)

8. Fluid Handling Systems Market Segmentation, By End-Use Industry

8.1 Chapter Overview

8.2 Chemical

8.2.1 Chemical Market Trends Analysis (2020-2032)

8.2.2 Chemical Market Size Estimates and Forecasts to 2032 (USD Billion)

 8.3 Food Processing

8.3.1 Food Processing Market Trends Analysis (2020-2032)

8.3.2 Food Processing Market Size Estimates and Forecasts to 2032 (USD Billion)

8.4 Power Generation

8.4.1 Power Generation Market Trends Analysis (2020-2032)

8.4.2 Power Generation Market Size Estimates and Forecasts to 2032 (USD Billion)

8.5 Marine

8.5.1 Marine Market Trends Analysis (2020-2032)

8.5.2 Marine Market Size Estimates and Forecasts to 2032 (USD Billion)

8.6 Others

8.6.1 Others Market Trends Analysis (2020-2032)

8.6.2 Others Market Size Estimates and Forecasts to 2032 (USD Billion)

9. Regional Analysis

9.1 Chapter Overview

9.2 North America

9.2.1 Trends Analysis

9.2.2 North America Fluid Handling Systems Market Estimates and Forecasts, by Country (2020-2032) (USD Billion)

9.2.3 North America Fluid Handling Systems Market Estimates and Forecasts, By Component (2020-2032) (USD Billion) 

9.2.4 North America Fluid Handling Systems Market Estimates and Forecasts, By End-Use Industry (2020-2032) (USD Billion)

9.2.5 USA

9.2.5.1 USA Fluid Handling Systems Market Estimates and Forecasts, By Component (2020-2032) (USD Billion)

9.2.5.2 USA Fluid Handling Systems Market Estimates and Forecasts, By End-Use Industry (2020-2032) (USD Billion)

9.2.6 Canada

9.2.6.1 Canada Fluid Handling Systems Market Estimates and Forecasts, By Component (2020-2032) (USD Billion)

9.2.6.2 Canada Fluid Handling Systems Market Estimates and Forecasts, By End-Use Industry (2020-2032) (USD Billion)

9.2.7 Mexico

9.2.7.1 Mexico Fluid Handling Systems Market Estimates and Forecasts, By Component (2020-2032) (USD Billion)

9.2.7.2 Mexico Fluid Handling Systems Market Estimates and Forecasts, By End-Use Industry (2020-2032) (USD Billion)

9.3 Europe

9.3.1 Eastern Europe

9.3.1.1 Trends Analysis

9.3.1.2 Eastern Europe Fluid Handling Systems Market Estimates and Forecasts, by Country (2020-2032) (USD Billion)

9.3.1.3 Eastern Europe Fluid Handling Systems Market Estimates and Forecasts, By Component (2020-2032) (USD Billion) 

9.3.1.4 Eastern Europe Fluid Handling Systems Market Estimates and Forecasts, By End-Use Industry (2020-2032) (USD Billion)

9.3.1.5 Poland

9.3.1.5.1 Poland Fluid Handling Systems Market Estimates and Forecasts, By Component (2020-2032) (USD Billion)

9.3.1.5.2 Poland Fluid Handling Systems Market Estimates and Forecasts, By End-Use Industry (2020-2032) (USD Billion)

9.3.1.6 Romania

9.3.1.6.1 Romania Fluid Handling Systems Market Estimates and Forecasts, By Component (2020-2032) (USD Billion)

9.3.1.6.2 Romania Fluid Handling Systems Market Estimates and Forecasts, By End-Use Industry (2020-2032) (USD Billion)

9.3.1.7 Hungary

9.3.1.7.1 Hungary Fluid Handling Systems Market Estimates and Forecasts, By Component (2020-2032) (USD Billion)

9.3.1.7.2 Hungary Fluid Handling Systems Market Estimates and Forecasts, By End-Use Industry (2020-2032) (USD Billion)

9.3.1.8 Turkey

9.3.1.8.1 Turkey Fluid Handling Systems Market Estimates and Forecasts, By Component (2020-2032) (USD Billion)

9.3.1.8.2 Turkey Fluid Handling Systems Market Estimates and Forecasts, By End-Use Industry (2020-2032) (USD Billion)

9.3.1.9 Rest of Eastern Europe

9.3.1.9.1 Rest of Eastern Europe Fluid Handling Systems Market Estimates and Forecasts, By Component (2020-2032) (USD Billion)

9.3.1.9.2 Rest of Eastern Europe Fluid Handling Systems Market Estimates and Forecasts, By End-Use Industry (2020-2032) (USD Billion)

9.3.2 Western Europe

9.3.2.1 Trends Analysis

9.3.2.2 Western Europe Fluid Handling Systems Market Estimates and Forecasts, by Country (2020-2032) (USD Billion)

9.3.2.3 Western Europe Fluid Handling Systems Market Estimates and Forecasts, By Component (2020-2032) (USD Billion) 

9.3.2.4 Western Europe Fluid Handling Systems Market Estimates and Forecasts, By End-Use Industry (2020-2032) (USD Billion)

9.3.2.5 Germany

9.3.2.5.1 Germany Fluid Handling Systems Market Estimates and Forecasts, By Component (2020-2032) (USD Billion)

9.3.2.5.2 Germany Fluid Handling Systems Market Estimates and Forecasts, By End-Use Industry (2020-2032) (USD Billion)

9.3.2.6 France

9.3.2.6.1 France Fluid Handling Systems Market Estimates and Forecasts, By Component (2020-2032) (USD Billion)

9.3.2.6.2 France Fluid Handling Systems Market Estimates and Forecasts, By End-Use Industry (2020-2032) (USD Billion)

9.3.2.7 UK

9.3.2.7.1 UK Fluid Handling Systems Market Estimates and Forecasts, By Component (2020-2032) (USD Billion)

9.3.2.7.2 UK Fluid Handling Systems Market Estimates and Forecasts, By End-Use Industry (2020-2032) (USD Billion)

9.3.2.8 Italy

9.3.2.8.1 Italy Fluid Handling Systems Market Estimates and Forecasts, By Component (2020-2032) (USD Billion)

9.3.2.8.2 Italy Fluid Handling Systems Market Estimates and Forecasts, By End-Use Industry (2020-2032) (USD Billion)

9.3.2.9 Spain

9.3.2.9.1 Spain Fluid Handling Systems Market Estimates and Forecasts, By Component (2020-2032) (USD Billion)

9.3.2.9.2 Spain Fluid Handling Systems Market Estimates and Forecasts, By End-Use Industry (2020-2032) (USD Billion)

9.3.2.10 Netherlands

9.3.2.10.1 Netherlands Fluid Handling Systems Market Estimates and Forecasts, By Component (2020-2032) (USD Billion)

9.3.2.10.2 Netherlands Fluid Handling Systems Market Estimates and Forecasts, By End-Use Industry (2020-2032) (USD Billion)

9.3.2.11 Switzerland

9.3.2.11.1 Switzerland Fluid Handling Systems Market Estimates and Forecasts, By Component (2020-2032) (USD Billion)

9.3.2.11.2 Switzerland Fluid Handling Systems Market Estimates and Forecasts, By End-Use Industry (2020-2032) (USD Billion)

9.3.2.12 Austria

9.3.2.12.1 Austria Fluid Handling Systems Market Estimates and Forecasts, By Component (2020-2032) (USD Billion)

9.3.2.12.2 Austria Fluid Handling Systems Market Estimates and Forecasts, By End-Use Industry (2020-2032) (USD Billion)

9.3.2.13 Rest of Western Europe

9.3.2.13.1 Rest of Western Europe Fluid Handling Systems Market Estimates and Forecasts, By Component (2020-2032) (USD Billion)

9.3.2.13.2 Rest of Western Europe Fluid Handling Systems Market Estimates and Forecasts, By End-Use Industry (2020-2032) (USD Billion)

9.4 Asia Pacific

9.4.1 Trends Analysis

9.4.2 Asia Pacific Fluid Handling Systems Market Estimates and Forecasts, by Country (2020-2032) (USD Billion)

9.4.3 Asia Pacific Fluid Handling Systems Market Estimates and Forecasts, By Component (2020-2032) (USD Billion) 

9.4.4 Asia Pacific Fluid Handling Systems Market Estimates and Forecasts, By End-Use Industry (2020-2032) (USD Billion)

9.4.5 China

9.4.5.1 China Fluid Handling Systems Market Estimates and Forecasts, By Component (2020-2032) (USD Billion)

9.4.5.2 China Fluid Handling Systems Market Estimates and Forecasts, By End-Use Industry (2020-2032) (USD Billion)

9.4.6 India

9.4.5.1 India Fluid Handling Systems Market Estimates and Forecasts, By Component (2020-2032) (USD Billion)

9.4.5.2 India Fluid Handling Systems Market Estimates and Forecasts, By End-Use Industry (2020-2032) (USD Billion)

9.4.5 Japan

9.4.5.1 Japan Fluid Handling Systems Market Estimates and Forecasts, By Component (2020-2032) (USD Billion)

9.4.5.2 Japan Fluid Handling Systems Market Estimates and Forecasts, By End-Use Industry (2020-2032) (USD Billion)

9.4.6 South Korea

9.4.6.1 South Korea Fluid Handling Systems Market Estimates and Forecasts, By Component (2020-2032) (USD Billion)

9.4.6.2 South Korea Fluid Handling Systems Market Estimates and Forecasts, By End-Use Industry (2020-2032) (USD Billion)

9.4.7 Vietnam

9.4.7.1 Vietnam Fluid Handling Systems Market Estimates and Forecasts, By Component (2020-2032) (USD Billion)

9.2.7.2 Vietnam Fluid Handling Systems Market Estimates and Forecasts, By End-Use Industry (2020-2032) (USD Billion)

9.4.8 Singapore

9.4.8.1 Singapore Fluid Handling Systems Market Estimates and Forecasts, By Component (2020-2032) (USD Billion)

9.4.8.2 Singapore Fluid Handling Systems Market Estimates and Forecasts, By End-Use Industry (2020-2032) (USD Billion)

9.4.9 Australia

9.4.9.1 Australia Fluid Handling Systems Market Estimates and Forecasts, By Component (2020-2032) (USD Billion)

9.4.9.2 Australia Fluid Handling Systems Market Estimates and Forecasts, By End-Use Industry (2020-2032) (USD Billion)

9.4.10 Rest of Asia Pacific

9.4.10.1 Rest of Asia Pacific Fluid Handling Systems Market Estimates and Forecasts, By Component (2020-2032) (USD Billion)

9.4.10.2 Rest of Asia Pacific Fluid Handling Systems Market Estimates and Forecasts, By End-Use Industry (2020-2032) (USD Billion)

9.5 Middle East and Africa

9.5.1 Middle East

9.5.1.1 Trends Analysis

9.5.1.2 Middle East Fluid Handling Systems Market Estimates and Forecasts, by Country (2020-2032) (USD Billion)

9.5.1.3 Middle East Fluid Handling Systems Market Estimates and Forecasts, By Component (2020-2032) (USD Billion) 

9.5.1.4 Middle East Fluid Handling Systems Market Estimates and Forecasts, By End-Use Industry (2020-2032) (USD Billion)

9.5.1.5 UAE

9.5.1.5.1 UAE Fluid Handling Systems Market Estimates and Forecasts, By Component (2020-2032) (USD Billion)

9.5.1.5.2 UAE Fluid Handling Systems Market Estimates and Forecasts, By End-Use Industry (2020-2032) (USD Billion)

9.5.1.6 Egypt

9.5.1.6.1 Egypt Fluid Handling Systems Market Estimates and Forecasts, By Component (2020-2032) (USD Billion)

9.5.1.6.2 Egypt Fluid Handling Systems Market Estimates and Forecasts, By End-Use Industry (2020-2032) (USD Billion)

9.5.1.7 Saudi Arabia

9.5.1.7.1 Saudi Arabia Fluid Handling Systems Market Estimates and Forecasts, By Component (2020-2032) (USD Billion)

9.5.1.7.2 Saudi Arabia Fluid Handling Systems Market Estimates and Forecasts, By End-Use Industry (2020-2032) (USD Billion)

9.5.1.8 Qatar

9.5.1.8.1 Qatar Fluid Handling Systems Market Estimates and Forecasts, By Component (2020-2032) (USD Billion)

9.5.1.8.2 Qatar Fluid Handling Systems Market Estimates and Forecasts, By End-Use Industry (2020-2032) (USD Billion)

9.5.1.9 Rest of Middle East

9.5.1.9.1 Rest of Middle East Fluid Handling Systems Market Estimates and Forecasts, By Component (2020-2032) (USD Billion)

9.5.1.9.2 Rest of Middle East Fluid Handling Systems Market Estimates and Forecasts, By End-Use Industry (2020-2032) (USD Billion)

9.5.2 Africa

9.5.2.1 Trends Analysis

9.5.2.2 Africa Fluid Handling Systems Market Estimates and Forecasts, by Country (2020-2032) (USD Billion)

9.5.2.3 Africa Fluid Handling Systems Market Estimates and Forecasts, By Component (2020-2032) (USD Billion) 

9.5.2.4 Africa Fluid Handling Systems Market Estimates and Forecasts, By End-Use Industry (2020-2032) (USD Billion)

9.5.2.5 South Africa

9.5.2.5.1 South Africa Fluid Handling Systems Market Estimates and Forecasts, By Component (2020-2032) (USD Billion)

9.5.2.5.2 South Africa Fluid Handling Systems Market Estimates and Forecasts, By End-Use Industry (2020-2032) (USD Billion)

9.5.2.6 Nigeria

9.5.2.6.1 Nigeria Fluid Handling Systems Market Estimates and Forecasts, By Component (2020-2032) (USD Billion)

9.5.2.6.2 Nigeria Fluid Handling Systems Market Estimates and Forecasts, By End-Use Industry (2020-2032) (USD Billion)

9.5.2.7 Rest of Africa

9.5.2.7.1 Rest of Africa Fluid Handling Systems Market Estimates and Forecasts, By Component (2020-2032) (USD Billion)

9.5.2.7.2 Rest of Africa Fluid Handling Systems Market Estimates and Forecasts, By End-Use Industry (2020-2032) (USD Billion)

9.6 Latin America

9.6.1 Trends Analysis

9.6.2 Latin America Fluid Handling Systems Market Estimates and Forecasts, by Country (2020-2032) (USD Billion)

9.6.3 Latin America Fluid Handling Systems Market Estimates and Forecasts, By Component (2020-2032) (USD Billion) 

9.6.4 Latin America Fluid Handling Systems Market Estimates and Forecasts, By End-Use Industry (2020-2032) (USD Billion)

9.6.5 Brazil

9.6.5.1 Brazil Fluid Handling Systems Market Estimates and Forecasts, By Component (2020-2032) (USD Billion)

9.6.5.2 Brazil Fluid Handling Systems Market Estimates and Forecasts, By End-Use Industry (2020-2032) (USD Billion)

9.6.6 Argentina

9.6.6.1 Argentina Fluid Handling Systems Market Estimates and Forecasts, By Component (2020-2032) (USD Billion)

9.6.6.2 Argentina Fluid Handling Systems Market Estimates and Forecasts, By End-Use Industry (2020-2032) (USD Billion)

9.6.7 Colombia

9.6.7.1 Colombia Fluid Handling Systems Market Estimates and Forecasts, By Component (2020-2032) (USD Billion)

9.6.7.2 Colombia Fluid Handling Systems Market Estimates and Forecasts, By End-Use Industry (2020-2032) (USD Billion)

9.6.8 Rest of Latin America

9.6.8.1 Rest of Latin America Fluid Handling Systems Market Estimates and Forecasts, By Component (2020-2032) (USD Billion)

9.6.8.2 Rest of Latin America Fluid Handling Systems Market Estimates and Forecasts, By End-Use Industry (2020-2032) (USD Billion)

10. Company Profiles

10.1 Alfa Laval

10.1.1 Company Overview

10.1.2 Financial

10.1.3 Products/ Services Offered

110.1.4 SWOT Analysis

10.2 KSB Company

10.2.1 Company Overview

10.2.2 Financial

10.2.3 Products/ Services Offered

10.2.4 SWOT Analysis

10.3 Crane Co.

              10.3.1 Company Overview

10.3.2 Financial

10.3.3 Products/ Services Offered

10.3.4 SWOT Analysis

10.4 Colfax Fluid Handling

 10.4.1 Company Overview

10.4.2 Financial

10.4.3 Products/ Services Offered

10.4.4 SWOT Analysis

10.5 Graco

              10.5.1 Company Overview

10.5.2 Financial

10.5.3 Products/ Services Offered

10.5.4 SWOT Analysis

10.6 VRC Industrial Solutions

10.6.1 Company Overview

10.6.2 Financial

10.6.3 Products/ Services Offered

10.6.4 SWOT Analysis

10.7 Watec Fluid Handling Systems Co., Ltd.

              10.7.1 Company Overview

10.7.2 Financial

10.7.3 Products/ Services Offered

10.7.4 SWOT Analysis

10.8 Raymond Network

              10.8.1 Company Overview

10.8.2 Financial

10.8.3 Products/ Services Offered

10.8.4 SWOT Analysis

10.9 Parker Hannifin

10.9.1 Company Overview

10.9.2 Financial

10.9.3 Products/ Services Offered

10.9.4 SWOT Analysis

10.10 Chesterton

             10.9.1 Company Overview

10.9.2 Financial

10.9.3 Products/ Services Offered

10.9.4 SWOT Analysis

11. Use Cases and Best Practices

12. Conclusion

An accurate research report requires proper strategizing as well as implementation. There are multiple factors involved in the completion of good and accurate research report and selecting the best methodology to compete the research is the toughest part. Since the research reports we provide play a crucial role in any company’s decision-making process, therefore we at SNS Insider always believe that we should choose the best method which gives us results closer to reality. This allows us to reach at a stage wherein we can provide our clients best and accurate investment to output ratio.

Each report that we prepare takes a timeframe of 350-400 business hours for production. Starting from the selection of titles through a couple of in-depth brain storming session to the final QC process before uploading our titles on our website we dedicate around 350 working hours. The titles are selected based on their current market cap and the foreseen CAGR and growth.


The 5 steps process:

Step 1: Secondary Research:

Secondary Research or Desk Research is as the name suggests is a research process wherein, we collect data through the readily available information. In this process we use various paid and unpaid databases which our team has access to and gather data through the same. This includes examining of listed companies’ annual reports, Journals, SEC filling etc. Apart from this our team has access to various associations across the globe across different industries. Lastly, we have exchange relationships with various university as well as individual libraries.

Secondary Research

Step 2: Primary Research

When we talk about primary research, it is a type of study in which the researchers collect relevant data samples directly, rather than relying on previously collected data.  This type of research is focused on gaining content specific facts that can be sued to solve specific problems. Since the collected data is fresh and first hand therefore it makes the study more accurate and genuine.

We at SNS Insider have divided Primary Research into 2 parts.

Part 1 wherein we interview the KOLs of major players as well as the upcoming ones across various geographic regions. This allows us to have their view over the market scenario and acts as an important tool to come closer to the accurate market numbers. As many as 45 paid and unpaid primary interviews are taken from both the demand and supply side of the industry to make sure we land at an accurate judgement and analysis of the market.

This step involves the triangulation of data wherein our team analyses the interview transcripts, online survey responses and observation of on filed participants. The below mentioned chart should give a better understanding of the part 1 of the primary interview.

Primary Research

Part 2: In this part of primary research the data collected via secondary research and the part 1 of the primary research is validated with the interviews from individual consultants and subject matter experts.

Consultants are those set of people who have at least 12 years of experience and expertise within the industry whereas Subject Matter Experts are those with at least 15 years of experience behind their back within the same space. The data with the help of two main processes i.e., FGDs (Focused Group Discussions) and IDs (Individual Discussions). This gives us a 3rd party nonbiased primary view of the market scenario making it a more dependable one while collation of the data pointers.

Step 3: Data Bank Validation

Once all the information is collected via primary and secondary sources, we run that information for data validation. At our intelligence centre our research heads track a lot of information related to the market which includes the quarterly reports, the daily stock prices, and other relevant information. Our data bank server gets updated every fortnight and that is how the information which we collected using our primary and secondary information is revalidated in real time.

Data Bank Validation

Step 4: QA/QC Process

After all the data collection and validation our team does a final level of quality check and quality assurance to get rid of any unwanted or undesired mistakes. This might include but not limited to getting rid of the any typos, duplication of numbers or missing of any important information. The people involved in this process include technical content writers, research heads and graphics people. Once this process is completed the title gets uploader on our platform for our clients to read it.

Step 5: Final QC/QA Process:

This is the last process and comes when the client has ordered the study. In this process a final QA/QC is done before the study is emailed to the client. Since we believe in giving our clients a good experience of our research studies, therefore, to make sure that we do not lack at our end in any way humanly possible we do a final round of quality check and then dispatch the study to the client.

Key Segment:

By Component

    • Pumps

  • Centrifugal

  • Positive Displacement

    • Control Valves

  • Sliding

  • Rotary

  • Others

    • Storage Tanks

    • Others

By End-Use Industry

  • Chemical

  • Food Processing

  • Power Generation

  • Marine

  • Others

Request for Segment Customization as per your Business Requirement: Segment Customization Request

Regional Coverage:

North America

  • US

  • Canada

  • Mexico

Europe

  • Eastern Europe

    • Poland

    • Romania

    • Hungary

    • Turkey

    • Rest of Eastern Europe

  • Western Europe

    • Germany

    • France

    • UK

    • Italy

    • Spain

    • Netherlands

    • Switzerland

    • Austria

    • Rest of Western Europe

Asia Pacific

  • China

  • India

  • Japan

  • South Korea

  • Vietnam

  • Singapore

  • Australia

  • Rest of Asia Pacific

Middle East & Africa

  • Middle East

    • UAE

    • Egypt

    • Saudi Arabia

    • Qatar

    • Rest of Middle East

  • Africa

    • Nigeria

    • South Africa

    • Rest of Africa

Latin America

  • Brazil

  • Argentina

  • Colombia

  • Rest of Latin America

Request for Country Level Research Report: Country Level Customization Request

Available Customization

With the given market data, SNS Insider offers customization as per the company’s specific needs. The following customization options are available for the report:

  • Detailed Volume Analysis

  • Criss-Cross segment analysis (e.g. Product X Application)

  • Competitive Product Benchmarking

  • Geographic Analysis

  • Additional countries in any of the regions

  • Customized Data Representation

  • Detailed analysis and profiling of additional market players


  •            5000 (33% Discount)


  •            8950 (40% Discount)


  •            3050 (23% Discount)

Start a Conversation

Hi! Click one of our member below to chat on Phone