Flue Gas Desulfurization System Market Report Scope & Overview:
Get More Information on Flue Gas Desulfurization System Market - Request Sample Report
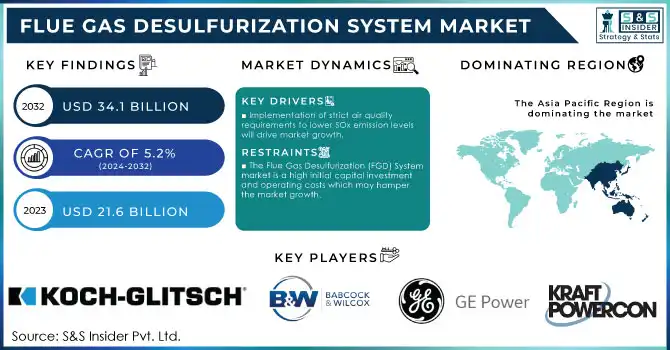
The Flue Gas Desulfurization System Market Size was USD 21.6 Billion in 2023 and is expected to reach USD 34.1 Billion by 2032 and grow at a CAGR of 5.2% over the forecast period of 2024-2032.
The increasing penetration of renewables, be it solar, wind, or hydropower, is a huge threat to conventional coal-based power generation as the dependence on fossil fuels is decreasing. This change, however, also increases demand for investment in emission control technologies, particularly the Flue Gas Desulfurization (FGD) system, to ensure regulatory compliance across the coal-fired power plants in the existing power infrastructure. Advanced FGD systems can be retrofitted into these plants, providing operators with the ability to significantly reduce sulfur dioxide (SO₂) emissions and prolong the life of older plants. Active applications and implementation of this focus in regions where coal is still a major part of the energy mix, as governments steadily tighten air quality standards to limit the impact of environmental pollution.
According to the International Energy Agency (IEA), in 2023, over 85% of global energy-related CO₂ emissions came from the fossil fuel sector, with coal-fired power plants being the largest contributor. In response, many countries have implemented stringent air quality standards and emission reduction targets, as seen in the EU's Industrial Emissions Directive (IED), which sets limits on sulfur dioxide emissions from power plants.
The increased demand for energy, particularly in developing countries, is an important reason for coal-fired power plants to continue running. As these economies become more industrialized and urbanized, they rapidly ramp up energy consumption, and coal is an affordable and readily accessible source of power. More than 60% of energy demand worldwide, in 2023, has originated from developing countries, in which coal is still pivotal, the International Energy Agency (IEA) said. However this growing dependence on coal is not without its environmental costs, especially with respect to sulfur dioxide (SO₂). Governments need to achieve more stringent air quality standards as well as international environmental commitments; hence, the installation of Flue Gas Desulfurization (FGD) systems in such plants is mandatory.
Flue Gas Desulfurization System Market Dynamics
Drivers
-
Implementation of strict air quality requirements to lower SOx emission levels will drive market growth.
One factor that acutely determines the growth of the FGD system market is introduction of tighter air quality enabling regulations for lowering sulfur oxide (SO2) emissions. As part of the global effort to strengthen environmental protection and respond to increasing public demand and international climate agreements, governments have begun to impose tight regulations and limits on emissions of sulfur dioxide (SO₂), the most important contributor to SOx, from industrial sources, especially from coal-fired power stations. Specifically, the Industrial Emissions Directive (IED) by the European Union and the U.S. Clean Air Act (CAA) establish stringent SO₂ emissions limits, forcing power plants to equip sophisticated FGD systems to meet such regulations. Flue gas desulfurization (FGD) systems are used to remove SO₂ from the flue gases of fossil-fuel power plants to comply with increasingly stringent air quality regulations. The required reduction in air pollution and the health hazards caused by SOx emissions will drive demand for the technology, which will widen the growth of the FGD systems market. In densely populated areas and industrial centers, governments are under considerable pressure to improve air quality, which is driving the continued need for these systems to aid cleaner, more sustainable energy production.
According to the Ministry of Ecology and Environment (MEE), China has implemented stringent regulations under the Air Pollution Prevention and Control Action Plan, aiming to reduce SO₂ emissions by 15% by 2025 from 2015 levels.
Restraint
-
The Flue Gas Desulfurization (FGD) System market is a high initial capital investment and operating costs which may hamper the market growth.
The initial capital investment and operating costs act as a restraint on the flue gas desulfurization (FGD) system market and can restrict the growth of this market. The FGD systems, particularly wet FGD technologies, have high upfront capital costs associated with the purchase and installation of more complex equipment, including scrubbers, pumps, and towers. Moreover, they need high maintenance and operational costs which include energy, electricity, water, and chemical inputs to run these systems which makes the total cost of operation high. However, in developing economies or regions where budget constraints are felt more acutely, these financial burdens can easily postpone or prevent the installation of FGD systems altogether. In addition to this, byproducts such as gypsum present a disposal cost and environmental burden which may be even more daunting for plants in regions with stringent environmental regulations.
Flue Gas Desulfurization System Market Segmentation Overview
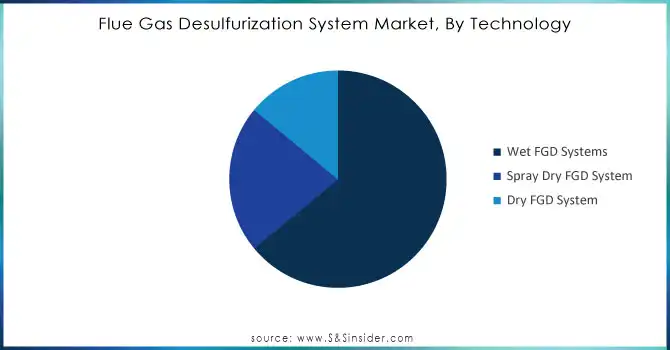
By Technology
The Wet FGD system segment held the largest market share around 32% in 2023. It is owing to its efficiency and effectiveness in the reduction of sulfur dioxide (SO₂) emissions from flue gases. Wet FGD systems utilize a mixture of water and alkaline materials like limestone or lime to remove sulfur dioxide from flue gases. Widely favored for its proven success in large-scale energy plants and industrial facilities, this technology achieves over 95-98% SO₂ removal efficiency, critical for complying with demanding environmental regulations. Wet FGD systems are highly effective in managing sulfur emissions and, therefore, are primarily used in coal-dependent regions with high sulfur emissions concerns. In addition, wet systems generate valuable by-products like gypsum that can be sold to the construction sector, reducing part of the cost of operations.
Get Customized Report as per Your Business Requirement - Request For Customized Report
By Application
The power plant segment held the largest market share around 32% in 2023. This is because of the high demand for power generation and the very stringent regulation on SO₂ emissions. Sulfur emissions from power plants particularly coal-fired generation are controversial among the regulatory community, and virtually all such facilities have adopted FGD systems due to environmental requirements. Power plants as widely as possible have implemented effective emission control technologies, as mandated by government policy in a marketplace constrained by domestic and international agreements, e.g., the Paris Agreement, that require these polluters to meet air quality standards. Consequently, to reduce SO₂ emissions, power plants are heavily investing in FGD systems, which account for the largest segment of the market.
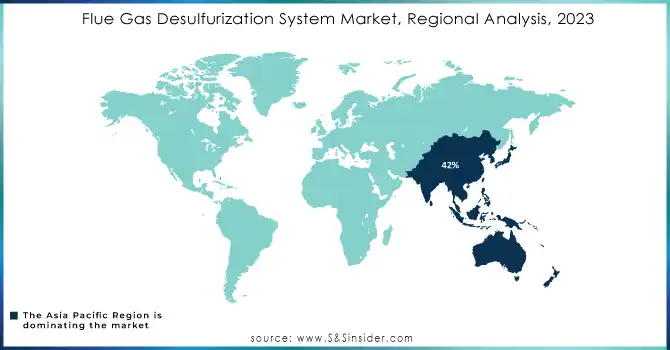
Flue Gas Desulfurization System Market Regional Analysis
Asia Pacific held the highest market share around 42% in 2023. This is owing to factors such as a high dependence on coal for power generation and fast-growing industrial sectors in the region. Although coal emits substantially more sulfur dioxide (SO₂) than other fuel sources, it remains the largest source of electricity in the world and the largest consumer of coal is China, followed by India. These investments have been made to install FGD systems to comply with strict domestic and international environmental regulations including China’s Air Pollution Prevention and Control Action Plan and India’s National Clean Air Programme. Additionally, APAC is also going through a rapid phase of industrialization and urbanization, which will provide a significant amount of energy in the forecast period, boosting the region for better emissions control technologies. The accession of FGD systems is critical to abatement emissions from pulverized coal-fired generation plants in the region where governments are imposing higher environmental standards. Moreover, with growing emphasis on air quality and air pollution-related health issues in APAC countries, the demand for such advanced pollution control technologies as FGD systems is on the rise. FGD systems have become a strongly held market in the Asia-Pacific region as these dependencies of a high level of energy demands and regulations in the need for environmental sustainability collide
Key Players in Flue Gas Desulfurization System Market
-
Koch-Glitsch (Tower Packing and Scrubber Systems)
-
HAMON (Wet and Dry Scrubbing Solutions)
-
Babcock & Wilcox Enterprises, Inc. (Spray Dryer Absorbers and Wet FGD Systems)
-
GE Power (Advanced FGD Systems and Limestone-based Solutions)
-
Mitsubishi Hitachi Power Systems, Ltd. (Twin Tower FGD and Wet-Limestone Scrubbers)
-
GEA Group Aktiengesellschaft (Dry Scrubbing Technologies and Filter Systems)
-
KraftPowercon (Power Supplies for FGD and Electrostatic Precipitators)
-
Carmeuse (Limestone and Lime Products for Desulfurization)
-
ANDRITZ AG (FGD Gypsum Dewatering Systems and Scrubbing Units)
-
Thermax Ltd. (FGD Retrofit and Custom Solutions)
-
Fujian Longking Co., Ltd. (Wet and Semi-dry FGD Systems)
-
Valmet Corporation (Limestone FGD and Emission Control Systems)
-
Siemens Energy (FGD Process Optimization Solutions)
-
Doosan Lentjes GmbH (Seawater FGD and Wet Scrubber Technologies)
-
ALSTOM SA (Dry and Wet Scrubber Technologies)
-
Ducon Technologies Inc. (High-Efficiency Spray Towers and Absorption Systems)
-
China National Building Material Company (CNBM) (FGD Equipment for Coal-fired Plants)
-
Macrotek Inc. (Venturi Scrubbers and Limestone Systems)
-
Clyde Bergemann Power Group (FGD Gas Handling and Dust Control Solutions)
-
Hitachi Zosen Corporation (Advanced Wet and Dry Desulfurization Systems)
Recent Development:
-
In 2023, Saint-Gobain expanded its range of fluoropolymer-based tubing products by launching a new high-performance PFA tubing line designed specifically for use in critical applications within the pharmaceutical and biotechnology Industry.
-
In 2023, Thermax launched a new modular FGD system that offers quick installation and high performance, designed to meet stringent sulfur emission norms in emerging economies with lower capital expenditure.
-
In 2023, Turboden launched an advanced Organic Rankine Cycle (ORC) system that integrates with FGD systems to generate additional power from waste heat, improving energy efficiency in industrial applications.
| Report Attributes | Details |
|---|---|
| Market Size in 2023 | US$ 21.6 Billion |
| Market Size by 2032 | US$ 34.1 Billion |
| CAGR | CAGR of 5.2% From 2024 to 2032 |
| Base Year | 2023 |
| Forecast Period | 2024-2032 |
| Historical Data | 2020-2022 |
| Report Scope & Coverage | Market Size, Segments Analysis, Competitive Landscape, Regional Analysis, DROC & SWOT Analysis, Forecast Outlook |
| Key Segments | • By Technology (Wet FGD Systems, Spray Dry FGD System, Dry FGD System) • By Application (Power Plants, Chemicals, Cement, Metal Processing and Mining, Manufacturing) |
| Regional Analysis/Coverage | North America (US, Canada, Mexico), Europe (Eastern Europe [Poland, Romania, Hungary, Turkey, Rest of Eastern Europe] Western Europe [Germany, France, UK, Italy, Spain, Netherlands, Switzerland, Austria, Rest of Western Europe]), Asia Pacific (China, India, Japan, South Korea, Vietnam, Singapore, Australia, Rest of Asia Pacific), Middle East & Africa (Middle East [UAE, Egypt, Saudi Arabia, Qatar, Rest of Middle East], Africa [Nigeria, South Africa, Rest of Africa], Latin America (Brazil, Argentina, Colombia, Rest of Latin America) |
| Company Profiles | Koch-Glitsch, S.A. HAMON, Babcock & Wilcox Enterprises, Inc., GE Power, Mitsubishi Hitachi Power Systems, Ltd., GEA Group Aktiengesellschaft, KraftPowercon, Carmeuse, ANDRUTZ AG, Thermax Ltd. |
| DRIVERS | • Strict rules for sulphur oxide pollution |
| Restraints | • Clean energy sources will become more common and be used more quickly. |
