image

Flow Meter Market Report Scope & Overview:

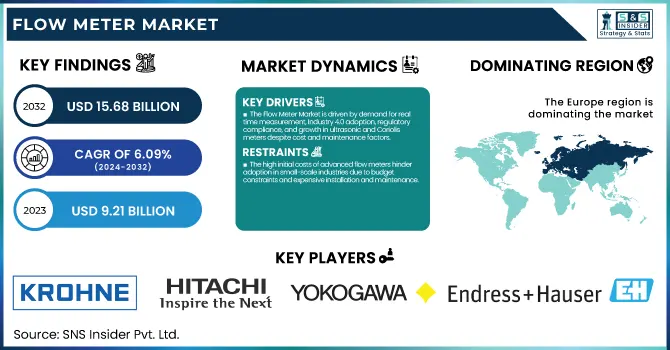
The Flow Meter Market was estimated at USD 9.21 billion in 2023 and is expected to reach USD 15.68 billion by 2032, with a growing CAGR of 6.09% over the forecast period 2024-2032. This report provides an in-depth analysis of flow meter utilization across industries and regions, highlighting operational efficiency trends. It examines maintenance and downtime metrics, offering insights into reliability and performance optimization. The study explores technological adoption trends, emphasizing the rise of smart flow meters and wireless monitoring systems. Additionally, it includes export/import data, tracking global trade flows, and supply chain shifts. A unique aspect is the coverage of real-time monitoring advancements, regulatory compliance trends, and the impact of sustainability initiatives shaping the future of flow measurement technologies.

The U.S. Flow Meter Market is projected to grow steadily, with a CAGR of 6.16% from 2023 to 2032. The market value is expected to increase from USD 1.21 billion in 2023 to USD 2.07 billion in 2032, driven by rising demand across industries such as oil & gas, water & wastewater, and power generation. The adoption of smart flow meters with IoT and AI integration is accelerating, enhancing real-time monitoring and operational efficiency. Additionally, stringent regulatory policies on environmental compliance and industrial automation advancements are fueling market expansion. The U.S. remains the dominant market in North America, contributing significantly to regional growth.

Market Dynamics

Drivers

  • The Flow Meter Market is driven by demand for real-time measurement, Industry 4.0 adoption, regulatory compliance, and growth in ultrasonic and Coriolis meters despite cost and maintenance factors.

The Flow Meter Market is witnessing significant growth due to the rising demand for accurate and real-time flow measurement across industries such as oil & gas, water & wastewater, and chemicals. These sectors require accurate monitoring to improve process efficiency, minimize consumption, and meet strict regulatory standards. Smart and digital flow meters are becoming increasingly popular via industrial automation and the Internet of Things (IoT)in the new era of "Industry 4.0". Furthermore, a shift towards ultrasonic as well as Coriolis-type flowmeters is gaining more and more hold on account of them having increasingly higher measuring precision. The water and wastewater sector makes a major contribution to market expansion, driven by industry-wide attention to water resource conservation and comprehensive planning. Also, sustainability and green monitoring of the environment create further business opportunities. But, barriers such as high initial investment costs and ongoing maintenance complexity could slow down growth in certain areas.

Restraint

  • The high initial costs of advanced flow meters hinder adoption in small-scale industries due to budget constraints and expensive installation and maintenance.

The high initial costs of advanced flow meters, such as Coriolis, ultrasonic, and electromagnetic types, pose a significant barrier to adoption, especially for small-scale industries. These flow meters offer high accuracy, reliability, and advanced features like IoT integration and real-time monitoring, but their expensive sensors, sophisticated electronics, and calibration requirements drive up costs. Small and medium-sized enterprises (SMEs) operating on limited budgets often struggle to justify these investments, opting instead for lower-cost alternatives like mechanical or turbine flow meters, despite their lower precision. Adding installation and maintenance these days, however, results in a package that's expensive to run. While technological advancements may lead to cost reductions over time, the current price-sensitive nature of small businesses continues to hinder the widespread adoption of high-end flow measurement solutions.

Opportunities

  • The growth of renewable energy projects drives demand for precise flow meters to enhance efficiency, safety, and real-time monitoring.

The expansion of renewable energy projects is driving the demand for accurate flow measurement solutions across various applications, from hydropower to biofuels, geothermal energy to hydrogen production. Precise flow monitoring helps optimize efficiency while minimizing waste and ensuring compliance with regulatory requirements. In hydrogen production, for example, flow meters are used to regulate gas flow rates to increase safety and efficiency. Likewise, solar thermal and even geothermal power plants, where heat transfer fluids need to be handled perfectly, indicate the importance of flow measurement. With tightening clean energy spending by governments everywhere, the demand for pumps and systems will have to include more sophisticated flow meters, including various types of Coriolis, ultrasonic, and magnetic. Moreover, the growing popularity of smart grids and digital surveillance, IoT, and AI-integrated flow meters is catching up as well. They assist in real-time data analysis, remote monitoring, and predictive maintenance, increasing operational efficiency in renewable energy projects. The upcoming developments are anticipated to provide potential opportunities for the flow meter market growth.

Challenges

  • Supply chain disruptions in the Flow Meter Market have led to raw material shortages, increased costs, and production delays, impacting global supply and pricing.

Supply chain disruptions have significantly impacted the Flow Meter Market, affecting both raw material availability and production cycles. Key materials like stainless steel, aluminum, or electronic elements that are used to manufacture flow meters in recent times have been impacted by the ongoing geopolitical issues, trade restrictions, and certain logistics bottlenecks. In particular, semiconductor shortages have hampered the growth of smart and digital flowmeters, and as a result, equipment lead times have lengthened for end-users' foremen at the back end of the chain. Meanwhile, higher transportation costs and labor shortfalls have squeezed supply chains worldwide, leading producers to hike prices or postpone shipments. Now companies are adapting by working on localized sourcing, trading with diverse suppliers , and best inventory management to mitigate risks. But extend those disruptions and markets may suffer, particularly in regions that are sensitive to prices. Overcoming these challenges would require long-term strategic planning, digital transformation, and strengthening of supply chains to sustain production and timely delivery.

Segmentation Analysis

By Product

The Magnetic segment dominated with a market share of over 32% in 2023, due to its extensive application in industries such as water & wastewater, chemicals, and food & beverage. Electromagnetic types of flow meters are popular due to their accuracy, long life, and low maintenance. Magnetic flow meters have no moving parts, unlike mechanical alternatives, which means no wear and tear and a longer operational lifetime. They are perfect for applications where flow conditions change frequently due to their capability to measure conductive fluids in an unobstructed way. Moreover, strict regulations enforced by the regulatory authorities in water management and process industries for accurate flow measurement contribute to the high market share of magnetic flow meters globally.

By Type

The battery-powered segment dominated with a market share of over 48% in 2023, owing to their widespread application in major end-user industries, including oil & gas, water & wastewater, and chemical processing. They are popular because of their excellent reliability, long life, and operation without external power. These flow meters are especially beneficial in remote areas without access to a continuous power supply, as they guarantee continuous flow measurement without interruptions, which is useful for fluid measurement. Further, the development of battery technology has made them more efficient, requiring less maintenance and higher penetration into different sectors. This, coupled with their versatility and working in different rough environments, further strengthens their foothold in the market , making them the ideal and most sought-after type of flow meter in industries and commercial applications.

By Application

The power generation segment dominated with a market share of over 34% in 2023, due to its critical role in monitoring and optimizing fluid flow in power plants. For efficient energy generation, accurate control of steam, water, and fuel consumption is key, since that can only be accomplished when steam/water/fuel flow is measured exactly. Flow meters, in turn, are used in thermal, nuclear, hydro, and renewable power plants to improve operational efficiencies, reduce energy losses, and meet strict environmental regulations. This growth is driven by the growing electricity demand and the need for an advanced monitoring system in power plants, resulting in the dominance of this segment. Moreover, the ever-progressing technology, for instance, ultrasonic and Coriolis flow meters, ensures enhanced precision and reliability, which makes them crucial for global power generation applications.

By Size

The 2-inch pipe size segment dominated with a market share of over 43% in 2023, due to its extensive use across key industries such as water & wastewater, oil & gas, and chemicals. This segment accounts for the majority share owing to its use in various industrial and commercial applications where moderate flow measurement is required. The 2-inch is the most popular size, as it is economical, versatile, and easy to install for process monitoring, fluid control, and energy management applications. The increasing infrastructure is also one of the factors driving the adoption of the market, along with regulations on the fluid measurement accuracy and the need for effective management of resources. This is largely due to continuing industrial growth and upgrades to pipeline infrastructure in multiple sectors.

Regional Analysis

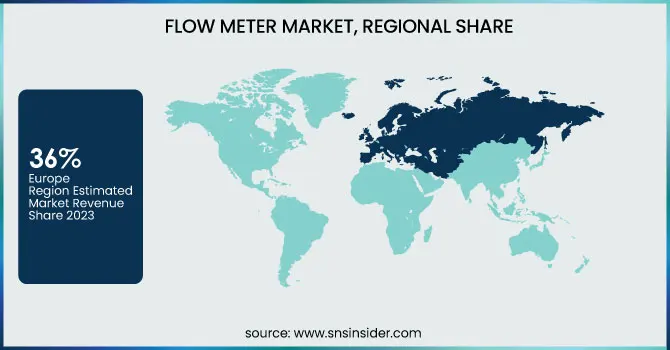
The Europe region dominated with a market share of over 36% in 2023, mainly because of stringent environmental regulations in the region and the increasing demand for high-precision and smart flow meters for monitoring and compliance. Demand has also been boosted further due to the presence of industries such as water & wastewater, among others, rather than more oil & gas & chemicals, as the region possesses an industrial automation-oriented nature. European manufacturers are also equipped with sophisticated production expertise, which results in lucrative benefits in providing new-generation flow meters that involve high-efficiency and energy-efficient aspects. Moreover, the  availability of the leading market players keeps bringing innovation in the digitalization and IoT-based flow measurement solutions. However, steady patent policies promoting optimization of resource usage are further endorsing Europe as the world leader in the Flow Meter Market.

Asia-Pacific is the fastest-growing region in the Flow Meter Market, due to rapid industrialization, urbanization, and government initiatives to meet increased energy efficiency demands from industries and utilities to reduce wastage, along with the increasing demand for smart flow meters in key economies, including China, India, and Japan. This is being driven by the growing oil & gas, water & wastewater, and power generation industries. Continued infrastructural projects by governments in the region and their investment in advanced water management systems are expected to further drive the need for precise and efficient flow measurement solutions. Moreover, high adoption of smart manufacturing and IoT-based flow meters is driving their industrial applicability in making operational processes smoother. Asia-Pacific represents the most dynamic region in terms of future growth as industries gradually switch to advanced flow metering technologies, thanks to stringent environmental regulations and a greater emphasis on sustainability.

Key Players

  • Krohne Messtechnik GmbH (Magnetic, Ultrasonic, Coriolis, Vortex)

  • Hitachi High-Tech Corporation (Ultrasonic, Coriolis, Magnetic)

  • Yokogawa Electric Corporation (Differential Pressure, Coriolis, Magnetic, Vortex)

  • General Electric (GE) (Ultrasonic, Turbine, Coriolis)

  • HÖNTZSCH GMBH & CO. KG (Vortex, Ultrasonic, Turbine)

  • Emerson Electric Corporation (Coriolis, Magnetic, Ultrasonic, Differential Pressure)

  • Endress+Hausar AG (Coriolis, Magnetic, Vortex, Ultrasonic)

  • Siemens (Magnetic, Ultrasonic, Differential Pressure)

  • ABB Ltd. (Coriolis, Magnetic, Vortex, Ultrasonic)

  • Honeywell International Inc. (Differential Pressure, Ultrasonic, Coriolis)

  • em-tec GmbH (Ultrasonic, Non-invasive Flow Meters)

  • Badger Meter, Inc. (Positive Displacement, Magnetic, Ultrasonic)

  • Bronkhorst High-Tech B.V. (Coriolis, Thermal Mass Flow Meters)

  • Schneider Electric (Magnetic, Ultrasonic, Vortex)

  • OMEGA Engineering, Inc. (Turbine, Vortex, Magnetic)

  • SICK AG (Ultrasonic, Vortex, Coriolis)

  • Fuji Electric Co., Ltd. (Ultrasonic, Magnetic, Vortex)

  • Azbil Corporation (Differential Pressure, Vortex, Ultrasonic)

  • McCrometer, Inc. (Magnetic, Vortex, Propeller Flow Meters)

  • Toshiba Corporation (Magnetic, Ultrasonic, Vortex)

Suppliers for (High-precision electromagnetic and Coriolis flow meters) on the Flow Meter Market

  • ABB Ltd.

  • Emerson Electric Corporation

  • Endress+Hauser AG

  • Siemens

  • Yokogawa Electric Corporation

  • Honeywell International Inc.

  • Krohne Messtechnik GmbH

  • HÖNTZSCH GMBH & CO. KG

  • Badger Meter, Inc.

  • Fuji Electric Co., Ltd.

Recent Development

  • In 2024, ABB launched the AquaMaster4 Mobile, a battery-powered electromagnetic flow meter designed for remote water distribution monitoring. This innovation provides utilities with greater flexibility in measuring flow rates across their networks.

  • In 2024, Endress+Hauser and Siemens partnered to develop smart flow measurement solutions for the process industry. By combining flow measurement expertise with automation and digitalization, they aim to create advanced flow meters with improved connectivity and data analytics. These innovations will enhance efficiency, real-time monitoring, and data-driven decision-making for Industry 4.0 applications.

Flow Meter Market Report Scope:

Report Attributes Details
Market Size in 2023 USD 9.21 Billion
Market Size by 2032 USD 15.68 Billion
CAGR CAGR of 6.09% From 2024 to 2032
Base Year 2023
Forecast Period 2024-2032
Historical Data 2020-2022
Report Scope & Coverage Market Size, Segments Analysis, Competitive  Landscape, Regional Analysis, DROC & SWOT Analysis, Forecast Outlook
Key Segments • By Product (Differential Pressure (DP), Positive Displacement (PD), Magnetic (Wired, Wireless), Ultrasonic, Coriolis, Turbine, Vortex, Others)
• By Type (Electric, Solar, Battery Powered)
• By Application (Water & Wastewater, Oil & Gas, Chemicals, Power Generation, Pulp & Paper, Food & Beverage, Others)
• By Size (Pipe Size (2 inches, 4 inches, 6 inches, More than 6 inches))
Regional Analysis/Coverage North America (US, Canada, Mexico), Europe (Eastern Europe [Poland, Romania, Hungary, Turkey, Rest of Eastern Europe] Western Europe] Germany, France, UK, Italy, Spain, Netherlands, Switzerland, Austria, Rest of Western Europe]), Asia Pacific (China, India, Japan, South Korea, Vietnam, Singapore, Australia, Rest of Asia Pacific), Middle East & Africa (Middle East [UAE, Egypt, Saudi Arabia, Qatar, Rest of Middle East], Africa [Nigeria, South Africa, Rest of Africa], Latin America (Brazil, Argentina, Colombia, Rest of Latin America)
Company Profiles Krohne Messtechnik GmbH, Hitachi High-Tech Corporation, Yokogawa Electric Corporation, General Electric, HÖNTZSCH GMBH & CO. KG, Emerson Electric Corporation, Endress+Hausar AG, Siemens, ABB Ltd., Honeywell International Inc., em-tec GmbH, Badger Meter, Inc., Bronkhorst High-Tech B.V., Schneider Electric, OMEGA Engineering, Inc., SICK AG, Fuji Electric Co., Ltd., Azbil Corporation, McCrometer, Inc., Toshiba Corporation.

Frequently Asked Questions

Ans:  The Flow Meter Market is expected to grow at a CAGR of 6.09% during 2024-2032.

Ans: The Flow Meter Market was USD 9.21 billion in 2023 and is expected to reach USD 15.68 billion by 2032.

Ans: The Flow Meter Market is driven by demand for real-time measurement, Industry 4.0 adoption, regulatory compliance, and growth in ultrasonic and Coriolis meters despite cost and maintenance factors.

Ans: The “Magnetic” segment dominated the Flow Meter Market.

Ans: Europe dominated the Flow Meter Market in 2023.

Table of Contents

1. Introduction

1.1 Market Definition

1.2 Scope (Inclusion and Exclusions)

1.3 Research Assumptions

2. Executive Summary

2.1 Market Overview

2.2 Regional Synopsis

2.3 Competitive Summary

3. Research Methodology

3.1 Top-Down Approach

3.2 Bottom-up Approach

3.3. Data Validation

3.4 Primary Interviews

4. Market Dynamics Impact Analysis

4.1 Market Driving Factors Analysis

4.1.1 Drivers

4.1.2 Restraints

4.1.3 Opportunities

4.1.4 Challenges

4.2 PESTLE Analysis

4.3 Porter’s Five Forces Model

5. Statistical Insights and Trends Reporting

5.1 Flow Meter Utilization Rates, by Industry and Region (2020-2023)

5.2 Maintenance and Downtime Metrics for Flow Meters

5.3 Technological Adoption Trends in the Flow Meter Market, by Region

5.4 Export/Import Data for Flow Meters, by Region (2023)

6. Competitive Landscape

6.1 List of Major Companies, By Region

6.2 Market Share Analysis, By Region

6.3 Product Benchmarking

6.3.1 Product specifications and features

6.3.2 Pricing

6.4 Strategic Initiatives

6.4.1 Marketing and promotional activities

6.4.2 Distribution and supply chain strategies

6.4.3 Expansion plans and new product launches

6.4.4 Strategic partnerships and collaborations

6.5 Technological Advancements

6.6 Market Positioning and Branding

7. Flow Meter Market Segmentation, By Product

7.1 Chapter Overview

7.2 Differential Pressure (DP)

7.2.1 Differential Pressure (DP) Market Trends Analysis (2020-2032)

7.2.2 Differential Pressure (DP) Market Size Estimates and Forecasts to 2032 (USD Billion)

7.3 Positive Displacement (PD)

7.3.1 Positive Displacement (PD) Market Trends Analysis (2020-2032)

7.3.2 Positive Displacement (PD) Market Size Estimates and Forecasts to 2032 (USD Billion)

7.4 Magnetic

7.4.1 Magnetic Market Trends Analysis (2020-2032)

7.4.2 Magnetic Market Size Estimates and Forecasts to 2032 (USD Billion)

7.4.3 Wired

7.4.3.1 Wired Market Trends Analysis (2020-2032)

7.4.3.2 Wired Market Size Estimates and Forecasts to 2032 (USD Billion)

7.4.4 Wireless

7.4.4.1 Wireless Market Trends Analysis (2020-2032)

7.4.4.2 Wireless Market Size Estimates and Forecasts to 2032 (USD Billion)

7.5 Ultrasonic

7.5.1 Ultrasonic Market Trends Analysis (2020-2032)

7.5.2 Ultrasonic Market Size Estimates and Forecasts to 2032 (USD Billion)

7.6 Coriolis

7.6.1 Coriolis Market Trends Analysis (2020-2032)

7.6.2 Coriolis Market Size Estimates and Forecasts to 2032 (USD Billion)

7.7 Turbine

7.7.1 Turbine Market Trends Analysis (2020-2032)

7.7.2 Turbine Market Size Estimates and Forecasts to 2032 (USD Billion)

7.8 Vortex

7.8.1 Vortex Market Trends Analysis (2020-2032)

7.8.2 Vortex Market Size Estimates and Forecasts to 2032 (USD Billion)

7.9 Others

7.9.1 Others Market Trends Analysis (2020-2032)

7.9.2 Others Market Size Estimates and Forecasts to 2032 (USD Billion)

8. Flow Meter Market Segmentation, By Type

8.1 Chapter Overview

8.2 Electric

8.2.1 Electric Market Trends Analysis (2020-2032)

8.2.2 Electric Market Size Estimates and Forecasts to 2032 (USD Billion)

 8.3 Solar

8.3.1 Solar Market Trends Analysis (2020-2032)

8.3.2 Solar Market Size Estimates and Forecasts to 2032 (USD Billion)

8.4 Battery Powered

8.4.1 Battery-Powered Market Trends Analysis (2020-2032)

8.4.2 Battery-Powered Market Size Estimates and Forecasts to 2032 (USD Billion)

9. Flow Meter Market Segmentation, By Application

9.1 Chapter Overview

9.2 Water & Wastewater

9.2.1 Water & Wastewater Market Trends Analysis (2020-2032)

9.2.2 Water & Wastewater Market Size Estimates and Forecasts to 2032 (USD Billion)

9.3 Oil & Gas

9.3.1 Oil & Gas Market Trends Analysis (2020-2032)

9.3.2 Oil & Gas Market Size Estimates and Forecasts to 2032 (USD Billion)

9.4 Chemicals

9.4.1 Chemicals Market Trends Analysis (2020-2032)

9.4.2 Chemicals Market Size Estimates and Forecasts to 2032 (USD Billion)

9.5 Power Generation

9.5.1 Power Generation Market Trends Analysis (2020-2032)

9.5.2 Power Generation Market Size Estimates and Forecasts to 2032 (USD Billion)

9.6 Pulp & Paper

9.6.1 Pulp & Paper Market Trends Analysis (2020-2032)

9.6.2 Pulp & Paper Market Size Estimates and Forecasts to 2032 (USD Billion)

9.7 Food & Beverage

9.7.1 Food & Beverage Market Trends Analysis (2020-2032)

9.7.2 Food & Beverage Market Size Estimates and Forecasts to 2032 (USD Billion)

9.8 Others

9.8.1 Other Market Trends Analysis (2020-2032)

9.8.2 Others Market Size Estimates and Forecasts to 2032 (USD Billion)

10. Flow Meter Market Segmentation, By Size

10.1 Chapter Overview

10.2 Pipe Size

10.2.1 Pipe Size Market Trends Analysis (2020-2032)

10.2.2 Pipe Size Market Size Estimates and Forecasts to 2032 (USD Billion)

10.3 2 inches

10.3.1 2 inches Market Trends Analysis (2020-2032)

10.3.2 2 inches Market Size Estimates and Forecasts to 2032 (USD Billion)

10.4 4 inches

10.4.1 4 inches Market Trends Analysis (2020-2032)

10.4.2 4 inches Market Size Estimates and Forecasts to 2032 (USD Billion)

10.5 6 inches

10.5.1 6 inches Market Trends Analysis (2020-2032)

10.5.2 6 inches Market Size Estimates and Forecasts to 2032 (USD Billion)

10.6 More than 6 inches

10.6.1 More than 6 inches Market Trends Analysis (2020-2032)

10.6.2 More than 6 inches Market Size Estimates and Forecasts to 2032 (USD Billion)

11. Regional Analysis

11.1 Chapter Overview

11.2 North America

11.2.1 Trends Analysis

11.2.2 North America Flow Meter Market Estimates and Forecasts, by Country (2020-2032) (USD Billion)

11.2.3 North America Flow Meter Market Estimates and Forecasts, By Product (2020-2032) (USD Billion) 

11.2.4 North America Flow Meter Market Estimates and Forecasts, By Type (2020-2032) (USD Billion)

11.2.5 North America Flow Meter Market Estimates and Forecasts, By Application (2020-2032) (USD Billion)

11.2.6 North America Flow Meter Market Estimates and Forecasts, By Size (2020-2032) (USD Billion)

11.2.7 USA

11.2.7.1 USA Flow Meter Market Estimates and Forecasts, By Product (2020-2032) (USD Billion)

11.2.7.2 USA Flow Meter Market Estimates and Forecasts, By Type (2020-2032) (USD Billion)

11.2.7.3 USA Flow Meter Market Estimates and Forecasts, By Application (2020-2032) (USD Billion)

11.2.7.4 USA Flow Meter Market Estimates and Forecasts, By Size (2020-2032) (USD Billion)

11.2.8 Canada

11.2.8.1 Canada Flow Meter Market Estimates and Forecasts, By Product (2020-2032) (USD Billion)

11.2.8.2 Canada Flow Meter Market Estimates and Forecasts, By Type (2020-2032) (USD Billion)

11.2.8.3 Canada Flow Meter Market Estimates and Forecasts, By Application (2020-2032) (USD Billion)

11.2.8.4 Canada Flow Meter Market Estimates and Forecasts, By Size (2020-2032) (USD Billion)

11.2.9 Mexico

11.2.9.1 Mexico Flow Meter Market Estimates and Forecasts, By Product (2020-2032) (USD Billion)

11.2.9.2 Mexico Flow Meter Market Estimates and Forecasts, By Type (2020-2032) (USD Billion)

11.2.9.3 Mexico Flow Meter Market Estimates and Forecasts, By Application (2020-2032) (USD Billion)

11.2.9.4 Mexico Flow Meter Market Estimates and Forecasts, By Size (2020-2032) (USD Billion)

11.3 Europe

11.3.1 Eastern Europe

11.3.1.1 Trends Analysis

11.3.1.2 Eastern Europe Flow Meter Market Estimates and Forecasts, by Country (2020-2032) (USD Billion)

11.3.1.3 Eastern Europe Flow Meter Market Estimates and Forecasts, By Product (2020-2032) (USD Billion) 

11.3.1.4 Eastern Europe Flow Meter Market Estimates and Forecasts, By Type (2020-2032) (USD Billion)

11.3.1.5 Eastern Europe Flow Meter Market Estimates and Forecasts, By Application (2020-2032) (USD Billion)

11.3.1.6 Eastern Europe Flow Meter Market Estimates and Forecasts, By Size (2020-2032) (USD Billion)

11.3.1.7 Poland

11.3.1.7.1 Poland Flow Meter Market Estimates and Forecasts, By Product (2020-2032) (USD Billion)

11.3.1.7.2 Poland Flow Meter Market Estimates and Forecasts, By Type (2020-2032) (USD Billion)

11.3.1.7.3 Poland Flow Meter Market Estimates and Forecasts, By Application (2020-2032) (USD Billion)

11.3.1.7.4 Poland Flow Meter Market Estimates and Forecasts, By Size (2020-2032) (USD Billion)

11.3.1.8 Romania

11.3.1.8.1 Romania Flow Meter Market Estimates and Forecasts, By Product (2020-2032) (USD Billion)

11.3.1.8.2 Romania Flow Meter Market Estimates and Forecasts, By Type (2020-2032) (USD Billion)

11.3.1.8.3 Romania Flow Meter Market Estimates and Forecasts, By Application (2020-2032) (USD Billion)

11.3.1.8.4 Romania Flow Meter Market Estimates and Forecasts, By Size (2020-2032) (USD Billion)

11.3.1.9 Hungary

11.3.1.9.1 Hungary Flow Meter Market Estimates and Forecasts, By Product (2020-2032) (USD Billion)

11.3.1.9.2 Hungary Flow Meter Market Estimates and Forecasts, By Type (2020-2032) (USD Billion)

11.3.1.9.3 Hungary Flow Meter Market Estimates and Forecasts, By Application (2020-2032) (USD Billion)

11.3.1.9.4 Hungary Flow Meter Market Estimates and Forecasts, By Size (2020-2032) (USD Billion)

11.3.1.10 Turkey

11.3.1.10.1 Turkey Flow Meter Market Estimates and Forecasts, By Product (2020-2032) (USD Billion)

11.3.1.10.2 Turkey Flow Meter Market Estimates and Forecasts, By Type (2020-2032) (USD Billion)

11.3.1.10.3 Turkey Flow Meter Market Estimates and Forecasts, By Application (2020-2032) (USD Billion)

11.3.1.10.4 Turkey Flow Meter Market Estimates and Forecasts, By Size (2020-2032) (USD Billion)

11.3.1.11 Rest of Eastern Europe

11.3.1.11.1 Rest of Eastern Europe Flow Meter Market Estimates and Forecasts, By Product (2020-2032) (USD Billion)

11.3.1.11.2 Rest of Eastern Europe Flow Meter Market Estimates and Forecasts, By Type (2020-2032) (USD Billion)

11.3.1.11.3 Rest of Eastern Europe Flow Meter Market Estimates and Forecasts, By Application (2020-2032) (USD Billion)

11.3.1.11.4 Rest of Eastern Europe Flow Meter Market Estimates and Forecasts, By Size (2020-2032) (USD Billion)

11.3.2 Western Europe

11.3.2.1 Trends Analysis

11.3.2.2 Western Europe Flow Meter Market Estimates and Forecasts, by Country (2020-2032) (USD Billion)

11.3.2.3 Western Europe Flow Meter Market Estimates and Forecasts, By Product (2020-2032) (USD Billion) 

11.3.2.4 Western Europe Flow Meter Market Estimates and Forecasts, By Type (2020-2032) (USD Billion)

11.3.2.5 Western Europe Flow Meter Market Estimates and Forecasts, By Application (2020-2032) (USD Billion)

11.3.2.6 Western Europe Flow Meter Market Estimates and Forecasts, By Size (2020-2032) (USD Billion)

11.3.2.7 Germany

11.3.2.7.1 Germany Flow Meter Market Estimates and Forecasts, By Product (2020-2032) (USD Billion)

11.3.2.7.2 Germany Flow Meter Market Estimates and Forecasts, By Type (2020-2032) (USD Billion)

11.3.2.7.3 Germany Flow Meter Market Estimates and Forecasts, By Application (2020-2032) (USD Billion)

11.3.2.7.4 Germany Flow Meter Market Estimates and Forecasts, By Size (2020-2032) (USD Billion)

11.3.2.8 France

11.3.2.8.1 France Flow Meter Market Estimates and Forecasts, By Product (2020-2032) (USD Billion)

11.3.2.8.2 France Flow Meter Market Estimates and Forecasts, By Type (2020-2032) (USD Billion)

11.3.2.8.3 France Flow Meter Market Estimates and Forecasts, By Application (2020-2032) (USD Billion)

11.3.2.8.4 France Flow Meter Market Estimates and Forecasts, By Size (2020-2032) (USD Billion)

11.3.2.9 UK

11.3.2.9.1 UK Flow Meter Market Estimates and Forecasts, By Product (2020-2032) (USD Billion)

11.3.2.9.2 UK Flow Meter Market Estimates and Forecasts, By Type (2020-2032) (USD Billion)

11.3.2.9.3 UK Flow Meter Market Estimates and Forecasts, By Application (2020-2032) (USD Billion)

11.3.2.9.4 UK Flow Meter Market Estimates and Forecasts, By Size (2020-2032) (USD Billion)

11.3.2.10 Italy

11.3.2.10.1 Italy Flow Meter Market Estimates and Forecasts, By Product (2020-2032) (USD Billion)

11.3.2.10.2 Italy Flow Meter Market Estimates and Forecasts, By Type (2020-2032) (USD Billion)

11.3.2.10.3 Italy Flow Meter Market Estimates and Forecasts, By Application (2020-2032) (USD Billion)

11.3.2.10.4 Italy Flow Meter Market Estimates and Forecasts, By Size (2020-2032) (USD Billion)

11.3.2.11 Spain

11.3.2.11.1 Spain Flow Meter Market Estimates and Forecasts, By Product (2020-2032) (USD Billion)

11.3.2.11.2 Spain Flow Meter Market Estimates and Forecasts, By Type (2020-2032) (USD Billion)

11.3.2.11.3 Spain Flow Meter Market Estimates and Forecasts, By Application (2020-2032) (USD Billion)

11.3.2.11.4 Spain Flow Meter Market Estimates and Forecasts, By Size (2020-2032) (USD Billion)

11.3.2.12 Netherlands

11.3.2.12.1 Netherlands Flow Meter Market Estimates and Forecasts, By Product (2020-2032) (USD Billion)

11.3.2.12.2 Netherlands Flow Meter Market Estimates and Forecasts, By Type (2020-2032) (USD Billion)

11.3.2.12.3 Netherlands Flow Meter Market Estimates and Forecasts, By Application (2020-2032) (USD Billion)

11.3.2.12.4 Netherlands Flow Meter Market Estimates and Forecasts, By Size (2020-2032) (USD Billion)

11.3.2.13 Switzerland

11.3.2.13.1 Switzerland Flow Meter Market Estimates and Forecasts, By Product (2020-2032) (USD Billion)

11.3.2.13.2 Switzerland Flow Meter Market Estimates and Forecasts, By Type (2020-2032) (USD Billion)

11.3.2.13.3 Switzerland Flow Meter Market Estimates and Forecasts, By Application (2020-2032) (USD Billion)

11.3.2.13.4 Switzerland Flow Meter Market Estimates and Forecasts, By Size (2020-2032) (USD Billion)

11.3.2.14 Austria

11.3.2.14.1 Austria Flow Meter Market Estimates and Forecasts, By Product (2020-2032) (USD Billion)

11.3.2.14.2 Austria Flow Meter Market Estimates and Forecasts, By Type (2020-2032) (USD Billion)

11.3.2.14.3 Austria Flow Meter Market Estimates and Forecasts, By Application (2020-2032) (USD Billion)

11.3.2.14.4 Austria Flow Meter Market Estimates and Forecasts, By Size (2020-2032) (USD Billion)

11.3.2.15 Rest of Western Europe

11.3.2.15.1 Rest of Western Europe Flow Meter Market Estimates and Forecasts, By Product (2020-2032) (USD Billion)

11.3.2.15.2 Rest of Western Europe Flow Meter Market Estimates and Forecasts, By Type (2020-2032) (USD Billion)

11.3.2.15.3 Rest of Western Europe Flow Meter Market Estimates and Forecasts, By Application (2020-2032) (USD Billion)

11.3.2.15.4 Rest of Western Europe Flow Meter Market Estimates and Forecasts, By Size (2020-2032) (USD Billion)

11.4 Asia Pacific

11.4.1 Trends Analysis

11.4.2 Asia Pacific Flow Meter Market Estimates and Forecasts, by Country (2020-2032) (USD Billion)

11.4.3 Asia Pacific Flow Meter Market Estimates and Forecasts, By Product (2020-2032) (USD Billion) 

11.4.4 Asia Pacific Flow Meter Market Estimates and Forecasts, By Type (2020-2032) (USD Billion)

11.4.5 Asia Pacific Flow Meter Market Estimates and Forecasts, By Application (2020-2032) (USD Billion)

11.4.6 Asia Pacific Flow Meter Market Estimates and Forecasts, By Size (2020-2032) (USD Billion)

11.4.7 China

11.4.7.1 China Flow Meter Market Estimates and Forecasts, By Product (2020-2032) (USD Billion)

11.4.7.2 China Flow Meter Market Estimates and Forecasts, By Type (2020-2032) (USD Billion)

11.4.7.3 China Flow Meter Market Estimates and Forecasts, By Application (2020-2032) (USD Billion)

11.4.7.4 China Flow Meter Market Estimates and Forecasts, By Size (2020-2032) (USD Billion)

11.4.8 India

11.4.8.1 India Flow Meter Market Estimates and Forecasts, By Product (2020-2032) (USD Billion)

11.4.8.2 India Flow Meter Market Estimates and Forecasts, By Type (2020-2032) (USD Billion)

11.4.8.3 India Flow Meter Market Estimates and Forecasts, By Application (2020-2032) (USD Billion)

11.4.8.4 India Flow Meter Market Estimates and Forecasts, By Size (2020-2032) (USD Billion)

11.4.9 Japan

11.4.9.1 Japan Flow Meter Market Estimates and Forecasts, By Product (2020-2032) (USD Billion)

11.4.9.2 Japan Flow Meter Market Estimates and Forecasts, By Type (2020-2032) (USD Billion)

11.4.9.3 Japan Flow Meter Market Estimates and Forecasts, By Application (2020-2032) (USD Billion)

11.4.9.4 Japan Flow Meter Market Estimates and Forecasts, By Size (2020-2032) (USD Billion)

11.4.10 South Korea

11.4.10.1 South Korea Flow Meter Market Estimates and Forecasts, By Product (2020-2032) (USD Billion)

11.4.10.2 South Korea Flow Meter Market Estimates and Forecasts, By Type (2020-2032) (USD Billion)

11.4.10.3 South Korea Flow Meter Market Estimates and Forecasts, By Application (2020-2032) (USD Billion)

11.4.10.4 South Korea Flow Meter Market Estimates and Forecasts, By Size (2020-2032) (USD Billion)

11.4.11 Vietnam

11.4.11.1 Vietnam Flow Meter Market Estimates and Forecasts, By Product (2020-2032) (USD Billion)

11.4.11.2 Vietnam Flow Meter Market Estimates and Forecasts, By Type (2020-2032) (USD Billion)

11.4.11.3 Vietnam Flow Meter Market Estimates and Forecasts, By Application (2020-2032) (USD Billion)

11.4.11.4 Vietnam Flow Meter Market Estimates and Forecasts, By Size (2020-2032) (USD Billion)

11.4.12 Singapore

11.4.12.1 Singapore Flow Meter Market Estimates and Forecasts, By Product (2020-2032) (USD Billion)

11.4.12.2 Singapore Flow Meter Market Estimates and Forecasts, By Type (2020-2032) (USD Billion)

11.4.12.3 Singapore Flow Meter Market Estimates and Forecasts, By Application (2020-2032) (USD Billion)

11.4.12.4 Singapore Flow Meter Market Estimates and Forecasts, By Size (2020-2032) (USD Billion)

11.4.13 Australia

11.4.13.1 Australia Flow Meter Market Estimates and Forecasts, By Product (2020-2032) (USD Billion)

11.4.13.2 Australia Flow Meter Market Estimates and Forecasts, By Type (2020-2032) (USD Billion)

11.4.13.3 Australia Flow Meter Market Estimates and Forecasts, By Application (2020-2032) (USD Billion)

11.4.13.4 Australia Flow Meter Market Estimates and Forecasts, By Size (2020-2032) (USD Billion)

11.4.14 Rest of Asia Pacific

11.4.14.1 Rest of Asia Pacific Flow Meter Market Estimates and Forecasts, By Product (2020-2032) (USD Billion)

11.4.14.2 Rest of Asia Pacific Flow Meter Market Estimates and Forecasts, By Type (2020-2032) (USD Billion)

11.4.14.3 Rest of Asia Pacific Flow Meter Market Estimates and Forecasts, By Application (2020-2032) (USD Billion)

11.4.14.4 Rest of Asia Pacific Flow Meter Market Estimates and Forecasts, By Size (2020-2032) (USD Billion)

11.5 Middle East and Africa

11.5.1 Middle East

11.5.1.1 Trends Analysis

11.5.1.2 Middle East Flow Meter Market Estimates and Forecasts, by Country (2020-2032) (USD Billion)

11.5.1.3 Middle East Flow Meter Market Estimates and Forecasts, By Product (2020-2032) (USD Billion) 

11.5.1.4 Middle East Flow Meter Market Estimates and Forecasts, By Type (2020-2032) (USD Billion)

11.5.1.5 Middle East Flow Meter Market Estimates and Forecasts, By Application (2020-2032) (USD Billion)

11.5.1.6 Middle East Flow Meter Market Estimates and Forecasts, By Size (2020-2032) (USD Billion)

11.5.1.7 UAE

11.5.1.7.1 UAE Flow Meter Market Estimates and Forecasts, By Product (2020-2032) (USD Billion)

11.5.1.7.2 UAE Flow Meter Market Estimates and Forecasts, By Type (2020-2032) (USD Billion)

11.5.1.7.3 UAE Flow Meter Market Estimates and Forecasts, By Application (2020-2032) (USD Billion)

11.5.1.7.4 UAE Flow Meter Market Estimates and Forecasts, By Size (2020-2032) (USD Billion)

11.5.1.8 Egypt

11.5.1.8.1 Egypt Flow Meter Market Estimates and Forecasts, By Product (2020-2032) (USD Billion)

11.5.1.8.2 Egypt Flow Meter Market Estimates and Forecasts, By Type (2020-2032) (USD Billion)

11.5.1.8.3 Egypt Flow Meter Market Estimates and Forecasts, By Application (2020-2032) (USD Billion)

11.5.1.8.4 Egypt Flow Meter Market Estimates and Forecasts, By Size (2020-2032) (USD Billion)

11.5.1.9 Saudi Arabia

11.5.1.9.1 Saudi Arabia Flow Meter Market Estimates and Forecasts, By Product (2020-2032) (USD Billion)

11.5.1.9.2 Saudi Arabia Flow Meter Market Estimates and Forecasts, By Type (2020-2032) (USD Billion)

11.5.1.9.3 Saudi Arabia Flow Meter Market Estimates and Forecasts, By Application (2020-2032) (USD Billion)

11.5.1.9.4 Saudi Arabia Flow Meter Market Estimates and Forecasts, By Size (2020-2032) (USD Billion)

11.5.1.10 Qatar

11.5.1.10.1 Qatar Flow Meter Market Estimates and Forecasts, By Product (2020-2032) (USD Billion)

11.5.1.10.2 Qatar Flow Meter Market Estimates and Forecasts, By Type (2020-2032) (USD Billion)

11.5.1.10.3 Qatar Flow Meter Market Estimates and Forecasts, By Application (2020-2032) (USD Billion)

11.5.1.10.4 Qatar Flow Meter Market Estimates and Forecasts, By Size (2020-2032) (USD Billion)

11.5.1.11 Rest of Middle East

11.5.1.11.1 Rest of Middle East Flow Meter Market Estimates and Forecasts, By Product (2020-2032) (USD Billion)

11.5.1.11.2 Rest of Middle East Flow Meter Market Estimates and Forecasts, By Type (2020-2032) (USD Billion)

11.5.1.11.3 Rest of Middle East Flow Meter Market Estimates and Forecasts, By Application (2020-2032) (USD Billion)

11.5.1.11.4 Rest of Middle East Flow Meter Market Estimates and Forecasts, By Size (2020-2032) (USD Billion)

11.5.2 Africa

11.5.2.1 Trends Analysis

11.5.2.2 Africa Flow Meter Market Estimates and Forecasts, by Country (2020-2032) (USD Billion)

11.5.2.3 Africa Flow Meter Market Estimates and Forecasts, By Product (2020-2032) (USD Billion) 

11.5.2.4 Africa Flow Meter Market Estimates and Forecasts, By Type (2020-2032) (USD Billion)

11.5.2.5 Africa Flow Meter Market Estimates and Forecasts, By Application (2020-2032) (USD Billion)

11.5.2.6 Africa Flow Meter Market Estimates and Forecasts, By Size (2020-2032) (USD Billion)

11.5.2.7 South Africa

11.5.2.7.1 South Africa Flow Meter Market Estimates and Forecasts, By Product (2020-2032) (USD Billion)

11.5.2.7.2 South Africa Flow Meter Market Estimates and Forecasts, By Type (2020-2032) (USD Billion)

11.5.2.7.3 South Africa Flow Meter Market Estimates and Forecasts, By Application (2020-2032) (USD Billion)

11.5.2.7.4 South Africa Flow Meter Market Estimates and Forecasts, By Size (2020-2032) (USD Billion)

11.5.2.8 Nigeria

11.5.2.8.1 Nigeria Flow Meter Market Estimates and Forecasts, By Product (2020-2032) (USD Billion)

11.5.2.8.2 Nigeria Flow Meter Market Estimates and Forecasts, By Type (2020-2032) (USD Billion)

11.5.2.8.3 Nigeria Flow Meter Market Estimates and Forecasts, By Application (2020-2032) (USD Billion)

11.5.2.8.4 Nigeria Flow Meter Market Estimates and Forecasts, By Size (2020-2032) (USD Billion)

11.5.2.9 Rest of Africa

11.5.2.9.1 Rest of Africa Flow Meter Market Estimates and Forecasts, By Product (2020-2032) (USD Billion)

11.5.2.9.2 Rest of Africa Flow Meter Market Estimates and Forecasts, By Type (2020-2032) (USD Billion)

11.5.2.9.3 Rest of Africa Flow Meter Market Estimates and Forecasts, By Application (2020-2032) (USD Billion)

11.5.2.9.4 Rest of Africa Flow Meter Market Estimates and Forecasts, By Size (2020-2032) (USD Billion)

11.6 Latin America

11.6.1 Trends Analysis

11.6.2 Latin America Flow Meter Market Estimates and Forecasts, by Country (2020-2032) (USD Billion)

11.6.3 Latin America Flow Meter Market Estimates and Forecasts, By Product (2020-2032) (USD Billion) 

11.6.4 Latin America Flow Meter Market Estimates and Forecasts, By Type (2020-2032) (USD Billion)

11.6.5 Latin America Flow Meter Market Estimates and Forecasts, By Application (2020-2032) (USD Billion)

11.6.6 Latin America Flow Meter Market Estimates and Forecasts, By Size (2020-2032) (USD Billion)

11.6.7 Brazil

11.6.7.1 Brazil Flow Meter Market Estimates and Forecasts, By Product (2020-2032) (USD Billion)

11.6.7.2 Brazil Flow Meter Market Estimates and Forecasts, By Type (2020-2032) (USD Billion)

11.6.7.3 Brazil Flow Meter Market Estimates and Forecasts, By Application (2020-2032) (USD Billion)

11.6.7.4 Brazil Flow Meter Market Estimates and Forecasts, By Size (2020-2032) (USD Billion)

11.6.8 Argentina

11.6.8.1 Argentina Flow Meter Market Estimates and Forecasts, By Product (2020-2032) (USD Billion)

11.6.8.2 Argentina Flow Meter Market Estimates and Forecasts, By Type (2020-2032) (USD Billion)

11.6.8.3 Argentina Flow Meter Market Estimates and Forecasts, By Application (2020-2032) (USD Billion)

11.6.8.4 Argentina Flow Meter Market Estimates and Forecasts, By Size (2020-2032) (USD Billion)

11.6.9 Colombia

11.6.9.1 Colombia Flow Meter Market Estimates and Forecasts, By Product (2020-2032) (USD Billion)

11.6.9.2 Colombia Flow Meter Market Estimates and Forecasts, By Type (2020-2032) (USD Billion)

11.6.9.3 Colombia Flow Meter Market Estimates and Forecasts, By Application (2020-2032) (USD Billion)

11.6.9.4 Colombia Flow Meter Market Estimates and Forecasts, By Size (2020-2032) (USD Billion)

11.6.10 Rest of Latin America

11.6.10.1 Rest of Latin America Flow Meter Market Estimates and Forecasts, By Product (2020-2032) (USD Billion)

11.6.10.2 Rest of Latin America Flow Meter Market Estimates and Forecasts, By Type (2020-2032) (USD Billion)

11.6.10.3 Rest of Latin America Flow Meter Market Estimates and Forecasts, By Application (2020-2032) (USD Billion)

11.6.10.4 Rest of Latin America Flow Meter Market Estimates and Forecasts, By Size (2020-2032) (USD Billion)

12. Company Profiles

12.1 Krohne Messtechnik GmbH

12.1.1 Company Overview

12.1.2 Financial

12.1.3 Products/ Services Offered

12.1.4 SWOT Analysis

12.2 Hitachi High-Tech Corporation

12.2.1 Company Overview

12.2.2 Financial

12.2.3 Products/ Services Offered

12.2.4 SWOT Analysis

12.3 Yokogawa Electric Corporation

12.3.1 Company Overview

12.3.2 Financial

12.3.3 Products/ Services Offered

12.3.4 SWOT Analysis

12.4 General Electric

12.4.1 Company Overview

12.4.2 Financial

12.4.3 Products/ Services Offered

12.4.4 SWOT Analysis

12.5 HÖNTZSCH GMBH & CO. KG

12.5.1 Company Overview

12.5.2 Financial

12.5.3 Products/ Services Offered

12.5.4 SWOT Analysis

12.6 Emerson Electric Corporation

12.6.1 Company Overview

12.6.2 Financial

12.6.3 Products/ Services Offered

12.6.4 SWOT Analysis

12.7 Endress+Hausar AG

12.7.1 Company Overview

12.7.2 Financial

12.7.3 Products/ Services Offered

12.7.4 SWOT Analysis

12.8 Siemens

12.8.1 Company Overview

12.8.2 Financial

12.8.3 Products/ Services Offered

12.8.4 SWOT Analysis

12.9 ABB Ltd.

12.9.1 Company Overview

12.9.2 Financial

12.9.3 Products/ Services Offered

12.9.4 SWOT Analysis

12.10 Honeywell International Inc.

12.10.1 Company Overview

12.10.2 Financial

12.10.3 Products/ Services Offered

12.10.4 SWOT Analysis

13. Use Cases and Best Practices

14. Conclusion

An accurate research report requires proper strategizing as well as implementation. There are multiple factors involved in the completion of good and accurate research report and selecting the best methodology to compete the research is the toughest part. Since the research reports we provide play a crucial role in any company’s decision-making process, therefore we at SNS Insider always believe that we should choose the best method which gives us results closer to reality. This allows us to reach at a stage wherein we can provide our clients best and accurate investment to output ratio.

Each report that we prepare takes a timeframe of 350-400 business hours for production. Starting from the selection of titles through a couple of in-depth brain storming session to the final QC process before uploading our titles on our website we dedicate around 350 working hours. The titles are selected based on their current market cap and the foreseen CAGR and growth.


The 5 steps process:

Step 1: Secondary Research:

Secondary Research or Desk Research is as the name suggests is a research process wherein, we collect data through the readily available information. In this process we use various paid and unpaid databases which our team has access to and gather data through the same. This includes examining of listed companies’ annual reports, Journals, SEC filling etc. Apart from this our team has access to various associations across the globe across different industries. Lastly, we have exchange relationships with various university as well as individual libraries.

Secondary Research

Step 2: Primary Research

When we talk about primary research, it is a type of study in which the researchers collect relevant data samples directly, rather than relying on previously collected data.  This type of research is focused on gaining content specific facts that can be sued to solve specific problems. Since the collected data is fresh and first hand therefore it makes the study more accurate and genuine.

We at SNS Insider have divided Primary Research into 2 parts.

Part 1 wherein we interview the KOLs of major players as well as the upcoming ones across various geographic regions. This allows us to have their view over the market scenario and acts as an important tool to come closer to the accurate market numbers. As many as 45 paid and unpaid primary interviews are taken from both the demand and supply side of the industry to make sure we land at an accurate judgement and analysis of the market.

This step involves the triangulation of data wherein our team analyses the interview transcripts, online survey responses and observation of on filed participants. The below mentioned chart should give a better understanding of the part 1 of the primary interview.

Primary Research

Part 2: In this part of primary research the data collected via secondary research and the part 1 of the primary research is validated with the interviews from individual consultants and subject matter experts.

Consultants are those set of people who have at least 12 years of experience and expertise within the industry whereas Subject Matter Experts are those with at least 15 years of experience behind their back within the same space. The data with the help of two main processes i.e., FGDs (Focused Group Discussions) and IDs (Individual Discussions). This gives us a 3rd party nonbiased primary view of the market scenario making it a more dependable one while collation of the data pointers.

Step 3: Data Bank Validation

Once all the information is collected via primary and secondary sources, we run that information for data validation. At our intelligence centre our research heads track a lot of information related to the market which includes the quarterly reports, the daily stock prices, and other relevant information. Our data bank server gets updated every fortnight and that is how the information which we collected using our primary and secondary information is revalidated in real time.

Data Bank Validation

Step 4: QA/QC Process

After all the data collection and validation our team does a final level of quality check and quality assurance to get rid of any unwanted or undesired mistakes. This might include but not limited to getting rid of the any typos, duplication of numbers or missing of any important information. The people involved in this process include technical content writers, research heads and graphics people. Once this process is completed the title gets uploader on our platform for our clients to read it.

Step 5: Final QC/QA Process:

This is the last process and comes when the client has ordered the study. In this process a final QA/QC is done before the study is emailed to the client. Since we believe in giving our clients a good experience of our research studies, therefore, to make sure that we do not lack at our end in any way humanly possible we do a final round of quality check and then dispatch the study to the client.

Key Segments:

By Product

  • Differential Pressure (DP)

  • Positive Displacement (PD)

  • Magnetic

  • Wired

  • Wireless

  • Ultrasonic

  • Coriolis

  • Turbine

  • Vortex

  • Others

By Type

  • Electric

  • Solar

  • Battery Powered

By Application

  • Water & Wastewater

  • Oil & Gas

  • Chemicals

  • Power Generation

  • Pulp & Paper

  • Food & Beverage

  • Others

By Size

  • Pipe Size

  • 2 inches

  • 4 inches

  • 6 inches

  • More than 6 inches

Request for Segment Customization as per your Business Requirement: Segment Customization Request

Regional Coverage:

North America

  • US

  • Canada

  • Mexico

Europe

  • Eastern Europe

    • Poland

    • Romania

    • Hungary

    • Turkey

    • Rest of Eastern Europe

  • Western Europe

    • Germany

    • France

    • UK

    • Italy

    • Spain

    • Netherlands

    • Switzerland

    • Austria

    • Rest of Western Europe

Asia Pacific

  • China

  • India

  • Japan

  • South Korea

  • Vietnam

  • Singapore

  • Australia

  • Rest of Asia Pacific

Middle East & Africa

  • Middle East

    • UAE

    • Egypt

    • Saudi Arabia

    • Qatar

    • Rest of Middle East

  • Africa

    • Nigeria

    • South Africa

    • Rest of Africa

Latin America

  • Brazil

  • Argentina

  • Colombia

  • Rest of Latin America

Request for Country Level Research Report: Country Level Customization Request

Available Customization

With the given market data, SNS Insider offers customization as per the company’s specific needs. The following customization options are available for the report:

  • Detailed Volume Analysis

  • Criss-Cross segment analysis (e.g. Product X Application)

  • Competitive Product Benchmarking

  • Geographic Analysis

  • Additional countries in any of the regions

  • Customized Data Representation

  • Detailed analysis and profiling of additional market players


  •            5000 (33% Discount)


  •            8950 (40% Discount)


  •            3050 (23% Discount)

Start a Conversation

Hi! Click one of our member below to chat on Phone