Get More Information on Float Level Switches Market - Request Sample Report
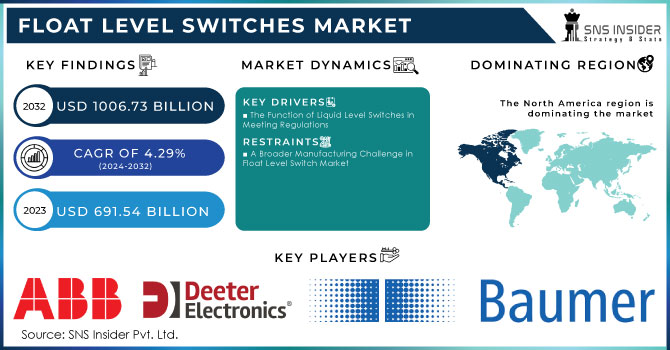
The Float Level Switches Market Size was valued at USD 691.54 million in 2023 and is expected to grow to USD 1006.73 million by 2032 and grow at a CAGR of 4.29% over the forecast period of 2024-2032.
The float level switches market is increasingly competitive due to the emergence of radar level sensors and other advanced technologies. The oil and gas industry is more and more using radar level sensors for saltwater disposal tank management, as shown by Point Energy Partners (PEP), a major user of float level switches. PEP's background highlights the drawbacks of conventional float level switches, especially in challenging settings such as SWD sites, where accuracy can be affected by corrosion, density changes, and temperature shifts. Radar level sensors provide precise measurements without physical contact, are not affected by environmental conditions, and offer superior accuracy. When paired with edge I/O systems such as Opto 22's groov RIO, these sensors facilitate real-time observation, distant operation, and connection with SCADA networks. The push towards radar technology is fueled by the desire for increased efficiency, minimized downtime, and savings on costs. For example, PEP calculated that a single overflow event results in a cost of roughly USD 200,000, underscoring the financial consequences of incorrect level monitoring. Although float level switches are still an option in some cases, the shift towards radar level sensors is expected to increase as industries look for stronger and more dependable liquid level control solutions.
Drivers
The Function of Liquid Level Switches in Meeting Regulations
The strictness of environmental and safety regulations is a powerful force behind the growth of the float level switch market. From oil and gas to chemical processing and wastewater treatment, various industries adhere to strict regulations to safeguard public health and the environment. Level switches that float are crucial for meeting these regulations. These devices aid in the prevention of spills, leaks, and overflows by precisely monitoring and controlling liquid levels in tanks, reservoirs, and process equipment, reducing the risk of environmental contamination or safety hazards. Furthermore, in sectors that deal with dangerous substances, float level switches play a vital role in ensuring safety by avoiding tank overfilling or under filling, ultimately preventing potential accidents and damage to equipment. With an increase in regulatory oversight, the need for dependable and precise level measurement devices like float level switches will only increase.
Restrains
A Broader Manufacturing Challenge in Float Level Switch Market
Although the semiconductor shortage of 2021 brought chip manufacturing to the forefront, it is important to understand that revitalizing America's microelectronics industry presents a larger challenge. This environment includes more than just semiconductors, but also printed circuit boards, capacitors, resistors, and other components such as integrated circuit substrates. The United States, formerly a frontrunner in this area, has experienced a notable decrease, while Asia currently dominates 75% of the market. Without competitive incentives, manufacturing has shifted to other countries, with potential Asian investments of USD 500 billion to USD 750 billion leading to a potential 90% dominance by 2030. The emphasis on semiconductor foundries in the National Defense Authorization Act is a start, but it's not enough to tackle the larger problem. Just like the microelectronics sector, the float level switch market is impacted by international trends. While the United States used to be a major force in manufacturing, changes in cost competitiveness and market demand have led to production moving to other regions. In order to prevent shortages and maintain a strong supply chain for float level switches, it is essential to take a holistic approach that includes domestic production, innovation, and collaborations.
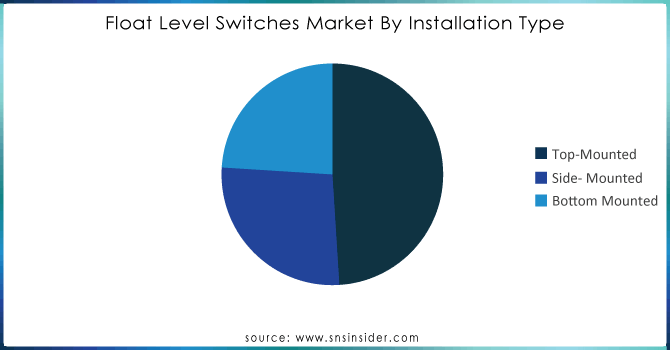
By Installation Type, Top Mounted dominated the float level switches market with 49% of share in 2023. Float level switches located on the top are very adaptable and suitable for various uses, such as water and wastewater treatment, chemical processing, and the oil and gas sectors. They are ideal for overseeing liquid levels in tanks, reservoirs, and other storage containers, making them a top choice in multiple industries. Placing float level switches at the tank's upper part guarantees accessibility for examination, upkeep, and substitution. This is especially crucial in sectors where safety and compliance with regulations are crucial, as it enables routine inspections and prompt actions without sacrificing operational safety. Float level switches attached at the top of tanks work well with various tank shapes and sizes, such as cylindrical, rectangular, and tanks with irregular shapes. Their versatility allows them to be used in a wide range of settings, from compact storage containers to massive industrial tanks.
Need any customization research on Float Level Switches Market - Enquiry Now
By Material, Plastic dominated the float level switches market with 40% of market share in 2023. Plastic float level switches are typically a more budget-friendly option than metal ones. This makes them an appealing choice for many different uses, especially in fields where financial limitations play a major role. Materials like polypropylene, PVC, and PTFE have great resilience against a variety of chemicals. Plastic float level switches are ideal for harsh chemical environments like chemical plants, sewage treatment facilities, and industries using corrosive liquids. Plastic float level switches are light in weight, making them simpler to install and manage. Continuous progress in polymer technology has resulted in the creation of high-performance plastics with improved durability, temperature resistance, and mechanical strength. These enhanced materials broaden the use of plastic float level switches, allowing them to be used in tougher conditions.
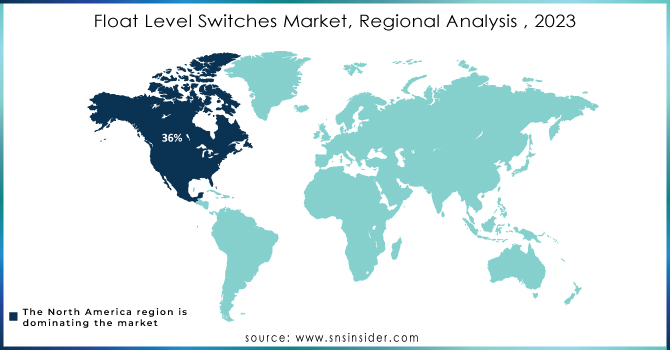
In 2023, North America dominates the float level switches market with a 36% share in 2023. The strong industrial base in North America, specifically in the United States and Canada, has led to an increased need for accurate liquid level control due to widespread use of automation. Industries like oil and gas, chemical processing, water treatment, and food and beverage depend significantly on float level switches for effective functioning. Emerson Electric and ABB, both well-known for their automation solutions and industrial technology, have established strong footholds in the market. The strong distribution network, combined with their knowledge, has helped North America become the leading force.
In 2023, the float level switch market in the Asia Pacific region is seeing significant growth and has secured a 29% market share. Industrialization, urbanization, and rising demand in sectors such as chemicals, water treatment, and oil & gas are driving China's significant contributions. Government efforts to encourage automation and sustainability are also enhancing the market. South Korea's strong technological abilities and emphasis on advanced manufacturing methods boost the use of sophisticated float level switches in the electronics, automotive, and petrochemical industries. Sophisticated level measurement solutions are required in Japan due to its robust industrial foundation and focus on precision and quality. Asia Pacific's various factors combine to make it a thriving and growing market for float level switches.
Some of the major key players in Float Level Switch with their product:
ABB Group (Float Level Switches, Guided Wave Radar Sensors)
APG (Float Level Switches, Capacitance Level Sensors)
Baumer (Magnetic Float Level Switches, Rotary Level Switches)
Deeter Electronics (Float Level Switches for Water, Oil, and Chemicals)
ECP (Endress+Hauser) (Liquiphant Float Level Switches)
Emerson (Rosemount Float Level Switches, Vibrating Fork Level Switches)
Endress+Hauser (Liquiphant T, Magnetic Float Level Switches)
Gems Sensors (Miniature Float Level Switches, Magnetic Float Level Sensors)
Magnetrol (AMETEK) (Magnetrol® Float Level Switches, Magnetostrictive Level Sensors)
Omron (Float Level Sensors, Digital Float Level Switches)
PIC GmbH (Capacitive Float Level Switches, Mechanical Float Level Switches)
Schneider Electric (Magnetic Float Level Switches, Process Control Sensors)
Sensata Technologies (Magnetic Float Level Switches, Solid-State Float Level Sensors)
Sourcingmap (Float Level Switch for Liquid and Water Detection)
TE Connectivity (Magnetic Float Level Switches, Reed Switch Level Sensors)
TT Electronics (Level Switches for Fluid Management, Magnetic Float Switches)
Honeywell (Float Level Switches for Tank Level Monitoring, Non-contact Level Sensors)
Veeder-Root (Float Level Switches for Tank Monitoring)
Siemens (Magnetic Float Level Switches, Ultrasonic Level Sensors)
Yokogawa (Float Level Switches, Differential Pressure Level Transmitters)
List of suppliers for raw materials used in the manufacturing of float level switches:
BASF
DuPont
3M
Röchling
PolyOne
Covestro
Saint-Gobain
Evonik Industries
Aptiv
Ferro Corporation
Mitsubishi Chemical
Sumitomo Chemical
Kraton Polymers
Schott
ThyssenKrupp Materials
SABIC
Elementis
Alcoa
ArcelorMittal
Hitachi Chemical
| Report Attributes | Details |
|---|---|
| Market Size in 2023 | USD 691.54 Million |
| Market Size by 2032 | USD 1006.73 Million |
| CAGR | CAGR of 4.29 % From 2024 to 2032 |
| Base Year | 2023 |
| Forecast Period | 2024-2032 |
| Historical Data | 2020-2022 |
| Report Scope & Coverage | Market Size, Segments Analysis, Competitive Landscape, Regional Analysis, DROC & SWOT Analysis, Forecast Outlook |
| Key Segments | • By Installation Type (Top-Mounted, Side- Mounted, Bottom Mounted) • By Material (Plastic, Stainless Steel, Others) • By Application (Chemical, Oil & Gas, Food & Beverage, Pharmaceutical, Others) |
| Regional Analysis/Coverage | North America (US, Canada, Mexico), Europe (Eastern Europe [Poland, Romania, Hungary, Turkey, Rest of Eastern Europe] Western Europe] Germany, France, UK, Italy, Spain, Netherlands, Switzerland, Austria, Rest of Western Europe]), Asia Pacific (China, India, Japan, South Korea, Vietnam, Singapore, Australia, Rest of Asia Pacific), Middle East & Africa (Middle East [UAE, Egypt, Saudi Arabia, Qatar, Rest of Middle East], Africa [Nigeria, South Africa, Rest of Africa], Latin America (Brazil, Argentina, Colombia, Rest of Latin America) |
| Company Profiles | ABB Group, APG, Baumer, Deeter Electronics, ECP, Emerson, Endress+Hauser, Gems Sensors, Magnetrol (AMETEK), Omron, PIC GmbH, Schneider Electric, Sensata Technologies, Sourcingmap, TE Connectivity, TT Electronics |
| Key Drivers | • The Function of Liquid Level Switches in Meeting Regulations |
| Restraints | • A Broader Manufacturing Challenge in Float Level Switch Market |
Ans.The increasing demand for automation across industries coupled with stringent environmental regulations is propelling the growth of the float level switches market.
Ans. The Float Level Switches Market size was valued at USD 691.54 million in 2023 and is expected to grow to USD 1006.73 million by 2032 and grow at a CAGR of 4.29 % over the forecast period of 2024-2032.
Ans. Asia Pacific region is to record the fastest growing in the Float Level Switches Market.
Ans. The Top Mounted is leading in the market revenue share in 2023.
Ans. North America is to hold the largest market share in the Float Level Switches Market during the forecast period.
Table of Content
1. Introduction
1.1 Market Definition
1.2 Scope (Inclusion and Exclusions)
1.3 Research Assumptions
2. Executive Summary
2.1 Market Overview
2.2 Regional Synopsis
2.3 Competitive Summary
3. Research Methodology
3.1 Top-Down Approach
3.2 Bottom-up Approach
3.3. Data Validation
3.4 Primary Interviews
4. Market Dynamics Impact Analysis
4.1 Market Driving Factors Analysis
4.1.1 Drivers
4.1.2 Restraints
4.1.3 Opportunities
4.1.4 Challenges
4.2 PESTLE Analysis
4.3 Porter’s Five Forces Model
5. Statistical Insights and Trends Reporting
5.1 Adoption Rates
5.2 Production and Supply Chain Data
5.3 Regulatory Compliance Data
5.4 Failure Rates and Reliability
6. Competitive Landscape
6.1 List of Major Companies, By Region
6.2 Market Share Analysis, By Region
6.3 Product Benchmarking
6.3.1 Product specifications and features
6.3.2 Pricing
6.4 Strategic Initiatives
6.4.1 Marketing and promotional activities
6.4.2 Distribution and supply chain strategies
6.4.3 Expansion plans and new product launches
6.4.4 Strategic partnerships and collaborations
6.5 Technological Advancements
6.6 Market Positioning and Branding
7. Float Level Switches Market Segmentation, by Installation Type
7.1 Chapter Overview
7.2 Top-Mounted
7.2.1 Top-Mounted Market Trends Analysis (2020-2032)
7.2.2 Top-Mounted Market Size Estimates and Forecasts to 2032 (USD Billion)
7.3 Side- Mounted
7.3.1 Side- Mounted Market Trends Analysis (2020-2032)
7.3.2 Side- Mounted Market Size Estimates and Forecasts to 2032 (USD Billion)
7.4 Bottom Mounted
7.4.1 Bottom Mounted Market Trends Analysis (2020-2032)
7.4.2 Bottom Mounted Market Size Estimates and Forecasts to 2032 (USD Billion)
8. Float Level Switches Market Segmentation, by Material
8.1 Chapter Overview
8.2 Plastic
8.2.1 Plastic Market Trends Analysis (2020-2032)
8.2.2 Plastic Market Size Estimates and Forecasts to 2032 (USD Billion)
8.3 Stainless Steel
8.3.1 Stainless Steel Market Trends Analysis (2020-2032)
8.3.2 Stainless Steel Market Size Estimates and Forecasts to 2032 (USD Billion)
8.4 Others
8.4.1 Others Market Trends Analysis (2020-2032)
8.4.2 Others Market Size Estimates and Forecasts to 2032 (USD Billion)
9. Float Level Switches Market Segmentation, by Application
9.1 Chapter Overview
9.2 Chemical
9.2.1 Chemical Market Trends Analysis (2020-2032)
9.2.2 Chemical Market Size Estimates and Forecasts to 2032 (USD Billion)
9.3 Oil & Gas
9.3.1 Oil & Gas Market Trends Analysis (2020-2032)
9.3.2 Oil & Gas Market Size Estimates and Forecasts to 2032 (USD Billion)
9.4 Food & Beverage
9.4.1 Food & Beverage Market Trends Analysis (2020-2032)
9.4.2 Food & Beverage Market Size Estimates and Forecasts to 2032 (USD Billion)
9.5 Pharmaceutical
9.5.1 Pharmaceutical Market Trends Analysis (2020-2032)
9.5.2 Pharmaceutical Market Size Estimates and Forecasts to 2032 (USD Billion)
9.6 Others
9.6.1 Others Market Trends Analysis (2020-2032)
9.6.2 Others Market Size Estimates and Forecasts to 2032 (USD Billion)
10. Regional Analysis
10.1 Chapter Overview
10.2 North America
10.2.1 Trends Analysis
10.2.2 North America Float Level Switches Market Estimates and Forecasts, by Country (2020-2032) (USD Billion)
10.2.3 North America Float Level Switches Market Estimates and Forecasts, by Installation Type (2020-2032) (USD Billion)
10.2.4 North America Float Level Switches Market Estimates and Forecasts, by Material (2020-2032) (USD Billion)
10.2.5 North America Float Level Switches Market Estimates and Forecasts, by Application (2020-2032) (USD Billion)
10.2.6 USA
10.2.6.1 USA Float Level Switches Market Estimates and Forecasts, by Installation Type (2020-2032) (USD Billion)
10.2.6.2 USA Float Level Switches Market Estimates and Forecasts, by Material (2020-2032) (USD Billion)
10.2.6.3 USA Float Level Switches Market Estimates and Forecasts, by Application (2020-2032) (USD Billion)
10.2.7 Canada
10.2.7.1 Canada Float Level Switches Market Estimates and Forecasts, by Installation Type (2020-2032) (USD Billion)
10.2.7.2 Canada Float Level Switches Market Estimates and Forecasts, by Material (2020-2032) (USD Billion)
10.2.7.3 Canada Float Level Switches Market Estimates and Forecasts, by Application (2020-2032) (USD Billion)
10.2.8 Mexico
10.2.8.1 Mexico Float Level Switches Market Estimates and Forecasts, by Installation Type (2020-2032) (USD Billion)
10.2.8.2 Mexico Float Level Switches Market Estimates and Forecasts, by Material (2020-2032) (USD Billion)
10.2.8.3 Mexico Float Level Switches Market Estimates and Forecasts, by Application (2020-2032) (USD Billion)
10.3 Europe
10.3.1 Eastern Europe
10.3.1.1 Trends Analysis
10.3.1.2 Eastern Europe Float Level Switches Market Estimates and Forecasts, by Country (2020-2032) (USD Billion)
10.3.1.3 Eastern Europe Float Level Switches Market Estimates and Forecasts, by Installation Type (2020-2032) (USD Billion)
10.3.1.4 Eastern Europe Float Level Switches Market Estimates and Forecasts, by Material (2020-2032) (USD Billion)
10.3.1.5 Eastern Europe Float Level Switches Market Estimates and Forecasts, by Application (2020-2032) (USD Billion)
10.3.1.6 Poland
10.3.1.6.1 Poland Float Level Switches Market Estimates and Forecasts, by Installation Type (2020-2032) (USD Billion)
10.3.1.6.2 Poland Float Level Switches Market Estimates and Forecasts, by Material (2020-2032) (USD Billion)
10.3.1.6.3 Poland Float Level Switches Market Estimates and Forecasts, by Application (2020-2032) (USD Billion)
10.3.1.7 Romania
10.3.1.7.1 Romania Float Level Switches Market Estimates and Forecasts, by Installation Type (2020-2032) (USD Billion)
10.3.1.7.2 Romania Float Level Switches Market Estimates and Forecasts, by Material (2020-2032) (USD Billion)
10.3.1.7.3 Romania Float Level Switches Market Estimates and Forecasts, by Application (2020-2032) (USD Billion)
10.3.1.8 Hungary
10.3.1.8.1 Hungary Float Level Switches Market Estimates and Forecasts, by Installation Type (2020-2032) (USD Billion)
10.3.1.8.2 Hungary Float Level Switches Market Estimates and Forecasts, by Material (2020-2032) (USD Billion)
10.3.1.8.3 Hungary Float Level Switches Market Estimates and Forecasts, by Application (2020-2032) (USD Billion)
10.3.1.9 Turkey
10.3.1.9.1 Turkey Float Level Switches Market Estimates and Forecasts, by Installation Type (2020-2032) (USD Billion)
10.3.1.9.2 Turkey Float Level Switches Market Estimates and Forecasts, by Material (2020-2032) (USD Billion)
10.3.1.9.3 Turkey Float Level Switches Market Estimates and Forecasts, by Application (2020-2032) (USD Billion)
10.3.1.10 Rest of Eastern Europe
10.3.1.10.1 Rest of Eastern Europe Float Level Switches Market Estimates and Forecasts, by Installation Type (2020-2032) (USD Billion)
10.3.1.10.2 Rest of Eastern Europe Float Level Switches Market Estimates and Forecasts, by Material (2020-2032) (USD Billion)
10.3.1.10.3 Rest of Eastern Europe Float Level Switches Market Estimates and Forecasts, by Application (2020-2032) (USD Billion)
10.3.2 Western Europe
10.3.2.1 Trends Analysis
10.3.2.2 Western Europe Float Level Switches Market Estimates and Forecasts, by Country (2020-2032) (USD Billion)
10.3.2.3 Western Europe Float Level Switches Market Estimates and Forecasts, by Installation Type (2020-2032) (USD Billion)
10.3.2.4 Western Europe Float Level Switches Market Estimates and Forecasts, by Material (2020-2032) (USD Billion)
10.3.2.5 Western Europe Float Level Switches Market Estimates and Forecasts, by Application (2020-2032) (USD Billion)
10.3.2.6 Germany
10.3.2.6.1 Germany Float Level Switches Market Estimates and Forecasts, by Installation Type (2020-2032) (USD Billion)
10.3.2.6.2 Germany Float Level Switches Market Estimates and Forecasts, by Material (2020-2032) (USD Billion)
10.3.2.6.3 Germany Float Level Switches Market Estimates and Forecasts, by Application (2020-2032) (USD Billion)
10.3.2.7 France
10.3.2.7.1 France Float Level Switches Market Estimates and Forecasts, by Installation Type (2020-2032) (USD Billion)
10.3.2.7.2 France Float Level Switches Market Estimates and Forecasts, by Material (2020-2032) (USD Billion)
10.3.2.7.3 France Float Level Switches Market Estimates and Forecasts, by Application (2020-2032) (USD Billion)
10.3.2.8 UK
10.3.2.8.1 UK Float Level Switches Market Estimates and Forecasts, by Installation Type (2020-2032) (USD Billion)
10.3.2.8.2 UK Float Level Switches Market Estimates and Forecasts, by Material (2020-2032) (USD Billion)
10.3.2.8.3 UK Float Level Switches Market Estimates and Forecasts, by Application (2020-2032) (USD Billion)
10.3.2.9 Italy
10.3.2.9.1 Italy Float Level Switches Market Estimates and Forecasts, by Installation Type (2020-2032) (USD Billion)
10.3.2.9.2 Italy Float Level Switches Market Estimates and Forecasts, by Material (2020-2032) (USD Billion)
10.3.2.9.3 Italy Float Level Switches Market Estimates and Forecasts, by Application (2020-2032) (USD Billion)
10.3.2.10 Spain
10.3.2.10.1 Spain Float Level Switches Market Estimates and Forecasts, by Installation Type (2020-2032) (USD Billion)
10.3.2.10.2 Spain Float Level Switches Market Estimates and Forecasts, by Material (2020-2032) (USD Billion)
10.3.2.10.3 Spain Float Level Switches Market Estimates and Forecasts, by Application (2020-2032) (USD Billion)
10.3.2.11 Netherlands
10.3.2.11.1 Netherlands Float Level Switches Market Estimates and Forecasts, by Installation Type (2020-2032) (USD Billion)
10.3.2.11.2 Netherlands Float Level Switches Market Estimates and Forecasts, by Material (2020-2032) (USD Billion)
10.3.2.11.3 Netherlands Float Level Switches Market Estimates and Forecasts, by Application (2020-2032) (USD Billion)
10.3.2.12 Switzerland
10.3.2.12.1 Switzerland Float Level Switches Market Estimates and Forecasts, by Installation Type (2020-2032) (USD Billion)
10.3.2.12.2 Switzerland Float Level Switches Market Estimates and Forecasts, by Material (2020-2032) (USD Billion)
10.3.2.12.3 Switzerland Float Level Switches Market Estimates and Forecasts, by Application (2020-2032) (USD Billion)
10.3.2.13 Austria
10.3.2.13.1 Austria Float Level Switches Market Estimates and Forecasts, by Installation Type (2020-2032) (USD Billion)
10.3.2.13.2 Austria Float Level Switches Market Estimates and Forecasts, by Material (2020-2032) (USD Billion)
10.3.2.13.3 Austria Float Level Switches Market Estimates and Forecasts, by Application (2020-2032) (USD Billion)
10.3.2.14 Rest of Western Europe
10.3.2.14.1 Rest of Western Europe Float Level Switches Market Estimates and Forecasts, by Installation Type (2020-2032) (USD Billion)
10.3.2.14.2 Rest of Western Europe Float Level Switches Market Estimates and Forecasts, by Material (2020-2032) (USD Billion)
10.3.2.14.3 Rest of Western Europe Float Level Switches Market Estimates and Forecasts, by Application (2020-2032) (USD Billion)
10.4 Asia Pacific
10.4.1 Trends Analysis
10.4.2 Asia Pacific Float Level Switches Market Estimates and Forecasts, by Country (2020-2032) (USD Billion)
10.4.3 Asia Pacific Float Level Switches Market Estimates and Forecasts, by Installation Type (2020-2032) (USD Billion)
10.4.4 Asia Pacific Float Level Switches Market Estimates and Forecasts, by Material (2020-2032) (USD Billion)
10.4.5 Asia Pacific Float Level Switches Market Estimates and Forecasts, by Application (2020-2032) (USD Billion)
10.4.6 China
10.4.6.1 China Float Level Switches Market Estimates and Forecasts, by Installation Type (2020-2032) (USD Billion)
10.4.6.2 China Float Level Switches Market Estimates and Forecasts, by Material (2020-2032) (USD Billion)
10.4.6.3 China Float Level Switches Market Estimates and Forecasts, by Application (2020-2032) (USD Billion)
10.4.7 India
10.4.7.1 India Float Level Switches Market Estimates and Forecasts, by Installation Type (2020-2032) (USD Billion)
10.4.7.2 India Float Level Switches Market Estimates and Forecasts, by Material (2020-2032) (USD Billion)
10.4.7.3 India Float Level Switches Market Estimates and Forecasts, by Application (2020-2032) (USD Billion)
10.4.8 Japan
10.4.8.1 Japan Float Level Switches Market Estimates and Forecasts, by Installation Type (2020-2032) (USD Billion)
10.4.8.2 Japan Float Level Switches Market Estimates and Forecasts, by Material (2020-2032) (USD Billion)
10.4.8.3 Japan Float Level Switches Market Estimates and Forecasts, by Application (2020-2032) (USD Billion)
10.4.9 South Korea
10.4.9.1 South Korea Float Level Switches Market Estimates and Forecasts, by Installation Type (2020-2032) (USD Billion)
10.4.9.2 South Korea Float Level Switches Market Estimates and Forecasts, by Material (2020-2032) (USD Billion)
10.4.9.3 South Korea Float Level Switches Market Estimates and Forecasts, by Application (2020-2032) (USD Billion)
10.4.10 Vietnam
10.4.10.1 Vietnam Float Level Switches Market Estimates and Forecasts, by Installation Type (2020-2032) (USD Billion)
10.4.10.2 Vietnam Float Level Switches Market Estimates and Forecasts, by Material (2020-2032) (USD Billion)
10.4.10.3 Vietnam Float Level Switches Market Estimates and Forecasts, by Application (2020-2032) (USD Billion)
10.4.11 Singapore
10.4.11.1 Singapore Float Level Switches Market Estimates and Forecasts, by Installation Type (2020-2032) (USD Billion)
10.4.11.2 Singapore Float Level Switches Market Estimates and Forecasts, by Material (2020-2032) (USD Billion)
10.4.11.3 Singapore Float Level Switches Market Estimates and Forecasts, by Application (2020-2032) (USD Billion)
10.4.12 Australia
10.4.12.1 Australia Float Level Switches Market Estimates and Forecasts, by Installation Type (2020-2032) (USD Billion)
10.4.12.2 Australia Float Level Switches Market Estimates and Forecasts, by Material (2020-2032) (USD Billion)
10.4.12.3 Australia Float Level Switches Market Estimates and Forecasts, by Application (2020-2032) (USD Billion)
10.4.13 Rest of Asia Pacific
10.4.13.1 Rest of Asia Pacific Float Level Switches Market Estimates and Forecasts, by Installation Type (2020-2032) (USD Billion)
10.4.13.2 Rest of Asia Pacific Float Level Switches Market Estimates and Forecasts, by Material (2020-2032) (USD Billion)
10.4.13.3 Rest of Asia Pacific Float Level Switches Market Estimates and Forecasts, by Application (2020-2032) (USD Billion)
10.5 Middle East and Africa
10.5.1 Middle East
10.5.1.1 Trends Analysis
10.5.1.2 Middle East Float Level Switches Market Estimates and Forecasts, by Country (2020-2032) (USD Billion)
10.5.1.3 Middle East Float Level Switches Market Estimates and Forecasts, by Installation Type (2020-2032) (USD Billion)
10.5.1.4 Middle East Float Level Switches Market Estimates and Forecasts, by Material (2020-2032) (USD Billion)
10.5.1.5 Middle East Float Level Switches Market Estimates and Forecasts, by Application (2020-2032) (USD Billion)
10.5.1.6 UAE
10.5.1.6.1 UAE Float Level Switches Market Estimates and Forecasts, by Installation Type (2020-2032) (USD Billion)
10.5.1.6.2 UAE Float Level Switches Market Estimates and Forecasts, by Material (2020-2032) (USD Billion)
10.5.1.6.3 UAE Float Level Switches Market Estimates and Forecasts, by Application (2020-2032) (USD Billion)
10.5.1.7 Egypt
10.5.1.7.1 Egypt Float Level Switches Market Estimates and Forecasts, by Installation Type (2020-2032) (USD Billion)
10.5.1.7.2 Egypt Float Level Switches Market Estimates and Forecasts, by Material (2020-2032) (USD Billion)
10.5.1.7.3 Egypt Float Level Switches Market Estimates and Forecasts, by Application (2020-2032) (USD Billion)
10.5.1.8 Saudi Arabia
10.5.1.8.1 Saudi Arabia Float Level Switches Market Estimates and Forecasts, by Installation Type (2020-2032) (USD Billion)
10.5.1.8.2 Saudi Arabia Float Level Switches Market Estimates and Forecasts, by Material (2020-2032) (USD Billion)
10.5.1.8.3 Saudi Arabia Float Level Switches Market Estimates and Forecasts, by Application (2020-2032) (USD Billion)
10.5.1.9 Qatar
10.5.1.9.1 Qatar Float Level Switches Market Estimates and Forecasts, by Installation Type (2020-2032) (USD Billion)
10.5.1.9.2 Qatar Float Level Switches Market Estimates and Forecasts, by Material (2020-2032) (USD Billion)
10.5.1.9.3 Qatar Float Level Switches Market Estimates and Forecasts, by Application (2020-2032) (USD Billion)
10.5.1.10 Rest of Middle East
10.5.1.10.1 Rest of Middle East Float Level Switches Market Estimates and Forecasts, by Installation Type (2020-2032) (USD Billion)
10.5.1.10.2 Rest of Middle East Float Level Switches Market Estimates and Forecasts, by Material (2020-2032) (USD Billion)
10.5.1.10.3 Rest of Middle East Float Level Switches Market Estimates and Forecasts, by Application (2020-2032) (USD Billion)
10.5.2 Africa
10.5.2.1 Trends Analysis
10.5.2.2 Africa Float Level Switches Market Estimates and Forecasts, by Country (2020-2032) (USD Billion)
10.5.2.3 Africa Float Level Switches Market Estimates and Forecasts, by Installation Type (2020-2032) (USD Billion)
10.5.2.4 Africa Float Level Switches Market Estimates and Forecasts, by Material (2020-2032) (USD Billion)
10.5.2.5 Africa Float Level Switches Market Estimates and Forecasts, by Application (2020-2032) (USD Billion)
10.5.2.6 South Africa
10.5.2.6.1 South Africa Float Level Switches Market Estimates and Forecasts, by Installation Type (2020-2032) (USD Billion)
10.5.2.6.2 South Africa Float Level Switches Market Estimates and Forecasts, by Material (2020-2032) (USD Billion)
10.5.2.6.3 South Africa Float Level Switches Market Estimates and Forecasts, by Application (2020-2032) (USD Billion)
10.5.2.7 Nigeria
10.5.2.7.1 Nigeria Float Level Switches Market Estimates and Forecasts, by Installation Type (2020-2032) (USD Billion)
10.5.2.7.2 Nigeria Float Level Switches Market Estimates and Forecasts, by Material (2020-2032) (USD Billion)
10.5.2.7.3 Nigeria Float Level Switches Market Estimates and Forecasts, by Application (2020-2032) (USD Billion)
10.5.2.8 Rest of Africa
10.5.2.8.1 Rest of Africa Float Level Switches Market Estimates and Forecasts, by Installation Type (2020-2032) (USD Billion)
10.5.2.8.2 Rest of Africa Float Level Switches Market Estimates and Forecasts, by Material (2020-2032) (USD Billion)
10.5.2.8.3 Rest of Africa Float Level Switches Market Estimates and Forecasts, by Application (2020-2032) (USD Billion)
10.6 Latin America
10.6.1 Trends Analysis
10.6.2 Latin America Float Level Switches Market Estimates and Forecasts, by Country (2020-2032) (USD Billion)
10.6.3 Latin America Float Level Switches Market Estimates and Forecasts, by Installation Type (2020-2032) (USD Billion)
10.6.4 Latin America Float Level Switches Market Estimates and Forecasts, by Material (2020-2032) (USD Billion)
10.6.5 Latin America Float Level Switches Market Estimates and Forecasts, by Application (2020-2032) (USD Billion)
10.6.6 Brazil
10.6.6.1 Brazil Float Level Switches Market Estimates and Forecasts, by Installation Type (2020-2032) (USD Billion)
10.6.6.2 Brazil Float Level Switches Market Estimates and Forecasts, by Material (2020-2032) (USD Billion)
10.6.6.3 Brazil Float Level Switches Market Estimates and Forecasts, by Application (2020-2032) (USD Billion)
10.6.7 Argentina
10.6.7.1 Argentina Float Level Switches Market Estimates and Forecasts, by Installation Type (2020-2032) (USD Billion)
10.6.7.2 Argentina Float Level Switches Market Estimates and Forecasts, by Material (2020-2032) (USD Billion)
10.6.7.3 Argentina Float Level Switches Market Estimates and Forecasts, by Application (2020-2032) (USD Billion)
10.6.8 Colombia
10.6.8.1 Colombia Float Level Switches Market Estimates and Forecasts, by Installation Type (2020-2032) (USD Billion)
10.6.8.2 Colombia Float Level Switches Market Estimates and Forecasts, by Material (2020-2032) (USD Billion)
10.6.8.3 Colombia Float Level Switches Market Estimates and Forecasts, by Application (2020-2032) (USD Billion)
10.6.9 Rest of Latin America
10.6.9.1 Rest of Latin America Float Level Switches Market Estimates and Forecasts, by Installation Type (2020-2032) (USD Billion)
10.6.9.2 Rest of Latin America Float Level Switches Market Estimates and Forecasts, by Material (2020-2032) (USD Billion)
10.6.9.3 Rest of Latin America Float Level Switches Market Estimates and Forecasts, by Application (2020-2032) (USD Billion)
11. Company Profiles
11.1 ABB Group
11.1.1 Company Overview
11.1.2 Financial
11.1.3 Products/ Services Offered
11.1.4 SWOT Analysis
11.2 APG
11.2.1 Company Overview
11.2.2 Financial
11.2.3 Products/ Services Offered
11.2.4 SWOT Analysis
11.3 Baumer
11.3.1 Company Overview
11.3.2 Financial
11.3.3 Products/ Services Offered
11.3.4 SWOT Analysis
11.4 Deeter Electronics
11.4.1 Company Overview
11.4.2 Financial
11.4.3 Products/ Services Offered
11.4.4 SWOT Analysis
11.5 ECP (Endress+Hauser)
11.5.1 Company Overview
11.5.2 Financial
11.5.3 Products/ Services Offered
11.5.4 SWOT Analysis
11.6 Emerson
11.6.1 Company Overview
11.6.2 Financial
11.6.3 Products/ Services Offered
11.6.4 SWOT Analysis
11.7 Endress+Hauser
11.7.1 Company Overview
11.7.2 Financial
11.7.3 Products/ Services Offered
11.7.4 SWOT Analysis
11.8 Gems Sensors
11.8.1 Company Overview
11.8.2 Financial
11.8.3 Products/ Services Offered
11.8.4 SWOT Analysis
11.9 Magnetrol (AMETEK)
11.9.1 Company Overview
11.9.2 Financial
11.9.3 Products/ Services Offered
11.9.4 SWOT Analysis
11.10 Omron
11.10.1 Company Overview
11.10.2 Financial
11.10.3 Products/ Services Offered
11.10.4 SWOT Analysis
12. Use Cases and Best Practices
13. Conclusion
An accurate research report requires proper strategizing as well as implementation. There are multiple factors involved in the completion of good and accurate research report and selecting the best methodology to compete the research is the toughest part. Since the research reports we provide play a crucial role in any company’s decision-making process, therefore we at SNS Insider always believe that we should choose the best method which gives us results closer to reality. This allows us to reach at a stage wherein we can provide our clients best and accurate investment to output ratio.
Each report that we prepare takes a timeframe of 350-400 business hours for production. Starting from the selection of titles through a couple of in-depth brain storming session to the final QC process before uploading our titles on our website we dedicate around 350 working hours. The titles are selected based on their current market cap and the foreseen CAGR and growth.
The 5 steps process:
Step 1: Secondary Research:
Secondary Research or Desk Research is as the name suggests is a research process wherein, we collect data through the readily available information. In this process we use various paid and unpaid databases which our team has access to and gather data through the same. This includes examining of listed companies’ annual reports, Journals, SEC filling etc. Apart from this our team has access to various associations across the globe across different industries. Lastly, we have exchange relationships with various university as well as individual libraries.

Step 2: Primary Research
When we talk about primary research, it is a type of study in which the researchers collect relevant data samples directly, rather than relying on previously collected data. This type of research is focused on gaining content specific facts that can be sued to solve specific problems. Since the collected data is fresh and first hand therefore it makes the study more accurate and genuine.
We at SNS Insider have divided Primary Research into 2 parts.
Part 1 wherein we interview the KOLs of major players as well as the upcoming ones across various geographic regions. This allows us to have their view over the market scenario and acts as an important tool to come closer to the accurate market numbers. As many as 45 paid and unpaid primary interviews are taken from both the demand and supply side of the industry to make sure we land at an accurate judgement and analysis of the market.
This step involves the triangulation of data wherein our team analyses the interview transcripts, online survey responses and observation of on filed participants. The below mentioned chart should give a better understanding of the part 1 of the primary interview.

Part 2: In this part of primary research the data collected via secondary research and the part 1 of the primary research is validated with the interviews from individual consultants and subject matter experts.
Consultants are those set of people who have at least 12 years of experience and expertise within the industry whereas Subject Matter Experts are those with at least 15 years of experience behind their back within the same space. The data with the help of two main processes i.e., FGDs (Focused Group Discussions) and IDs (Individual Discussions). This gives us a 3rd party nonbiased primary view of the market scenario making it a more dependable one while collation of the data pointers.
Step 3: Data Bank Validation
Once all the information is collected via primary and secondary sources, we run that information for data validation. At our intelligence centre our research heads track a lot of information related to the market which includes the quarterly reports, the daily stock prices, and other relevant information. Our data bank server gets updated every fortnight and that is how the information which we collected using our primary and secondary information is revalidated in real time.

Step 4: QA/QC Process
After all the data collection and validation our team does a final level of quality check and quality assurance to get rid of any unwanted or undesired mistakes. This might include but not limited to getting rid of the any typos, duplication of numbers or missing of any important information. The people involved in this process include technical content writers, research heads and graphics people. Once this process is completed the title gets uploader on our platform for our clients to read it.
Step 5: Final QC/QA Process:
This is the last process and comes when the client has ordered the study. In this process a final QA/QC is done before the study is emailed to the client. Since we believe in giving our clients a good experience of our research studies, therefore, to make sure that we do not lack at our end in any way humanly possible we do a final round of quality check and then dispatch the study to the client.
By Installation Type
Top-Mounted
Side- Mounted
Bottom Mounted
By Material
Plastic
Stainless Steel
Others
By Application
Chemical
Oil & Gas
Food & Beverage
Pharmaceutical
Others
Request for Segment Customization as per your Business Requirement: Segment Customization Request
REGIONAL COVERAGE:
North America
US
Canada
Mexico
Europe
Eastern Europe
Poland
Romania
Hungary
Turkey
Rest of Eastern Europe
Western Europe
Germany
France
UK
Italy
Spain
Netherlands
Switzerland
Austria
Rest of Western Europe
Asia Pacific
China
India
Japan
South Korea
Vietnam
Singapore
Australia
Rest of Asia Pacific
Middle East & Africa
Middle East
UAE
Egypt
Saudi Arabia
Qatar
Rest of the Middle East
Africa
Nigeria
South Africa
Rest of Africa
Latin America
Brazil
Argentina
Colombia
Request for Country Level Research Report: Country Level Customization Request
Available Customization
With the given market data, SNS Insider offers customization as per the company’s specific needs. The following customization options are available for the report:
Product Analysis
Criss-Cross segment analysis (e.g. Product X Application)
Product Matrix which gives a detailed comparison of product portfolio of each company
Geographic Analysis
Additional countries in any of the regions
Company Information
Detailed analysis and profiling of additional market players (Up to five)
The Full-body Scanners Market Size was valued at USD 351.23 million in 2023 and is expected to reach USD 973.9 million by 2032, growing at a CAGR of 12% over the forecast period 2024-2032.
Optocoupler IC Market Size was valued at USD 2.5 billion in 2023 and is expected to reach USD 3.9 billion by 2032, and grow at a CAGR of 5% over the forecast period 2024-2032.
The AI in Networks Market Size was valued at USD 8.33 Billion in 2023 and is expected to reach USD 101.29 Billion by 2032, at 32.14% CAGR, during 2024-2032
The LiDAR Market size is valued at USD 1.77 Billion in 2023. It is estimated to reach USD 8.86 Billion by 2032, growing at a CAGR of 19.60% during 2024-2032.
Explore the Semiconductor Annealing System Market, focusing on rapid thermal processing, laser annealing, and advanced furnace systems. Discover key trends, innovations, and players driving growth in annealing solutions for semiconductor manufacturing pro
The Lithium Titanate Oxide (LTO) Battery Market size was USD 4.46 billion in 2023 and is estimated to Reach USD 11.35 billion by 2032 and grow at a CAGR of 10.98% over the forecast period of 2024-2032.

Hi! Click one of our member below to chat on Phone
© 2025 All Rights Reserved by SNS Insider Pvt Ltd


