The Flexible PCB Market was valued at USD 21.42 billion in 2023 and is expected to reach USD 61.75 billion by 2032, growing at a CAGR of 12.52% over the forecast period 2024-2032.
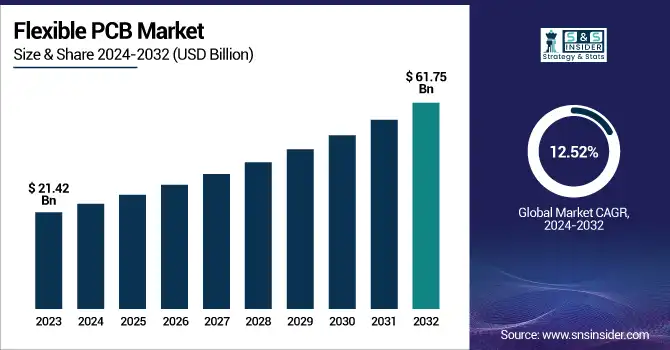
 Flexible PCB market designs are changing with a trend toward miniaturization, high-density interconnects, and improved thermal management. Thus, due to constant demand coming from both consumer electronics and automotive sectors, fabrication capacity utilization is on the rise. Innovation is fueled by emerging applications in wearables, foldable devices, and medical implants, and integration with 5G, IoT, and AI is helping to broaden their capabilities. New approaches to manufacturing like additive printing and laser direct imaging render the ability to produce future electronic devices to tighter tolerances with enhanced performance and cost-effectiveness. Robust demand across automotive, medical devices, and consumer electronics sectors owing to growth trends in electric vehicles, wearable health monitors, and small-size smart devices had a positive impact on the U.S. Flexible PCB market in 2024. To satisfy the demand for increasingly complex designs needed for high performance, manufacturers are balancing higher yield production with increased capacity and adopting flexible hybrid electronics during the process.
The U.S. Flexible PCB Market is estimated to be USD 1.80 Billion in 2023 and is projected to grow at a CAGR of 13.53%. The flexible PCB market in the U.S. is also driven by trends such as the growing acceptance of advanced driver-assistance systems (ADAS), increasing installation of flexible circuits in aerospace and defense apparatus, an ongoing preference for lightweight, space-optimized parts, and governmental programs to promote in-house electronics manufacturing and R&D regarding high-density interconnect and miniatured circuit technologies.
Key Drivers:
Flexible PCBs Drive Growth with Rising Demand in Compact Electronics EVs and Advanced Automotive Systems
An increase in demand for miniaturized, lightweight, and high-end electronics especially in consumer electronics is one of the key segments of flexible PCB propelling the growth of the Flexible PCB market. Compact circuitry made of bendable materials is fundamental for flexible, foldable, and otherwise space-saving electronics such as smartphones, tablets, and wearables. Moreover, the rapid adoption of electric vehicles (EVs) and advanced driver-assistance systems (ADAS) in the automotive industry is increasing demand for flexible PCBs for better signal integrity, lightweight, and high durability in packed automotive modules.
Restrain:
Design Challenges and Manufacturing Issues Restrain Flexible PCB Growth in Critical High Performance Applications
The factors that are restraining the growth of flexible PCB are the design complexity and poor yield during the manufacturing process. Flexible circuits differ from conventional rigid PCBs in that they are much more sensitive to layout and structural rigidity concerning reliably functioning when bent, folded, or twisted. The increased complexity can cause higher rates of failure during the prototyping and early production phases that will need to be validated and tested at higher levels. Additionally, reliability and mechanical performance under dynamic stress are difficult to achieve and test, especially in mission-critical markets such as automotive, aerospace, and medical applications. Even a minor defect or design flaw will drastically influence the device's performance and reliability.
Opportunity:
5G IoT Medical Electronics and Advanced Materials Drive Growth of Flexible PCBs in Critical Industries
The growth of the 5G and IOT infrastructure is a massive opportunity, especially in IT & telecom. The development of ultra-fast data transmission and edge computer services has increased end-user demand for reliable, high-speed, flexible, and compact interconnect solutions, thereby serving as a significant driver for multilayer and rigid-flex FPCBs. Furthermore, the increasing demand for medical electronics such as wearable health monitors and minim invasive surgical tools provides strong opportunities for biocompatible and high-reliability flexible PCBs in the long term. Ongoing developments in materials, including polyimide and liquid crystal polymer substrates, are allowing for wider use in extreme environments such as aerospace and industrial electronics, which could also drive market growth.
Challenges:
Standardization Challenges and Rapid Technological Advances Hinder Flexible PCB Production and Innovation Efficiency
This limited standardization over the end-use industry and application continues to pose challenges to manufacturers. Various industries such as telecom, medical, and automotive require unique FPCB designs, combinations of materials, and performance levels, which makes scaling production or developing the process challenging. Furthermore, the rapid development cycle of electronic components and miniaturization trends demand continuous innovation and adaptation of FPCB design and assembly techniques. Adding to this complexity is how the integration of flexible PCs with emerging technologies and high-frequency RF components for 5G or bio-compatible circuits for medical devices, for example, necessitates specialized manufacturing machinery, and multidisciplinary expertise, and ultimately can delay time-to-market and operational efficiency.
By Type
Double-sided FPCBs held the largest share of flexible PCB marketing in 2023, at 44.3%. They are also more complex in ensuring a planar layout, but this complexity allows for more advanced circuit designs than a single-sided board would enable, and are therefore more commonly used as they remain less expensive (and require fewer materials) than newer technologies. These flexible printed circuit boards are commonly used within consumer electronics, automotive, and industrial applications and offer the right balance of performance, durability, and effective use of space.
Multilayer FPCBs are expected to grow at the highest CAGR between 2024 and 2032, due to the demand for high-density and compact electronics assemblies. They are suitable for advanced devices that need greater data transmission, increased thermal management, and increased circuit complexity like smartphones, medical, aerospace, and 5G-enabled devices. All this means, that multilayer FPCBs require the industry to take further levels of miniaturization and performance which are becoming increasingly critical as manufacturers continue to increase the level of functionalities integrated into limited footprint zones maintaining a high signal integrity and reliability.
By End Use
In 2023, the Flexible PCB market was led by the Consumer Electronics segment, which accounted for a significant 51.3% market share. This dominance mainly owes to the high adoption of FPCBs in smartphones, tablets, laptops, smartwatches many other handheld gadgets that require lightweight, compact, and flexible circuit solutions. The increasing trend towards miniaturization and multi-functionality of consumer gadgets is boosting the market for FPCBs that provide excellent performance in ever-slimmer packages.
The IT & Telecom segment is expected to register the fastest CAGR in the flexible PCB market from 2024 to 2032. The expansion is due to the worldwide growth of 5G infrastructure, rising investments within data centers, and demand from end-user domains like commercial IoT device adoption and increasing demand from high-speed communication equipment. The requirement of robust high-performance interconnect solutions, such as multilayer and rigid-flex FPCBs is crucial as telecom networks continue to evolve toward high-frequency and high-speed platforms, which also creates new opportunities for market growth.
Regional Analysis
In 2023, Asia Pacific commanded nearly 74.7% of the Flexible PCB market share, owing to the available manufacturing ecosystem and multiple Electronic product manufacturers. China, Japan, South Korea and Taiwan are the world leaders of consumer and automotive electronics and semiconductor manufacturing. Major corporations like Samsung Electronics (South Korea), Sony (Japan), and Foxconn (Taiwan/China) have a deep dependence on flexible PCB for smartphones, smartwatches, and display modules. Moreover, increasing regional demand for electric vehicles and wearable devices also drives the market where it has become a center of production as well as a center of consumption.
North America is expected to have the highest CAGR from 2024 to 2032, driven by developments in 5G, aerospace, defense, and medical technologies. Particularly in the U.S. expanded investments are appearing for high-reliability electronics where flexible PCBs are key enablers. For instance, Lockheed Martin and Raytheon Technologies utilize rigid-flex PCBs within next-gen avionics and defense systems. The telecom sector is led by Cisco and Qualcomm, innovating in network infra and IoT devices, generating demand for advanced FPCB designs. High-end applications and rising R&D investments are likely to drive its adoption and propel market growth in the region.
Some of the major players in the Flexible PCB Market are:
Nippon Mektron (Flex Circuit Board),
Zhen Ding Technology Holding Ltd. (HDI Flexible PCB),
Sumitomo Electric Industries (Flexible Printed Wiring Board),
Interflex Co. Ltd. (Flexible Printed Circuit for Display Modules),
Career Technology (Mfg.) Co., Ltd. (Automotive FPC),
Ichia Technologies Inc. (Flexible Touch Panel PCB),
Multi-Fineline Electronix, Inc. (MFLEX) (High-Density Interconnect FPC),
NewFlex Technology Co., Ltd. (LED Lighting FPC),
FLEXium Interconnect, Inc. (Wearable Device FPC),
Daeduck GDS (Rigid-Flex PCB for Smartphones),
SIFlex Co., Ltd. (Mobile Application FPC),
BHflex Co., Ltd. (Camera Module FPC),
Interconnect Systems Inc. (Flex Assembly Subsystems),
Samsung Electro-Mechanics (Flexible OLED Display PCB),
Nitto Denko Corporation (Flexible Printed Circuit Substrates).
In April 2024, Nippon Mektron Ltd. secured an order from Volkswagen to supply flexible printed circuits (FPCs) for the ID.2 electric vehicle's battery management system. Production is set to begin in 2026, with projected sales exceeding EURO 400 million.
In October 2024, DuPont and Zhen Ding Technology Group signed a strategic cooperation agreement to advance high-end printed circuit board technology. The partnership aims to enhance R&D, improve material performance, and drive innovation in smart manufacturing and sustainability for the electronics industry.
Report Attributes | Details |
Market Size in 2023 | USD 21.42 Billion |
Market Size by 2032 | USD 61.75 Billion |
CAGR | CAGR of 12.52% From 2024 to 2032 |
Base Year | 2023 |
Forecast Period | 2024-2032 |
Historical Data | 2020-2022 |
Report Scope & Coverage | Market Size, Segments Analysis, Competitive Landscape, Regional Analysis, DROC & SWOT Analysis, Forecast Outlook |
Key Segments | • By Type (Single Sided FPCBs, Double Sided FPCBS, Multilayer FPCBS, Rigid-Flex PCBS, Others) • By End Use (Industrial Electronics, Aerospace & Defense, IT & Telecom, Automotive, Consumer Electronics, Other) |
Regional Analysis/Coverage | North America (US, Canada, Mexico), Europe (Eastern Europe [Poland, Romania, Hungary, Turkey, Rest of Eastern Europe] Western Europe] Germany, France, UK, Italy, Spain, Netherlands, Switzerland, Austria, Rest of Western Europe]), Asia Pacific (China, India, Japan, South Korea, Vietnam, Singapore, Australia, Rest of Asia Pacific), Middle East & Africa (Middle East [UAE, Egypt, Saudi Arabia, Qatar, Rest of Middle East], Africa [Nigeria, South Africa, Rest of Africa], Latin America (Brazil, Argentina, Colombia, Rest of Latin America) |
Company Profiles | Nippon Mektron, Zhen Ding Technology Holding Ltd., Sumitomo Electric Industries, Interflex Co. Ltd., Career Technology (Mfg.) Co., Ltd., Ichia Technologies Inc., Multi-Fineline Electronix, Inc. (MFLEX), NewFlex Technology Co., Ltd., FLEXium Interconnect, Inc., Daeduck GDS, SIFlex Co., Ltd., BHflex Co., Ltd., Interconnect Systems Inc., Samsung Electro-Mechanics, Nitto Denko Corporation. |
Ans: The Flexible PCB Market is expected to grow at a CAGR of 12.52% during 2024-2032.
Ans: Flexible PCB Market size was USD 21.42 Billion in 2023 and is expected to Reach USD 61.75 Billion by 2032.
Ans: The major growth factor of the Flexible PCB market is the rising demand for compact, lightweight, and high-performance electronic devices across consumer electronics, automotive, and telecom sectors.
Ans: The Double-Sided FPCBS segment dominated the Flexible PCB market in 2023.
Ans: Asia Pacific dominated the Flexible PCB Market in 2023.
Table of Content
1. Introduction
1.1 Market Definition
1.2 Scope (Inclusion and Exclusions)
1.3 Research Assumptions
2. Executive Summary
2.1 Market Overview
2.2 Regional Synopsis
2.3 Competitive Summary
3. Research Methodology
3.1 Top-Down Approach
3.2 Bottom-up Approach
3.3. Data Validation
3.4 Primary Interviews
4. Market Dynamics Impact Analysis
4.1 Market Driving Factors Analysis
4.1.1 Drivers
4.1.2 Restraints
4.1.3 Opportunities
4.1.4 Challenges
4.2 PESTLE Analysis
4.3 Porter’s Five Forces Model
5. Statistical Insights and Trends Reporting
5.1 Flexible PCB Design Trends
5.2 Flexible PCB Fab Capacity Utilization
5.3 Emerging Applications and Technological Integrations
5.4 Advanced Manufacturing Techniques
6. Competitive Landscape
6.1 List of Major Companies, By Region
6.2 Market Share Analysis, By Region
6.3 Product Benchmarking
6.3.1 Product specifications and features
6.3.2 Pricing
6.4 Strategic Initiatives
6.4.1 Marketing and promotional activities
6.4.2 Distribution and Supply Chain Strategies
6.4.3 Expansion plans and new product launches
6.4.4 Strategic partnerships and collaborations
6.5 Technological Advancements
6.6 Market Positioning and Branding
7. Flexible PCB Market Segmentation, By Type
7.1 Chapter Overview
7.2 Single Sided FPCBs
7.2.1 Single Sided FPCBs Market Trends Analysis (2020-2032)
7.2.2 Single Sided FPCBs Market Size Estimates and Forecasts to 2032 (USD BILLION)
7.3 Double Sided FPCBS
7.3.1 Double Sided FPCBS Market Trends Analysis (2020-2032)
7.3.2 Double Sided FPCBS Market Size Estimates and Forecasts to 2032 (USD BILLION)
7.4 Multilayer FPCBS
7.4.1 Multilayer FPCBS Market Trends Analysis (2020-2032)
7.4.2 Multilayer FPCBS Market Size Estimates and Forecasts to 2032 (USD BILLION)
7.5 Rigid-Flex PCBS
7.5.1 Rigid-Flex PCBS Market Trends Analysis (2020-2032)
7.5.2 Rigid-Flex PCBS Market Size Estimates and Forecasts to 2032 (USD BILLION)
7.6 Others
7.6.1 Others Market Trends Analysis (2020-2032)
7.6.2 Others Market Size Estimates and Forecasts to 2032 (USD BILLION)
8. Flexible PCB Market Segmentation, By End Use
8.1 Chapter Overview
8.2 Industrial Electronics
8.2.1 Industrial Electronics Market Trends Analysis (2020-2032)
8.2.2 Industrial Electronics Market Size Estimates and Forecasts to 2032 (USD BILLION)
8.3 Aerospace & Defense
8.3.1 Aerospace & Defense Market Trends Analysis (2020-2032)
8.3.2 Aerospace & Defense Market Size Estimates and Forecasts to 2032 (USD BILLION)
8.4 IT & Telecom
8.4.1 IT & Telecom Market Trends Analysis (2020-2032)
8.4.2 IT & Telecom Market Size Estimates and Forecasts to 2032 (USD BILLION)
8.5 Automotive
8.5.1 Automotive Market Trends Analysis (2020-2032)
8.5.2 Automotive Market Size Estimates and Forecasts to 2032 (USD BILLION)
8.6 Consumer Electronics
8.6.1 Consumer Electronics Market Trends Analysis (2020-2032)
8.6.2 Consumer Electronics Market Size Estimates and Forecasts to 2032 (USD BILLION)
8.7 Others
8.7.1 Others Market Trends Analysis (2020-2032)
8.7.2 Others Market Size Estimates and Forecasts to 2032 (USD BILLION)
9. Regional Analysis
9.1 Chapter Overview
9.2 North America
9.2.1 Trends Analysis
9.2.2 North America Flexible PCB Market Estimates and Forecasts, by Country (2020-2032) (USD BILLION)
9.2.3 North America Flexible PCB Market Estimates and Forecasts, By Type (2020-2032) (USD BILLION)
9.2.4 North America Flexible PCB Market Estimates and Forecasts, By End Use (2020-2032) (USD BILLION)
9.2.5 USA
9.2.5.1 USA Flexible PCB Market Estimates and Forecasts, By Type (2020-2032) (USD BILLION)
9.2.5.2 USA Flexible PCB Market Estimates and Forecasts, By End Use (2020-2032) (USD BILLION)
9.2.6 Canada
9.2.6.1 Canada Flexible PCB Market Estimates and Forecasts, By Type (2020-2032) (USD BILLION)
9.2.6.2 Canada Flexible PCB Market Estimates and Forecasts, By End Use (2020-2032) (USD BILLION)
9.2.7 Mexico
9.2.7.1 Mexico Flexible PCB Market Estimates and Forecasts, By Type (2020-2032) (USD BILLION)
9.2.7.2 Mexico Flexible PCB Market Estimates and Forecasts, By End Use (2020-2032) (USD BILLION)
9.3 Europe
9.3.1 Eastern Europe
9.3.1.1 Trends Analysis
9.3.1.2 Eastern Europe Flexible PCB Market Estimates and Forecasts, by Country (2020-2032) (USD BILLION)
9.3.1.3 Eastern Europe Flexible PCB Market Estimates and Forecasts, By Type (2020-2032) (USD BILLION)
9.3.1.4 Eastern Europe Flexible PCB Market Estimates and Forecasts, By End Use (2020-2032) (USD BILLION)
9.3.1.5 Poland
9.3.1.5.1 Poland Flexible PCB Market Estimates and Forecasts, By Type (2020-2032) (USD BILLION)
9.3.1.5.2 Poland Flexible PCB Market Estimates and Forecasts, By End Use (2020-2032) (USD BILLION)
9.3.1.6 Romania
9.3.1.6.1 Romania Flexible PCB Market Estimates and Forecasts, By Type (2020-2032) (USD BILLION)
9.3.1.6.2 Romania Flexible PCB Market Estimates and Forecasts, By End Use (2020-2032) (USD BILLION)
9.3.1.7 Hungary
9.3.1.7.1 Hungary Flexible PCB Market Estimates and Forecasts, By Type (2020-2032) (USD BILLION)
9.3.1.7.2 Hungary Flexible PCB Market Estimates and Forecasts, By End Use (2020-2032) (USD BILLION)
9.3.1.8 turkey
9.3.1.8.1 Turkey Flexible PCB Market Estimates and Forecasts, By Type (2020-2032) (USD BILLION)
9.3.1.8.2 Turkey Flexible PCB Market Estimates and Forecasts, By End Use (2020-2032) (USD BILLION)
9.3.1.9 Rest of Eastern Europe
9.3.1.9.1 Rest of Eastern Europe Flexible PCB Market Estimates and Forecasts, By Type (2020-2032) (USD BILLION)
9.3.1.9.2 Rest of Eastern Europe Flexible PCB Market Estimates and Forecasts, By End Use (2020-2032) (USD BILLION)
9.3.2 Western Europe
9.3.2.1 Trends Analysis
9.3.2.2 Western Europe Flexible PCB Market Estimates and Forecasts, by Country (2020-2032) (USD BILLION)
9.3.2.3 Western Europe Flexible PCB Market Estimates and Forecasts, By Type (2020-2032) (USD BILLION)
9.3.2.4 Western Europe Flexible PCB Market Estimates and Forecasts, By End Use (2020-2032) (USD BILLION)
9.3.2.5 Germany
9.3.2.5.1 Germany Flexible PCB Market Estimates and Forecasts, By Type (2020-2032) (USD BILLION)
9.3.2.5.2 Germany Flexible PCB Market Estimates and Forecasts, By End Use (2020-2032) (USD BILLION)
9.3.2.6 France
9.3.2.6.1 France Flexible PCB Market Estimates and Forecasts, By Type (2020-2032) (USD BILLION)
9.3.2.6.2 France Flexible PCB Market Estimates and Forecasts, By End Use (2020-2032) (USD BILLION)
9.3.2.7 UK
9.3.2.7.1 UK Flexible PCB Market Estimates and Forecasts, By Type (2020-2032) (USD BILLION)
9.3.2.7.2 UK Flexible PCB Market Estimates and Forecasts, By End Use (2020-2032) (USD BILLION)
9.3.2.8 Italy
9.3.2.8.1 Italy Flexible PCB Market Estimates and Forecasts, By Type (2020-2032) (USD BILLION)
9.3.2.8.2 Italy Flexible PCB Market Estimates and Forecasts, By End Use (2020-2032) (USD BILLION)
9.3.2.9 Spain
9.3.2.9.1 Spain Flexible PCB Market Estimates and Forecasts, By Type (2020-2032) (USD BILLION)
9.3.2.9.2 Spain Flexible PCB Market Estimates and Forecasts, By End Use (2020-2032) (USD BILLION)
9.3.2.10 Netherlands
9.3.2.10.1 Netherlands Flexible PCB Market Estimates and Forecasts, By Type (2020-2032) (USD BILLION)
9.3.2.10.2 Netherlands Flexible PCB Market Estimates and Forecasts, By End Use (2020-2032) (USD BILLION)
9.3.2.11 Switzerland
9.3.2.11.1 Switzerland Flexible PCB Market Estimates and Forecasts, By Type (2020-2032) (USD BILLION)
9.3.2.11.2 Switzerland Flexible PCB Market Estimates and Forecasts, By End Use (2020-2032) (USD BILLION)
9.3.2.12 Austria
9.3.2.12.1 Austria Flexible PCB Market Estimates and Forecasts, By Type (2020-2032) (USD BILLION)
9.3.2.12.2 Austria Flexible PCB Market Estimates and Forecasts, By End Use (2020-2032) (USD BILLION)
9.3.2.13 Rest of Western Europe
9.3.2.13.1 Rest of Western Europe Flexible PCB Market Estimates and Forecasts, By Type (2020-2032) (USD BILLION)
9.3.2.13.2 Rest of Western Europe Flexible PCB Market Estimates and Forecasts, By End Use (2020-2032) (USD BILLION)
9.4 Asia Pacific
9.4.1 Trends Analysis
9.4.2 Asia Pacific Flexible PCB Market Estimates and Forecasts, by Country (2020-2032) (USD BILLION)
9.4.3 Asia Pacific Flexible PCB Market Estimates and Forecasts, By Type (2020-2032) (USD BILLION)
9.4.4 Asia Pacific Flexible PCB Market Estimates and Forecasts, By End Use (2020-2032) (USD BILLION)
9.4.5 China
9.4.5.1 China Flexible PCB Market Estimates and Forecasts, By Type (2020-2032) (USD BILLION)
9.4.5.2 China Flexible PCB Market Estimates and Forecasts, By End Use (2020-2032) (USD BILLION)
9.4.6 India
9.4.5.1 India Flexible PCB Market Estimates and Forecasts, By Type (2020-2032) (USD BILLION)
9.4.5.2 India Flexible PCB Market Estimates and Forecasts, By End Use (2020-2032) (USD BILLION)
9.4.5 Japan
9.4.5.1 Japan Flexible PCB Market Estimates and Forecasts, By Type (2020-2032) (USD BILLION)
9.4.5.2 Japan Flexible PCB Market Estimates and Forecasts, By End Use (2020-2032) (USD BILLION)
9.4.6 South Korea
9.4.6.1 South Korea Flexible PCB Market Estimates and Forecasts, By Type (2020-2032) (USD BILLION)
9.4.6.2 South Korea Flexible PCB Market Estimates and Forecasts, By End Use (2020-2032) (USD BILLION)
9.4.7 Vietnam
9.4.7.1 Vietnam Flexible PCB Market Estimates and Forecasts, By Type (2020-2032) (USD BILLION)
9.2.7.2 Vietnam Flexible PCB Market Estimates and Forecasts, By End Use (2020-2032) (USD BILLION)
9.4.8 Singapore
9.4.8.1 Singapore Flexible PCB Market Estimates and Forecasts, By Type (2020-2032) (USD BILLION)
9.4.8.2 Singapore Flexible PCB Market Estimates and Forecasts, By End Use (2020-2032) (USD BILLION)
9.4.9 Australia
9.4.9.1 Australia Flexible PCB Market Estimates and Forecasts, By Type (2020-2032) (USD BILLION)
9.4.9.2 Australia Flexible PCB Market Estimates and Forecasts, By End Use (2020-2032) (USD BILLION)
9.4.10 Rest of Asia Pacific
9.4.10.1 Rest of Asia Pacific Flexible PCB Market Estimates and Forecasts, By Type (2020-2032) (USD BILLION)
9.4.10.2 Rest of Asia Pacific Flexible PCB Market Estimates and Forecasts, By End Use (2020-2032) (USD BILLION)
9.5 Middle East and Africa
9.5.1 Middle East
9.5.1.1 Trends Analysis
9.5.1.2 Middle East Flexible PCB Market Estimates and Forecasts, by Country (2020-2032) (USD BILLION)
9.5.1.3 Middle East Flexible PCB Market Estimates and Forecasts, By Type (2020-2032) (USD BILLION)
9.5.1.4 Middle East Flexible PCB Market Estimates and Forecasts, By End Use (2020-2032) (USD BILLION)
9.5.1.5 UAE
9.5.1.5.1 UAE Flexible PCB Market Estimates and Forecasts, By Type (2020-2032) (USD BILLION)
9.5.1.5.2 UAE Flexible PCB Market Estimates and Forecasts, By End Use (2020-2032) (USD BILLION)
9.5.1.6 Egypt
9.5.1.6.1 Egypt Flexible PCB Market Estimates and Forecasts, By Type (2020-2032) (USD BILLION)
9.5.1.6.2 Egypt Flexible PCB Market Estimates and Forecasts, By End Use (2020-2032) (USD BILLION)
9.5.1.7 Saudi Arabia
9.5.1.7.1 Saudi Arabia Flexible PCB Market Estimates and Forecasts, By Type (2020-2032) (USD BILLION)
9.5.1.7.2 Saudi Arabia Flexible PCB Market Estimates and Forecasts, By End Use (2020-2032) (USD BILLION)
9.5.1.8 Qatar
9.5.1.8.1 Qatar Flexible PCB Market Estimates and Forecasts, By Type (2020-2032) (USD BILLION)
9.5.1.8.2 Qatar Flexible PCB Market Estimates and Forecasts, By End Use (2020-2032) (USD BILLION)
9.5.1.9 Rest of Middle East
9.5.1.9.1 Rest of Middle East Flexible PCB Market Estimates and Forecasts, By Type (2020-2032) (USD BILLION)
9.5.1.9.2 Rest of Middle East Flexible PCB Market Estimates and Forecasts, By End Use (2020-2032) (USD BILLION)
9.5.2 Africa
9.5.2.1 Trends Analysis
9.5.2.2 Africa Flexible PCB Market Estimates and Forecasts, by Country (2020-2032) (USD BILLION)
9.5.2.3 Africa Flexible PCB Market Estimates and Forecasts, By Type (2020-2032) (USD BILLION)
9.5.2.4 Africa Flexible PCB Market Estimates and Forecasts, By End Use (2020-2032) (USD BILLION)
9.5.2.5 South Africa
9.5.2.5.1 South Africa Flexible PCB Market Estimates and Forecasts, By Type (2020-2032) (USD BILLION)
9.5.2.5.2 South Africa Flexible PCB Market Estimates and Forecasts, By End Use (2020-2032) (USD BILLION)
9.5.2.6 Nigeria
9.5.2.6.1 Nigeria Flexible PCB Market Estimates and Forecasts, By Type (2020-2032) (USD BILLION)
9.5.2.6.2 Nigeria Flexible PCB Market Estimates and Forecasts, By End Use (2020-2032) (USD BILLION)
9.5.2.7 Rest of Africa
9.5.2.7.1 Rest of Africa Flexible PCB Market Estimates and Forecasts, By Type (2020-2032) (USD BILLION)
9.5.2.7.2 Rest of Africa Flexible PCB Market Estimates and Forecasts, By End Use (2020-2032) (USD BILLION)
9.6 Latin America
9.6.1 Trends Analysis
9.6.2 Latin America Flexible PCB Market Estimates and Forecasts, by Country (2020-2032) (USD BILLION)
9.6.3 Latin America Flexible PCB Market Estimates and Forecasts, By Type (2020-2032) (USD BILLION)
9.6.4 Latin America Flexible PCB Market Estimates and Forecasts, By End Use (2020-2032) (USD BILLION)
9.6.5 Brazil
9.6.5.1 Brazil Flexible PCB Market Estimates and Forecasts, By Type (2020-2032) (USD BILLION)
9.6.5.2 Brazil Flexible PCB Market Estimates and Forecasts, By End Use (2020-2032) (USD BILLION)
9.6.6 Argentina
9.6.6.1 Argentina Flexible PCB Market Estimates and Forecasts, By Type (2020-2032) (USD BILLION)
9.6.6.2 Argentina Flexible PCB Market Estimates and Forecasts, By End Use (2020-2032) (USD BILLION)
9.6.7 Colombia
9.6.7.1 Colombia Flexible PCB Market Estimates and Forecasts, By Type (2020-2032) (USD BILLION)
9.6.7.2 Colombia Flexible PCB Market Estimates and Forecasts, By End Use (2020-2032) (USD BILLION)
9.6.8 Rest of Latin America
9.6.8.1 Rest of Latin America Flexible PCB Market Estimates and Forecasts, By Type (2020-2032) (USD BILLION)
9.6.8.2 Rest of Latin America Flexible PCB Market Estimates and Forecasts, By End Use (2020-2032) (USD BILLION)
10. Company Profiles
10.1 Nippon Mektron
10.1.1 Company Overview
10.1.2 Financial
10.1.3 Products/ Services Offered
110.1.4 SWOT Analysis
10.2 Zhen Ding Technology Holding Ltd
10.2.1 Company Overview
10.2.2 Financial
10.2.3 Products/ Services Offered
10.2.4 SWOT Analysis
10.3 Sumitomo Electric Industries
10.3.1 Company Overview
10.3.2 Financial
10.3.3 Products/ Services Offered
10.3.4 SWOT Analysis
10.4 Interflex Co. Ltd
10.4.1 Company Overview
10.4.2 Financial
10.4.3 Products/ Services Offered
10.4.4 SWOT Analysis
10.5 Career Technology (Mfg.) Co., Ltd
10.5.1 Company Overview
10.5.2 Financial
10.5.3 Products/ Services Offered
10.5.4 SWOT Analysis
10.6 Ichia Technologies Inc
10.6.1 Company Overview
10.6.2 Financial
10.6.3 Products/ Services Offered
10.6.4 SWOT Analysis
10.7 Multi-Fineline Electronix, Inc. (MFLEX)
10.7.1 Company Overview
10.7.2 Financial
10.7.3 Products/ Services Offered
10.7.4 SWOT Analysis
10.8 NewFlex Technology Co., Ltd
10.8.1 Company Overview
10.8.2 Financial
10.8.3 Products/ Services Offered
10.8.4 SWOT Analysis
10.9 FLEXium Interconnect, Inc
10.9.1 Company Overview
10.9.2 Financial
10.9.3 Products/ Services Offered
10.9.4 SWOT Analysis
10.10 Daeduck GDS
10.9.1 Company Overview
10.9.2 Financial
10.9.3 Products/ Services Offered
10.9.4 SWOT Analysis
11. Use Cases and Best Practices
12. Conclusion
An accurate research report requires proper strategizing as well as implementation. There are multiple factors involved in the completion of good and accurate research report and selecting the best methodology to compete the research is the toughest part. Since the research reports we provide play a crucial role in any company’s decision-making process, therefore we at SNS Insider always believe that we should choose the best method which gives us results closer to reality. This allows us to reach at a stage wherein we can provide our clients best and accurate investment to output ratio.
Each report that we prepare takes a timeframe of 350-400 business hours for production. Starting from the selection of titles through a couple of in-depth brain storming session to the final QC process before uploading our titles on our website we dedicate around 350 working hours. The titles are selected based on their current market cap and the foreseen CAGR and growth.
The 5 steps process:
Step 1: Secondary Research:
Secondary Research or Desk Research is as the name suggests is a research process wherein, we collect data through the readily available information. In this process we use various paid and unpaid databases which our team has access to and gather data through the same. This includes examining of listed companies’ annual reports, Journals, SEC filling etc. Apart from this our team has access to various associations across the globe across different industries. Lastly, we have exchange relationships with various university as well as individual libraries.
Step 2: Primary Research
When we talk about primary research, it is a type of study in which the researchers collect relevant data samples directly, rather than relying on previously collected data. This type of research is focused on gaining content specific facts that can be sued to solve specific problems. Since the collected data is fresh and first hand therefore it makes the study more accurate and genuine.
We at SNS Insider have divided Primary Research into 2 parts.
Part 1 wherein we interview the KOLs of major players as well as the upcoming ones across various geographic regions. This allows us to have their view over the market scenario and acts as an important tool to come closer to the accurate market numbers. As many as 45 paid and unpaid primary interviews are taken from both the demand and supply side of the industry to make sure we land at an accurate judgement and analysis of the market.
This step involves the triangulation of data wherein our team analyses the interview transcripts, online survey responses and observation of on filed participants. The below mentioned chart should give a better understanding of the part 1 of the primary interview.
Part 2: In this part of primary research the data collected via secondary research and the part 1 of the primary research is validated with the interviews from individual consultants and subject matter experts.
Consultants are those set of people who have at least 12 years of experience and expertise within the industry whereas Subject Matter Experts are those with at least 15 years of experience behind their back within the same space. The data with the help of two main processes i.e., FGDs (Focused Group Discussions) and IDs (Individual Discussions). This gives us a 3rd party nonbiased primary view of the market scenario making it a more dependable one while collation of the data pointers.
Step 3: Data Bank Validation
Once all the information is collected via primary and secondary sources, we run that information for data validation. At our intelligence centre our research heads track a lot of information related to the market which includes the quarterly reports, the daily stock prices, and other relevant information. Our data bank server gets updated every fortnight and that is how the information which we collected using our primary and secondary information is revalidated in real time.
Step 4: QA/QC Process
After all the data collection and validation our team does a final level of quality check and quality assurance to get rid of any unwanted or undesired mistakes. This might include but not limited to getting rid of the any typos, duplication of numbers or missing of any important information. The people involved in this process include technical content writers, research heads and graphics people. Once this process is completed the title gets uploader on our platform for our clients to read it.
Step 5: Final QC/QA Process:
This is the last process and comes when the client has ordered the study. In this process a final QA/QC is done before the study is emailed to the client. Since we believe in giving our clients a good experience of our research studies, therefore, to make sure that we do not lack at our end in any way humanly possible we do a final round of quality check and then dispatch the study to the client.
Key Segments:
By Type
Single Sided FPCBs
Double Sided FPCBS
Multilayer FPCBS
Rigid-Flex PCBS
Others
By End Use
Industrial Electronics
Aerospace & Defense
IT & Telecom
Automotive
Consumer Electronics
Other
Request for Segment Customization as per your Business Requirement: Segment Customization Request
Regional Coverage:
North America
US
Canada
Mexico
Europe
Eastern Europe
Poland
Romania
Hungary
Turkey
Rest of Eastern Europe
Western Europe
Germany
France
UK
Italy
Spain
Netherlands
Switzerland
Austria
Rest of Western Europe
Asia Pacific
China
India
Japan
South Korea
Vietnam
Singapore
Australia
Rest of Asia Pacific
Middle East & Africa
Middle East
UAE
Egypt
Saudi Arabia
Qatar
Rest of Middle East
Africa
Nigeria
South Africa
Rest of Africa
Latin America
Brazil
Argentina
Colombia
Rest of Latin America
Request for Country Level Research Report: Country Level Customization Request
Available Customization
With the given market data, SNS Insider offers customization as per the company’s specific needs. The following customization options are available for the report:
Detailed Volume Analysis
Criss-Cross segment analysis (e.g. Product X Application)
Competitive Product Benchmarking
Geographic Analysis
Additional countries in any of the regions
Customized Data Representation
Detailed analysis and profiling of additional market players
Horticulture Lighting Market Size was valued at USD 3.76 billion in 2023, and is expected to reach USD 23.08 billion by 2032, and grow at a CAGR of 22.34% over the forecast period 2024-2032.
The Counterfeit Money Detection Market was valued at USD 3.55 billion in 2023 and is expected to reach USD 5.46 billion by 2032, growing at a CAGR of 4.90% from 2024 to 2032.
The IO-Link Market was valued at USD 13.9 Billion in 2023 and is expected to reach USD 70.5 Billion by 2032, growing at a CAGR of 19.79% from 2024-2032.
The Less Than or Equal to 5 mm Square Pressure Sensor Market size was valued at USD 1.18 Billion in 2023 and expected to grow at a CAGR of 6.53% by 2024-2032.
The Smoke Detector Market Size was valued at USD 2.20 billion in 2023 and is expected to grow at a CAGR of 7.81% to reach USD 4.32 billion by 2032.
The Smart Advertising Market Size was valued at USD 1.64 billion in 2023 and is expected to grow at a CAGR of 11.50% to reach USD 4.36 billion by 2032.
Hi! Click one of our member below to chat on Phone