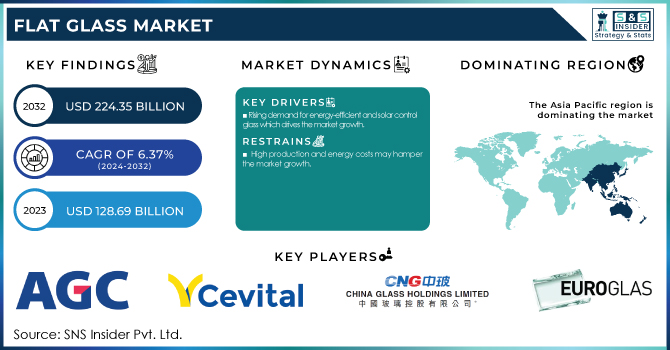
The Flat Glass Market size was USD 128.69 Billion in 2023 and is expected to reach USD 224.35 Billion by 2032 and grow at a CAGR of 6.37% over the forecast period of 2024-2032.
To get more information on Flat Glass Market - Request Free Sample Report
The flat glass market report provides a comprehensive analysis of production capacity and utilization across key manufacturing countries, raw material price trends for silica sand, soda ash, and limestone, and the regulatory landscape shaping the industry in 2023. It evaluates environmental metrics, including CO₂ emissions, recycling rates, and sustainability initiatives, alongside R&D investments in energy-efficient and smart glass innovations. Additionally, the report covers the adoption of digital manufacturing solutions, such as AI-driven quality control and automated monitoring, highlighting regional adoption trends.
Drivers
Rising demand for energy-efficient and solar control glass which drives the market growth.
Due to increasing energy conservation needs and concerns about environmental protection, the FTG market is growing due to increased demand for energy-efficient and solar control glass. The low emissivity (Low-E) and solar control glass reduce heat transfer thus increasing the energy efficiency of buildings and vehicles by decreasing the reliance on heating and cooling systems. National governments are implementing rigid building energy codes like the EU's Energy Performance of Buildings Directive (EPBD) and U.S. Energy Star program that require the use of energy-efficient materials helping this market gain further traction. Moreover, the increased urbanization and the growth in green building projects in countries such as China, India, and Germany are driving the market for high-tech glass solutions. Solar control glass is also being increasingly used to reduce solar heat gain for passenger comfort and increased fuel economy (including in electric vehicles (EVs)) in the automotive sector. All these factors work together in producing energy-efficient, solar control glass which is an essential part of modern construction and mobility, driving a robust growth of the market.
Restraint
High production and energy costs may hamper the market growth.
This high production cost and energy intensive manufacturing process is a major restraint in the Flat Glass Market as glass production requires extensive heating and melting processes. The manufacture of flat glass comprises furnace processes exceeding 1500°C and consuming a considerable amount of energy, rendering this industry vulnerable to increasing fuel prices and electricity costs. Pressure is also mounting from carbon emission regulations in the EU, North America and other key regions focusing on policies like the EU Emissions Trading System (EU ETS) placing extra costs on high-energy-consuming industries. In addition, the production cost is affected by volatility in gas and coal prices the two main energy sources for glass-making. To shift towards sustainable and low-carbon modes of production, companies will also require additional capital expenditures on advanced energy-efficient technologies and alternative energy sources. Such challenges make cost management highly important for players operating in the market which indirectly also affects profitability and pricing strategy involved in the industry.
Opportunity
Growing adoption of smart and electrochromic glass create an opportunity in the market.
Adoption of smart & electrochromic glass, which needs future-technology and energetic products in glazing needs, are major opportunity in the segmentation list of flat glass market. After that, Electrochromic glass is also becoming increasingly popular in commercial buildings, residential buildings, as well as high-end automotives, which needs automatic transparency changing depending on external conditions as it can reduce glare, temperature, and energy. Global adoption of smart glass is being facilitated by the governments and regulatory authorities who are promoting sustainability by issuing green building policies and mandates such as the LEED (Leadership in Energy and Environmental Design) program in the U.S. and the Near-Zero Energy Building (NZEB) standards in EU. The automotive sector, especially electric vehicle (EV) makers, are rapidly opting for electrochromic glass in sunroofs, windows, and windshields to provide thermal comfort to passengers and also boost energy efficiency. Increasing focus on AI-based smart glass control systems and HEVs, along with nanotechnology coatings, will also propel the market growth, offering beneficial opportunities for domestic, commercial, and institutional glass manufacturers, as well as technology providers and energy-efficient solutions developers.
Challenges
Fluctuating raw material prices and supply chain disruptions may create a challenge for the market.
The volatility in the raw material prices and the disruption in the supply chain is a major challenge for the flat glass market that globally affects the production cost and the market. Given the increasing restrictions in the operating environment for mining, the environmental and industry regulations, as well as regional geopolitical tensions, the prices of key raw materials used in flat glass manufacturing, such as silica sand, soda ash, and limestone, are subject to high volatility. China, a significant soda ash supplier, is also enforcing strict environmental policies, impacting supply and creating price variances worldwide. Moreover, the trade restrictions, transportation bottlenecks, and geopolitical conflicts such as the Russia-Ukraine war have caused supply chain disruptions, resulting in delays in raw material procurement and escalating logistics cost.
By Product
Tempered held the largest market share around 38% in 2023. It is owing to its high-strength, safety, and security features, and usages related to a wide range of end-use range. It is also approximately four to five times stronger than standard annealed glass and is therefore the glass of choice for construction automotive and consumer electronics. Not only does it make the glass safe as it breaks into small, dull pieces instead of sharp shards, but it also helps the glass meet even the most stringent codes of safety in buildings and automotive regulations in North America, Europe, and the Asia-Pacific. A boom in the construction industry, especially in commercial buildings and big buildings has caused the need for tempered glass in the windows, facades, and doors. Moreover, due to the rising production of vehicles and demand for safety standards, tempered glass is also the best-suited tempered glass for side and rear windows in the automotive sector.
By End-Use
Architectural held the largest market share around 52% in 2023. This is due to high consumption in residential, commercial, and industrial construction activities. Rising focus on renewable buildings, new facilities, and green building materials has, in turn, bolstered demand for Low-E glass, solar control glass, and IGUs across the globe. In particular, government initiatives and programs promoting green buildings and effective building regulations, such as the Energy Performance of Buildings Directive (EPBD) in Europe and Leadership in Energy and Environmental Design (LEED) certification in North America, have contributed to this uptake.
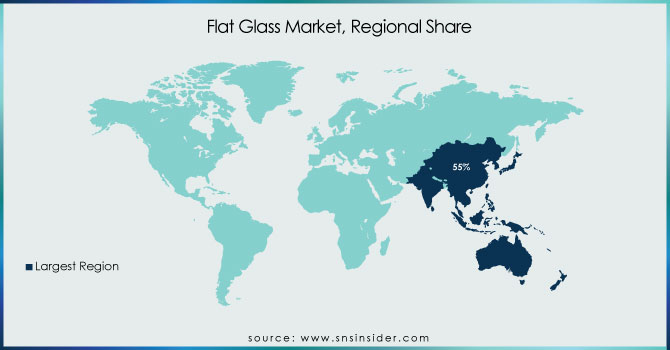
Asia Pacific held the largest market share around 55% in 2023. The massive infrastructure development is more likely due to government support and foreign investments in residential, commercial & industrial projects in countries like China, India, Japan & South Korea. China has become the number one in the manufacture of industrial processed glass without allowing any decline, it is the biggest global market for flat glass products and it still leads by volume alongside the highest demand for it because of its high-volume manufacturing and cost-effective production. Furthermore, due to growing vehicle production, coupled with the transition from conventional vehicles to electric vehicles (EVs), the surging automotive sector in the region has been generating promising demand for tempered, laminated, and solar control glass. It also excels in solar installations, thus creating demand for solar glass to meet renewable energy targets. Additionally, the dominance of the region has also strengthened due to factors such as favorable government policies, low labor costs, and developments in smart glass technology have given rise to the smart windows market during the projected period.
North America held a significant market share in the market. It is primarily due to booming demand from the construction, automotive, and renewable energy industries. Established residential and commercial infrastructure market in the region with growing investments for smart buildings, energy-efficient windows, and glass facades Low-E glass and insulated glass units (IGUs) have gained popularity due to government regulations, including certified Leadership in Energy and Environmental Design (LEED) and energy efficiency by the U.S. Moreover, the automotive sector is another significant regional market in the U.S. and Canada, where tough regulations on automobile safety boost tempered and laminated glass adoption. An emerging solar energy sector from the region is further pushing the demand for solar control and photovoltaic glass globally.
Get Customized Report as per Your Business Requirement - Enquiry Now
Key Players:
AGC Inc. (Planibel, Solarshield)
Central Glass Limited (MiruGlas, Coolverre)
CEVITAL Group (Evergrow, Clearlite)
China Glass Holding Ltd. (Jinjing Ultra Clear, EnergyPlus)
Euroglas (Silverstar, Luxguard)
Fuyao Glass Industry Group Co., Ltd. (Fuyao Float, Fuyao Solar)
Guardian Industries (SunGuard, ClimaGuard)
Nippon Sheet Glass Co., Ltd. (Pilkington Optiwhite, Pilkington Suncool)
Saint-Gobain (Planitherm, SGG Bioclean)
Şişecam Group (Şişecam Tentesol, Şişecam Low-E)
Vitro (Solarban, Starphire)
Xinyi Glass Holdings (Xinyi Energy-Saver, Xinyi UltraClear)
Taiwan Glass Industry Corporation (TGI SunEnergy, TGI SuperClear)
CSG Holding Co., Ltd. (CSG Ultra Low-E, CSG SmartGlass)
Interpane Glas Industrie AG (iplus, ipasol)
AGP Group (AGP Defendor, AGP eGlass)
Henan Ancai Hi-Tech Co., Ltd. (Ancai Low-E, Ancai Smart)
Schott AG (Schott Conturan, Schott Pyran)
Jinjing Group (Jinjing Solar, Jinjing Float)
Fuyao Group (Fuyao Acoustic, Fuyao Laminated)
Recent Development:
In 2023, Schott AG announced plans to launch an initial public offering (IPO) for its medical glassware division. This move aims to strengthen its presence in the pharmaceutical packaging market. The company seeks to expand its global footprint and innovation capabilities.
In October 2023, Vitro secured an extended agreement with First Solar to provide advanced glass front sheets for solar panels produced in North America. To support this expansion, the company intends to invest around USD 180 million in facility upgrades. This initiative is projected to generate approximately USD 1.3 billion in additional sales over the next decade.
Report Attributes | Details |
---|---|
Market Size in 2023 |
USD 128.69 Billion |
Market Size by 2032 |
USD 224.35 Billion |
CAGR |
CAGR of 6.37% From 2024 to 2032 |
Base Year |
2023 |
Forecast Period |
2024-2032 |
Historical Data |
2020-2022 |
Report Scope & Coverage |
Market Size, Segments Analysis, Competitive Landscape, Regional Analysis, DROC & SWOT Analysis, Forecast Outlook |
Key Segments |
• By Product (Basic, Tempered, Laminated, Insulated, Others) |
Regional Analysis/Coverage |
North America (US, Canada, Mexico), Europe (Eastern Europe [Poland, Romania, Hungary, Turkey, Rest of Eastern Europe] Western Europe] Germany, France, UK, Italy, Spain, Netherlands, Switzerland, Austria, Rest of Western Europe]), Asia Pacific (China, India, Japan, South Korea, Vietnam, Singapore, Australia, Rest of Asia Pacific), Middle East & Africa (Middle East [UAE, Egypt, Saudi Arabia, Qatar, Rest of Middle East], Africa [Nigeria, South Africa, Rest of Africa], Latin America (Brazil, Argentina, Colombia, Rest of Latin America) |
Company Profiles |
AGC Inc., Central Glass Limited, CEVITAL Group, China Glass Holding Ltd., Euroglas, Fuyao Glass Industry Group Co., Ltd., Guardian Industries, Nippon Sheet Glass Co., Ltd., Saint-Gobain, Şişecam Group, Vitro, Xinyi Glass Holdings, Taiwan Glass Industry Corporation, CSG Holding Co., Ltd., Interpane Glas Industrie AG, AGP Group, Henan Ancai Hi-Tech Co., Ltd., Schott AG, Jinjing Group, Fuyao Group |
Ans: The Flat Glass Market was valued at USD 128.69 Billion in 2023.
Ans: The expected CAGR of the global Flat Glass Market during the forecast period is 6.37%.
Ans: Architectural will grow rapidly in the Flat Glass Market from 2024-2032.
Ans: Rising Demand for energy-efficient and solar control glass which drives the market growth.
Ans: Asia Pacific led the Flat Glass Market in the region with the highest revenue share in 2023.
Table Of Contents:
1. Introduction
1.1 Market Definition
1.2 Scope (Inclusion and Exclusions)
1.3 Research Assumptions
2. Executive Summary
2.1 Market Overview a
2.2 Regional Synopsis
2.3 Competitive Summary
3. Research Methodology
3.1 Top-Down Approach
3.2 Bottom-up Approach
3.3. Data Validation
3.4 Primary Interviews
4. Market Dynamics Impact Analysis
3.1 Market Driving Factors Analysis
3.1.2 Drivers
3.1.2 Restraints
3.1.3 Opportunities
3.1.4 Challenges
3.2 PESTLE Analysis
3.3 Porter’s Five Forces Model
5. Statistical Insights and Trends Reporting
5.1 Production Capacity and Utilization, by Country, By Type, 2023
5.2 Feedstock Prices, by Country, By Type, 2023
5.3 Regulatory Impact, by Country, By Type 2023.
5.4 Environmental Metrics: Emissions Data, Waste Management Practices, and Sustainability Initiatives, by Region
5.5 Innovation and R&D, Type, 2023
6. Competitive Landscape
6.1 List of Major Companies, By Region
6.2 Market Share Analysis, By Region
6.3 Product Benchmarking
6.3.1 Product specifications and features
6.3.2 Pricing
6.4 Strategic Initiatives
6.4.1 Marketing and promotional activities
6.4.2 Distribution and Supply Chain Strategies
6.4.3 Expansion Plans and New Product Launches
6.4.4 Strategic partnerships and collaborations
6.5 Technological Advancements
6.6 Market Positioning and Branding
7. Flat Glass Market Segmentation, By Product
7.1 Chapter Overview
7.2 Basic
7.2.1 Basic Trends Analysis (2020-2032)
7.2.2 Basic Market Size Estimates and Forecasts to 2032 (USD Billion)
7.3 Tempered
7.3.1 Tempered Market Trends Analysis (2020-2032)
7.3.2 Tempered Market Size Estimates and Forecasts to 2032 (USD Billion)
7.4 Laminated
7.4.1 Laminated Trends Analysis (2020-2032)
7.4.2 Laminated Market Size Estimates and Forecasts to 2032 (USD Billion)
7.5 Insulated
7.5.1 Insulated Market Trends Analysis (2020-2032)
7.5.2 Insulated Market Size Estimates and Forecasts to 2032 (USD Billion)
7.6 Others
7.6.1 Others Trends Analysis (2020-2032)
7.6.2 Others Market Size Estimates and Forecasts to 2032 (USD Billion)
8. Flat Glass Market Segmentation, by End-Use
8.1 Chapter Overview
8.2 Architectural
8.2.1 Architectural Market Trends Analysis (2020-2032)
8.2.2 Architectural Market Size Estimates and Forecasts to 2032 (USD Billion)
8.3 Automotive
8.3.1 Automotive Market Trends Analysis (2020-2032)
8.3.2 Automotive Market Size Estimates and Forecasts to 2032 (USD Billion)
8.4 Others
8.4.1 Others Market Trends Analysis (2020-2032)
8.4.2 Others Market Size Estimates and Forecasts to 2032 (USD Billion)
9. Regional Analysis
9.1 Chapter Overview
9.2 North America
9.2.1 Trends Analysis
9.2.2 North America Flat Glass Market Estimates and Forecasts, by Country (2020-2032) (USD Billion)
9.2.3 North America Flat Glass Market Estimates and Forecasts, By Product (2020-2032) (USD Billion)
9.2.4 North America Flat Glass Market Estimates and Forecasts, by End-Use (2020-2032) (USD Billion)
9.2.5 USA
9.2.5.1 USA Flat Glass Market Estimates and Forecasts, By Product (2020-2032) (USD Billion)
9.2.5.2 USA Flat Glass Market Estimates and Forecasts, by End-Use (2020-2032) (USD Billion)
9.2.6 Canada
9.2.6.1 Canada Flat Glass Market Estimates and Forecasts, By Product (2020-2032) (USD Billion)
9.2.6.2 Canada Flat Glass Market Estimates and Forecasts, by End-Use (2020-2032) (USD Billion)
9.2.7 Mexico
9.2.7.1 Mexico Flat Glass Market Estimates and Forecasts, By Product (2020-2032) (USD Billion)
9.2.7.2 Mexico Flat Glass Market Estimates and Forecasts, by End-Use (2020-2032) (USD Billion)
9.3 Europe
9.3.1 Eastern Europe
9.3.1.1 Trends Analysis
9.3.1.2 Eastern Europe Flat Glass Market Estimates and Forecasts, by Country (2020-2032) (USD Billion)
9.3.1.3 Eastern Europe Flat Glass Market Estimates and Forecasts, By Product (2020-2032) (USD Billion)
9.3.1.4 Eastern Europe Flat Glass Market Estimates and Forecasts, by End-Use (2020-2032) (USD Billion)
9.3.1.5 Poland
9.3.1.5.1 Poland Flat Glass Market Estimates and Forecasts, By Product (2020-2032) (USD Billion)
9.3.1.5.2 Poland Flat Glass Market Estimates and Forecasts, by End-Use (2020-2032) (USD Billion)
9.3.1.6 Romania
9.3.1.6.1 Romania Flat Glass Market Estimates and Forecasts, By Product (2020-2032) (USD Billion)
9.3.1.6.2 Romania Flat Glass Market Estimates and Forecasts, by End-Use (2020-2032) (USD Billion)
9.3.1.7 Hungary
9.3.1.7.1 Hungary Flat Glass Market Estimates and Forecasts, By Product (2020-2032) (USD Billion)
9.3.1.7.2 Hungary Flat Glass Market Estimates and Forecasts, by End-Use (2020-2032) (USD Billion)
9.3.1.8 Turkey
9.3.1.8.1 Turkey Flat Glass Market Estimates and Forecasts, By Product (2020-2032) (USD Billion)
9.3.1.8.2 Turkey Flat Glass Market Estimates and Forecasts, by End-Use (2020-2032) (USD Billion)
9.3.1.9 Rest of Eastern Europe
9.3.1.9.1 Rest of Eastern Europe Flat Glass Market Estimates and Forecasts, By Product (2020-2032) (USD Billion)
9.3.1.9.2 Rest of Eastern Europe Flat Glass Market Estimates and Forecasts, by End-Use (2020-2032) (USD Billion)
9.3.2 Western Europe
9.3.2.1 Trends Analysis
9.3.2.2 Western Europe Flat Glass Market Estimates and Forecasts, by Country (2020-2032) (USD Billion)
9.3.2.3 Western Europe Flat Glass Market Estimates and Forecasts, By Product (2020-2032) (USD Billion)
9.3.2.4 Western Europe Flat Glass Market Estimates and Forecasts, by End-Use (2020-2032) (USD Billion)
9.3.2.5 Germany
9.3.2.5.1 Germany Flat Glass Market Estimates and Forecasts, By Product (2020-2032) (USD Billion)
9.3.2.5.2 Germany Flat Glass Market Estimates and Forecasts, by End-Use (2020-2032) (USD Billion)
9.3.2.6 France
9.3.2.6.1 France Flat Glass Market Estimates and Forecasts, By Product (2020-2032) (USD Billion)
9.3.2.6.2 France Flat Glass Market Estimates and Forecasts, by End-Use (2020-2032) (USD Billion)
9.3.2.7 UK
9.3.2.7.1 UK Flat Glass Market Estimates and Forecasts, By Product (2020-2032) (USD Billion)
9.3.2.7.2 UK Flat Glass Market Estimates and Forecasts, by End-Use (2020-2032) (USD Billion)
9.3.2.8 Italy
9.3.2.8.1 Italy Flat Glass Market Estimates and Forecasts, By Product (2020-2032) (USD Billion)
9.3.2.8.2 Italy Flat Glass Market Estimates and Forecasts, by End-Use (2020-2032) (USD Billion)
9.3.2.9 Spain
9.3.2.9.1 Spain Flat Glass Market Estimates and Forecasts, By Product (2020-2032) (USD Billion)
9.3.2.9.2 Spain Flat Glass Market Estimates and Forecasts, by End-Use (2020-2032) (USD Billion)
9.3.2.10 Netherlands
9.3.2.10.1 Netherlands Flat Glass Market Estimates and Forecasts, By Product (2020-2032) (USD Billion)
9.3.2.10.2 Netherlands Flat Glass Market Estimates and Forecasts, by End-Use (2020-2032) (USD Billion)
9.3.2.11 Switzerland
9.3.2.11.1 Switzerland Flat Glass Market Estimates and Forecasts, By Product (2020-2032) (USD Billion)
9.3.2.11.2 Switzerland Flat Glass Market Estimates and Forecasts, by End-Use (2020-2032) (USD Billion)
9.3.2.12 Austria
9.3.2.12.1 Austria Flat Glass Market Estimates and Forecasts, By Product (2020-2032) (USD Billion)
9.3.2.12.2 Austria Flat Glass Market Estimates and Forecasts, by End-Use (2020-2032) (USD Billion)
9.3.2.13 Rest of Western Europe
9.3.2.13.1 Rest of Western Europe Flat Glass Market Estimates and Forecasts, By Product (2020-2032) (USD Billion)
9.3.2.13.2 Rest of Western Europe Flat Glass Market Estimates and Forecasts, by End-Use (2020-2032) (USD Billion)
9.4 Asia Pacific
9.4.1 Trends Analysis
9.4.2 Asia Pacific Flat Glass Market Estimates and Forecasts, by Country (2020-2032) (USD Billion)
9.4.3 Asia Pacific Flat Glass Market Estimates and Forecasts, By Product (2020-2032) (USD Billion)
9.4.4 Asia Pacific Flat Glass Market Estimates and Forecasts, by End-Use (2020-2032) (USD Billion)
9.4.5 China
9.4.5.1 China Flat Glass Market Estimates and Forecasts, By Product (2020-2032) (USD Billion)
9.4.5.2 China Flat Glass Market Estimates and Forecasts, by End-Use (2020-2032) (USD Billion)
9.4.6 India
9.4.5.1 India Flat Glass Market Estimates and Forecasts, By Product (2020-2032) (USD Billion)
9.4.5.2 India Flat Glass Market Estimates and Forecasts, by End-Use (2020-2032) (USD Billion)
9.4.5 Japan
9.4.5.1 Japan Flat Glass Market Estimates and Forecasts, By Product (2020-2032) (USD Billion)
9.4.5.2 Japan Flat Glass Market Estimates and Forecasts, by End-Use (2020-2032) (USD Billion)
9.4.6 South Korea
9.4.6.1 South Korea Flat Glass Market Estimates and Forecasts, By Product (2020-2032) (USD Billion)
9.4.6.2 South Korea Flat Glass Market Estimates and Forecasts, by End-Use (2020-2032) (USD Billion)
9.4.7 Vietnam
9.4.7.1 Vietnam Flat Glass Market Estimates and Forecasts, By Product (2020-2032) (USD Billion)
9.2.7.2 Vietnam Flat Glass Market Estimates and Forecasts, by End-Use (2020-2032) (USD Billion)
9.4.8 Singapore
9.4.8.1 Singapore Flat Glass Market Estimates and Forecasts, By Product (2020-2032) (USD Billion)
9.4.8.2 Singapore Flat Glass Market Estimates and Forecasts, by End-Use (2020-2032) (USD Billion)
9.4.9 Australia
9.4.9.1 Australia Flat Glass Market Estimates and Forecasts, By Product (2020-2032) (USD Billion)
9.4.9.2 Australia Flat Glass Market Estimates and Forecasts, by End-Use (2020-2032) (USD Billion)
9.4.10 Rest of Asia Pacific
9.4.10.1 Rest of Asia Pacific Flat Glass Market Estimates and Forecasts, By Product (2020-2032) (USD Billion)
9.4.10.2 Rest of Asia Pacific Flat Glass Market Estimates and Forecasts, by End-Use (2020-2032) (USD Billion)
9.5 Middle East and Africa
9.5.1 Middle East
9.5.1.1 Trends Analysis
9.5.1.2 Middle East Flat Glass Market Estimates and Forecasts, by Country (2020-2032) (USD Billion)
9.5.1.3 Middle East Flat Glass Market Estimates and Forecasts, By Product (2020-2032) (USD Billion)
9.5.1.4 Middle East Flat Glass Market Estimates and Forecasts, by End-Use (2020-2032) (USD Billion)
9.5.1.5 UAE
9.5.1.5.1 UAE Flat Glass Market Estimates and Forecasts, By Product (2020-2032) (USD Billion)
9.5.1.5.2 UAE Flat Glass Market Estimates and Forecasts, by End-Use (2020-2032) (USD Billion)
9.5.1.6 Egypt
9.5.1.6.1 Egypt Flat Glass Market Estimates and Forecasts, By Product (2020-2032) (USD Billion)
9.5.1.6.2 Egypt Flat Glass Market Estimates and Forecasts, by End-Use (2020-2032) (USD Billion)
9.5.1.7 Saudi Arabia
9.5.1.7.1 Saudi Arabia Flat Glass Market Estimates and Forecasts, By Product (2020-2032) (USD Billion)
9.5.1.7.2 Saudi Arabia Flat Glass Market Estimates and Forecasts, by End-Use (2020-2032) (USD Billion)
9.5.1.8 Qatar
9.5.1.8.1 Qatar Flat Glass Market Estimates and Forecasts, By Product (2020-2032) (USD Billion)
9.5.1.8.2 Qatar Flat Glass Market Estimates and Forecasts, by End-Use (2020-2032) (USD Billion)
9.5.1.9 Rest of Middle East
9.5.1.9.1 Rest of Middle East Flat Glass Market Estimates and Forecasts, By Product (2020-2032) (USD Billion)
9.5.1.9.2 Rest of Middle East Flat Glass Market Estimates and Forecasts, by End-Use (2020-2032) (USD Billion)
9.5.2 Africa
9.5.2.1 Trends Analysis
9.5.2.2 Africa Flat Glass Market Estimates and Forecasts, by Country (2020-2032) (USD Billion)
9.5.2.3 Africa Flat Glass Market Estimates and Forecasts, By Product (2020-2032) (USD Billion)
9.5.2.4 Africa Flat Glass Market Estimates and Forecasts, by End-Use (2020-2032) (USD Billion)
9.5.2.5 South Africa
9.5.2.5.1 South Africa Flat Glass Market Estimates and Forecasts, By Product (2020-2032) (USD Billion)
9.5.2.5.2 South Africa Flat Glass Market Estimates and Forecasts, by End-Use (2020-2032) (USD Billion)
9.5.2.6 Nigeria
9.5.2.6.1 Nigeria Flat Glass Market Estimates and Forecasts, By Product (2020-2032) (USD Billion)
9.5.2.6.2 Nigeria Flat Glass Market Estimates and Forecasts, by End-Use (2020-2032) (USD Billion)
9.6 Latin America
9.6.1 Trends Analysis
9.6.2 Latin America Flat Glass Market Estimates and Forecasts, by Country (2020-2032) (USD Billion)
9.6.3 Latin America Flat Glass Market Estimates and Forecasts, By Product (2020-2032) (USD Billion)
9.6.4 Latin America Flat Glass Market Estimates and Forecasts, by End-Use (2020-2032) (USD Billion)
9.6.5 Brazil
9.6.5.1 Brazil Flat Glass Market Estimates and Forecasts, By Product (2020-2032) (USD Billion)
9.6.5.2 Brazil Flat Glass Market Estimates and Forecasts, by End-Use (2020-2032) (USD Billion)
9.6.6 Argentina
9.6.6.1 Argentina Flat Glass Market Estimates and Forecasts, By Product (2020-2032) (USD Billion)
9.6.6.2 Argentina Flat Glass Market Estimates and Forecasts, by End-Use (2020-2032) (USD Billion)
9.6.7 Colombia
9.6.7.1 Colombia Flat Glass Market Estimates and Forecasts, By Product (2020-2032) (USD Billion)
9.6.7.2 Colombia Flat Glass Market Estimates and Forecasts, by End-Use (2020-2032) (USD Billion)
9.6.8 Rest of Latin America
9.6.8.1 Rest of Latin America Flat Glass Market Estimates and Forecasts, By Product (2020-2032) (USD Billion)
9.6.8.2 Rest of Latin America Flat Glass Market Estimates and Forecasts, by End-Use (2020-2032) (USD Billion)
10. Company Profiles
10.1 AGC Inc.
10.1.1 Company Overview
10.1.2 Financial
10.1.3 Product / Services Offered
10.1.4 SWOT Analysis
10.2 Central Glass Limited
10.2.1 Company Overview
10.2.2 Financial
10.2.3 Product/ Services Offered
10.2.4 SWOT Analysis
10.3 CEVITAL Group
10.3.1 Company Overview
10.3.2 Financial
10.3.3 Product/ Services Offered
10.3.4 SWOT Analysis
10.4 China Glass Holding Ltd.
10.4.1 Company Overview
10.4.2 Financial
10.4.3 Product/ Services Offered
10.4.4 SWOT Analysis
10.5 Euroglas
10.5.1 Company Overview
10.5.2 Financial
10.5.3 Product/ Services Offered
10.5.4 SWOT Analysis
10.6 Fuyao Glass Industry Group Co., Ltd.
10.6.1 Company Overview
10.6.2 Financial
10.6.3 Product/ Services Offered
10.6.4 SWOT Analysis
10.7 Guardian Industries
10.7.1 Company Overview
10.7.2 Financial
10.7.3 Product/ Services Offered
10.7.4 SWOT Analysis
10.8 Nippon Sheet Glass Co., Ltd.
10.8.1 Company Overview
10.8.2 Financial
10.8.3 Product/ Services Offered
10.8.4 SWOT Analysis
10.9 Saint-Gobain
10.9.1 Company Overview
10.9.2 Financial
10.9.3 Product/ Services Offered
10.9.4 SWOT Analysis
10.10 CSG Holding Co., Ltd.
10.10.1 Company Overview
10.10.2 Financial
10.10.3 Product/ Services Offered
10.10.4 SWOT Analysis
11. Use Cases and Best Practices
12. Conclusion
An accurate research report requires proper strategizing as well as implementation. There are multiple factors involved in the completion of good and accurate research report and selecting the best methodology to compete the research is the toughest part. Since the research reports we provide play a crucial role in any company’s decision-making process, therefore we at SNS Insider always believe that we should choose the best method which gives us results closer to reality. This allows us to reach at a stage wherein we can provide our clients best and accurate investment to output ratio.
Each report that we prepare takes a timeframe of 350-400 business hours for production. Starting from the selection of titles through a couple of in-depth brain storming session to the final QC process before uploading our titles on our website we dedicate around 350 working hours. The titles are selected based on their current market cap and the foreseen CAGR and growth.
The 5 steps process:
Step 1: Secondary Research:
Secondary Research or Desk Research is as the name suggests is a research process wherein, we collect data through the readily available information. In this process we use various paid and unpaid databases which our team has access to and gather data through the same. This includes examining of listed companies’ annual reports, Journals, SEC filling etc. Apart from this our team has access to various associations across the globe across different industries. Lastly, we have exchange relationships with various university as well as individual libraries.
Step 2: Primary Research
When we talk about primary research, it is a type of study in which the researchers collect relevant data samples directly, rather than relying on previously collected data. This type of research is focused on gaining content specific facts that can be sued to solve specific problems. Since the collected data is fresh and first hand therefore it makes the study more accurate and genuine.
We at SNS Insider have divided Primary Research into 2 parts.
Part 1 wherein we interview the KOLs of major players as well as the upcoming ones across various geographic regions. This allows us to have their view over the market scenario and acts as an important tool to come closer to the accurate market numbers. As many as 45 paid and unpaid primary interviews are taken from both the demand and supply side of the industry to make sure we land at an accurate judgement and analysis of the market.
This step involves the triangulation of data wherein our team analyses the interview transcripts, online survey responses and observation of on filed participants. The below mentioned chart should give a better understanding of the part 1 of the primary interview.
Part 2: In this part of primary research the data collected via secondary research and the part 1 of the primary research is validated with the interviews from individual consultants and subject matter experts.
Consultants are those set of people who have at least 12 years of experience and expertise within the industry whereas Subject Matter Experts are those with at least 15 years of experience behind their back within the same space. The data with the help of two main processes i.e., FGDs (Focused Group Discussions) and IDs (Individual Discussions). This gives us a 3rd party nonbiased primary view of the market scenario making it a more dependable one while collation of the data pointers.
Step 3: Data Bank Validation
Once all the information is collected via primary and secondary sources, we run that information for data validation. At our intelligence centre our research heads track a lot of information related to the market which includes the quarterly reports, the daily stock prices, and other relevant information. Our data bank server gets updated every fortnight and that is how the information which we collected using our primary and secondary information is revalidated in real time.
Step 4: QA/QC Process
After all the data collection and validation our team does a final level of quality check and quality assurance to get rid of any unwanted or undesired mistakes. This might include but not limited to getting rid of the any typos, duplication of numbers or missing of any important information. The people involved in this process include technical content writers, research heads and graphics people. Once this process is completed the title gets uploader on our platform for our clients to read it.
Step 5: Final QC/QA Process:
This is the last process and comes when the client has ordered the study. In this process a final QA/QC is done before the study is emailed to the client. Since we believe in giving our clients a good experience of our research studies, therefore, to make sure that we do not lack at our end in any way humanly possible we do a final round of quality check and then dispatch the study to the client.
Key Segments:
By Product
Basic
Tempered
Laminated
Insulated
Others
By End-Use
Architectural
Automotive
Others
Request for Segment Customization as per your Business Requirement: Segment Customization Request
Regional Coverage:
North America
US
Canada
Mexico
Europe
Eastern Europe
Poland
Romania
Hungary
Turkey
Rest of Eastern Europe
Western Europe
Germany
France
UK
Italy
Spain
Netherlands
Switzerland
Austria
Rest of Western Europe
Asia Pacific
China
India
Japan
South Korea
Vietnam
Singapore
Australia
Rest of Asia Pacific
Middle East & Africa
Middle East
UAE
Egypt
Saudi Arabia
Qatar
Rest of Middle East
Africa
Nigeria
South Africa
Rest of Africa
Latin America
Brazil
Argentina
Colombia
Rest of Latin America
Request for Country Level Research Report: Country Level Customization Request
Available Customization
With the given market data, SNS Insider offers customization as per the company’s specific needs. The following customization options are available for the report:
Product Analysis
Criss-Cross segment analysis (e.g. Product X Application)
Product Matrix which gives a detailed comparison of the product portfolio of each company
Geographic Analysis
Additional countries in any of the regions
Company Information
Detailed analysis and profiling of additional market players (Up to five)
Ethylene Carbonate Market was valued at USD 393.14 Mn in 2023 and is expected to reach USD 661.55 Mn by 2032, growing at a CAGR of 5.96% from 2024-2032.
Furfural Market Size was valued at USD 595.7 million in 2023, and is expected to reach USD 1095.2 million by 2032, growing at a CAGR of 7.0% from 2024 to 2032.
The Textile Finishing Agents Market Size was valued at USD 2.7 Billion in 2023 and is expected to reach USD 4.1 Billion by 2032, growing at a CAGR of 5.1% over the forecast period of 2024-2032.
The Crude Sulfate Turpentine (CST) market is a critical segment within the global chemicals industry, with wide-ranging applications across sectors such as fragrances, pharmaceuticals, and paints.
Steel Wire Market was valued at USD 102.1 billion in 2023 and is expected to reach USD 167.4 billion by 2032, growing at a CAGR of 5.7% from 2024 to 2032.
The Acrylic Processing Aid market size was USD 731.04 million in 2023 and is expected to reach USD 1213.94 million by 2032 and grow at a CAGR of 5.80% over the forecast period of 2024-2032.
Hi! Click one of our member below to chat on Phone