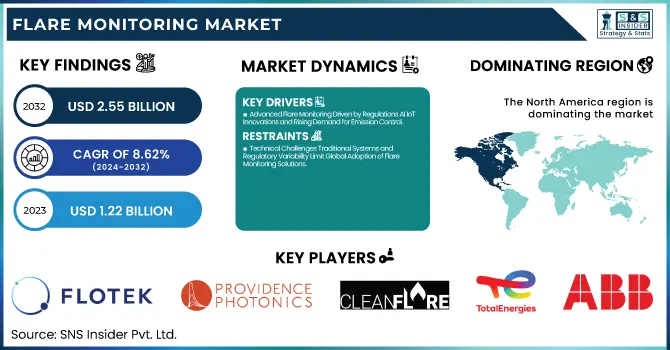
The Flare Monitoring Market Size was valued at USD 1.22 billion in 2023 and is expected to reach USD 2.55 billion by 2032, growing at a CAGR of 8.62% over the forecast period 2024-2032. Flare monitoring market expansion around the world has led in part to the increased acceptance of AI and IoT-based monitoring systems, rising investments for carbon capture and flare gas recovery, and the growing enactment of zero-flaring initiatives. At the same time, satellite-based flare detection and other remote sensing technologies are further increasing global demand for automated emissions monitoring solutions.
To Get more information on Flare Monitoring Market - Request Free Sample Report
In December 2023, the EPA released modernized air emissions standards containing stricter thresholds for flares used in the oil and gas sector to curtail methane emissions. As a result, companies are investing in highly developed flare monitoring systems to comply with the regulations and to mitigate the environmental impact. After the EPA ruling, Flotek Industries said it has seen an uptick in demand for its flare monitoring services, projecting "substantial growth" in 2025.
U.S. Flare Monitoring Market size was valued at USD 0.26 Billion in 2023 and the total Flare Monitoring revenue is expected to grow at a CAGR of 8.34% from 2024 to 2032. Extensive use of thermal cameras, optical gas imaging, and mass spectrometry-based flow monitoring systems are being employed, owing to stringent EPA regulations in the U.S., thus driving the market for flare monitoring in this region as well as refineries, petrochemical plants, and oil & gas facilities.
Key Drivers:
Advanced Flare Monitoring Driven by Regulations AI IoT Innovations and Rising Demand for Emission Control
Reducing greenhouse gas emissions and enhancing air quality by reducing flaring is likely to drive target market growth owing to the stringent environmental regulations. Due to the detailed emission monitoring norms enacted by governments and regulating bodies like the EPA and the European Commission, industrial sectors such as oil & gas, petrochemicals, and chemicals are beginning to employ advanced flare monitoring systems. Moreover, the innovations in infrared (IR) and thermal imaging cameras along with the rise of AI & IoT-based solutions development are improving the precision and effectiveness of flare monitoring systems. The market decline can be in terms of a higher focus on operational safety, a decrease in operational costs, or consumers' inclination towards real-time data analysis which in turn drives the industrial process. Alongside the global energy demand ongoing boom, the expansion of refineries and gas processing plants brings demand for Continuous Emission Monitoring (CEM) to the highest level.
Restrain:
Technical Challenges Traditional Systems and Regulatory Variability Limit Global Adoption of Flare Monitoring Solutions
Technical complexities for the flaring process or flaring systems are one of the most significant restraints for the growth of the market. Although newer, automated solutions are now available, many refineries and chemical plants continue to use traditional flare-monitoring techniques that are still in use today. Lack of awareness, and know-how to operate sophisticated monitoring technologies, also impede adoption, especially in developing parts of the world. This variability of flare gas compositions and environmental conditions with high temperatures and heavy weather exacerbates the flare monitoring accuracies and reliabilities. Regional differences in regulatory compliance have led to inconsistencies in implementation and adoption.
Opportunity:
Remote Monitoring AI Cloud Integration and Industrial Growth Drive Opportunities in the Flare Monitoring Market
The increasing need for remote flare monitoring solutions creating real-time tracking of emissions and predictive maintenance is likely to give major opportunity to the growth of the Flare Monitoring Market. Sustainable energy and carbon-neutral approaches are driving industry leaders to push for complex monitoring systems to reduce their environmental footprint. Moreover, the industrialization and establishment of infrastructures in the Asia-Pacific and the Middle East are fuelling the demand with the need of devices that can monitor flares easily and effectively. A lucrative opportunity lies in offering cloud computing integrations along with AI-powered analytics which help in proactive resource regulation compliance and powerful decision-making.
Challenges:
Real-Time Monitoring Standardization Data Management and Cybersecurity Challenges Impact Flare Monitoring Adoption
One of the major issues in the market is the lack of accurate and real-time monitoring in remote or offshore places where data is difficult to transmit constantly. Standardization across industries and governing regulatory bodies is limited, making system compatibility and integration difficult and preventing the widespread adoption of advanced systems for flare monitoring. Moreover, with large typical emission data in the scope of 1000s of operational and material variables, the average industrial operator faces data management and analysis challenges as they require large processing and analytics capabilities. Another issue of increasing importance in the context of IoT-enabled flare monitoring systems is cybersecurity: cyber threats could seriously jeopardize operational safety and regulatory compliance. Overcoming these hurdles is key to long-term market growth.
By Mounting Method
In 2023, the in-process flare monitoring segment held the largest market share of 56.7% owing to the high adoption of in-process flare monitoring in real-time combustion efficiency assessment in refineries, petrochemical plants, and industrial facilities. In the method, continuous monitoring of emissions from the flare stack is ensured, which allows for meeting stringent environmental regulations and high operational safety. Demand for in-process monitoring systems such as infrared (IR) and gas analyzers is strongly supported by the reliability, accuracy, and convenience of monitoring the process in real time.
The Remote flare monitoring segment is projected to be the fastest-growing segment from 2024 to 2032, due to advancements in satellite-based and drone-based monitoring technologies. The growing need for real-time but non-intrusive monitoring solutions for offshore oil rigs and remote industrial sites is supporting the adoption. Moreover, the coupling of AI and IoT for predictive analytics is another factor encouraging the demand for remote monitoring systems.
By Industry
The flare monitoring market was dominated by refineries in 2023, holding a 30.3% share against emissions regulations driving continuous real-time monitoring. Flare emissions are among the highest emissions from the import and exportation of crude oil often following refining processes, and advanced monitoring systems are critical to regulatory compliance and efficiency of operations. This segment has been steady in market leadership due to in-process and remote flare monitoring technologies such as infrared (IR) cameras and gas analyzers.
The segment of onshore oil & gas production sites is anticipated to register the highest growth rate, or CAGR, during the period 2024 - 2032 due to rising global energy needs and growing exploration activities across the globe. This is driving the adoption of AI-enabled remote monitoring solutions, especially in these remote and high-risk locations where timely emissions monitoring is crucial. This segment is also driven by government policies targeting methane and sustainable oil & gas terms.
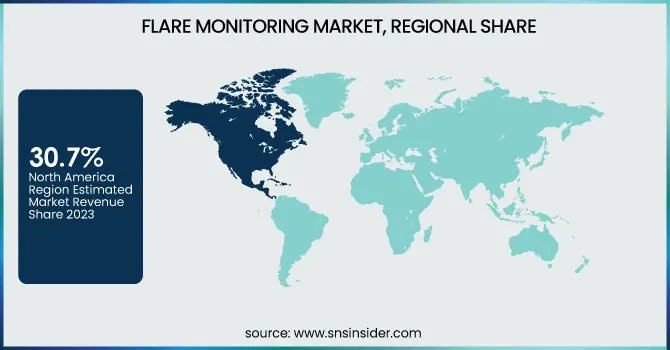
North America accounted for the largest share of 30.7% in the flare monitoring market due to strict regulations from the Environmental Protection Agency (EPA) in the US and the Canadian Environmental Protection Act (CEPA) in Canada as of 2023. In the region, the lengthy history of oil & gas, petrochemical, and chemical deliverance makes it essential to pay robust attention to low emission standards, hence these segments are the key investors in technologically advanced in-process and remote flare monitoring solutions. For instance, the adoption of AI-driven and IoT-based flare monitoring systems is witnessing high growth in North America, particularly in the U.S. and Canada. Companies such as ExxonMobil and Chevron have introduced advanced flare-monitoring technologies into the refinery business. The third option has already been employed by ExxonMobil, which has IR and gas analyzer-based flare gas combustion monitoring in place to provide optimal combustion of flare gas in real-time and target environmental footprint reduction.
The Asia-Pacific region is predicted to expand at the highest CAGR between 2024 and 2032 owing to industrialization, rising need for energy, and emission-control rules in China, India, and Indonesia. The Wave of Environmental Change: Governments are tightening the screws of environmental laws, which is prompting industries to continue raising the bar for flare monitoring technologies. For instance, in India, Real-time Remote Flare Monitoring Solutions have been installed by Reliance Industries Limited (RIL), overseen by its refineries to ensure compliance and efficient operations. Also, the China National Petroleum Corporation (CNPC) has recently been putting up resources developing AI-based monitoring systems to help them better track emissions at its oil & gas facilities.
Get Customized Report as per Your Business Requirement - Enquiry Now
Here are the top 15 companies in flare monitoring along with one of their products:
Flotek Industries (JP3 VeraCal Flare Monitoring Analyzer)
Providence Photonics (Mantis)
Zeeco (Contour Smokeless Flare Control System)
CleanFlare (FlareX)
Kuva Systems (Optical Gas Imaging Camera)
Andium (Flare Monitoring Platform)
TotalEnergies (Methane Leak Detection Equipment)
Encino Environmental Services (Advanced Flare Monitoring Technology)
Flare Industries (Flare Gas Recovery Systems)
John Zink Hamworthy Combustion (Flare Gas Recovery Systems)
Honeywell (UOP Callidus Flare Systems)
ABB (Flare Gas Monitoring Systems)
Siemens (Flare Gas Mass Spectrometer)
Emerson (Rosemount Flare Gas Flow Meters)
Schneider Electric (Flare Gas Metering Solutions)
In November 2024, TotalEnergies deploy continuous, real-time methane emissions detection equipment across all its operated upstream assets by 2025 to achieve near-zero methane emissions by 2030.
In August 2024, Honeywell launched its Emissions Management Suite, an end-to-end monitoring solution for offshore oil & gas platforms and marine vessels, enabling real-time emissions detection and reporting.
| Report Attributes | Details |
|---|---|
| Market Size in 2023 | USD 1.69 Billion |
| Market Size by 2032 | USD 9.15 Billion |
| CAGR | CAGR of 20.68% From 2024 to 2032 |
| Base Year | 2023 |
| Forecast Period | 2024-2032 |
| Historical Data | 2020-2022 |
| Report Scope & Coverage | Market Size, Segments Analysis, Competitive Landscape, Regional Analysis, DROC & SWOT Analysis, Forecast Outlook |
| Key Segments | • By Mounting Method (In-process, Remote) • By Industry (Refineries, Petrochemicals, Onshore Oil & Gas Production Sites, Landfills, Others) |
| Regional Analysis/Coverage | North America (US, Canada, Mexico), Europe (Eastern Europe [Poland, Romania, Hungary, Turkey, Rest of Eastern Europe] Western Europe] Germany, France, UK, Italy, Spain, Netherlands, Switzerland, Austria, Rest of Western Europe]), Asia Pacific (China, India, Japan, South Korea, Vietnam, Singapore, Australia, Rest of Asia Pacific), Middle East & Africa (Middle East [UAE, Egypt, Saudi Arabia, Qatar, Rest of Middle East], Africa [Nigeria, South Africa, Rest of Africa], Latin America (Brazil, Argentina, Colombia, Rest of Latin America) |
| Company Profiles | Flotek Industries, Providence Photonics, Zeeco, CleanFlare, Kuva Systems, Andium, TotalEnergies, Encino Environmental Services, Flare Industries, John Zink Hamworthy Combustion, Honeywell, ABB, Siemens, Emerson, Schneider Electric. |
Ans: The Flare Monitoring Market is expected to grow at a CAGR of 8.62% during 2024-2032.
Ans: Flare Monitoring Market size was USD 1.22 Billion in 2023 and is expected to Reach USD 2.55 Billion by 2032.
Ans: Stringent environmental regulations and rising industry focus on emission reduction are the major growth factors driving the Flare Monitoring market.
Ans: The In-process segment dominated the Flare Monitoring market in 2023.
Ans: North America dominated the Flare Monitoring Market in 2023
1. Introduction
1.1 Market Definition
1.2 Scope (Inclusion and Exclusions)
1.3 Research Assumptions
2. Executive Summary
2.1 Market Overview
2.2 Regional Synopsis
2.3 Competitive Summary
3. Research Methodology
3.1 Top-Down Approach
3.2 Bottom-up Approach
3.3. Data Validation
3.4 Primary Interviews
4. Market Dynamics Impact Analysis
4.1 Market Driving Factors Analysis
4.1.1 Drivers
4.1.2 Restraints
4.1.3 Opportunities
4.1.4 Challenges
4.2 PESTLE Analysis
4.3 Porter’s Five Forces Model
5. Statistical Insights and Trends Reporting
5.1 Flare Monitoring System Deployment, by Region (2023)
5.2 Industrial Flare Monitoring System Utilization
5.3 Supply Chain Metrics for Flare Monitoring Market
5.4 Flare Monitoring System Efficiency Metrics
6. Competitive Landscape
6.1 List of Major Companies, By Region
6.2 Market Share Analysis, By Region
6.3 Product Benchmarking
6.3.1 Product specifications and features
6.3.2 Pricing
6.4 Strategic Initiatives
6.4.1 Marketing and promotional activities
6.4.2 Distribution and Supply Chain Strategies
6.4.3 Expansion plans and new product launches
6.4.4 Strategic partnerships and collaborations
6.5 Technological Advancements
6.6 Market Positioning and Branding
7. Flare Monitoring Market Segmentation, By Mounting Method
7.1 Chapter Overview
7.2 In-process
7.2.1 In-process Market Trends Analysis (2020-2032)
7.2.2 In-process Market Size Estimates and Forecasts to 2032 (USD BILLION)
7.3 Remote
7.3.1 Remote Market Trends Analysis (2020-2032)
7.3.2 Remote Market Size Estimates and Forecasts to 2032 (USD BILLION)
8. Flare Monitoring Market Segmentation, By Industry
8.1 Chapter Overview
8.2 Refineries
8.2.1 Refineries Market Trends Analysis (2020-2032)
8.2.2 Refineries Market Size Estimates and Forecasts to 2032 (USD BILLION)
8.3 Petrochemicals
8.3.1 Petrochemicals Market Trends Analysis (2020-2032)
8.3.2 Petrochemicals Market Size Estimates and Forecasts to 2032 (USD BILLION)
8.4 Onshore Oil & Gas Production Sites
8.4.1 Onshore Oil & Gas Production Sites Market Trends Analysis (2020-2032)
8.4.2 Onshore Oil & Gas Production Sites Market Size Estimates and Forecasts to 2032 (USD BILLION)
8.5 Landfills
8.5.1 Landfills Market Trends Analysis (2020-2032)
8.5.2 Landfills Market Size Estimates and Forecasts to 2032 (USD BILLION)
8.6 Others
8.6.1 Others Market Trends Analysis (2020-2032)
8.6.2 Others Market Size Estimates and Forecasts to 2032 (USD BILLION)
9. Regional Analysis
9.1 Chapter Overview
9.2 North America
9.2.1 Trends Analysis
9.2.2 North America Flare Monitoring Market Estimates and Forecasts, by Country (2020-2032) (USD BILLION)
9.2.3 North America Flare Monitoring Market Estimates and Forecasts, By Mounting Method (2020-2032) (USD BILLION)
9.2.4 North America Flare Monitoring Market Estimates and Forecasts, By Industry (2020-2032) (USD BILLION)
9.2.5 USA
9.2.5.1 USA Flare Monitoring Market Estimates and Forecasts, By Mounting Method (2020-2032) (USD BILLION)
9.2.5.2 USA Flare Monitoring Market Estimates and Forecasts, By Industry (2020-2032) (USD BILLION)
9.2.6 Canada
9.2.6.1 Canada Flare Monitoring Market Estimates and Forecasts, By Mounting Method (2020-2032) (USD BILLION)
9.2.6.2 Canada Flare Monitoring Market Estimates and Forecasts, By Industry (2020-2032) (USD BILLION)
9.2.7 Mexico
9.2.7.1 Mexico Flare Monitoring Market Estimates and Forecasts, By Mounting Method (2020-2032) (USD BILLION)
9.2.7.2 Mexico Flare Monitoring Market Estimates and Forecasts, By Industry (2020-2032) (USD BILLION)
9.3 Europe
9.3.1 Eastern Europe
9.3.1.1 Trends Analysis
9.3.1.2 Eastern Europe Flare Monitoring Market Estimates and Forecasts, by Country (2020-2032) (USD BILLION)
9.3.1.3 Eastern Europe Flare Monitoring Market Estimates and Forecasts, By Mounting Method (2020-2032) (USD BILLION)
9.3.1.4 Eastern Europe Flare Monitoring Market Estimates and Forecasts, By Industry (2020-2032) (USD BILLION)
9.3.1.5 Poland
9.3.1.5.1 Poland Flare Monitoring Market Estimates and Forecasts, By Mounting Method (2020-2032) (USD BILLION)
9.3.1.5.2 Poland Flare Monitoring Market Estimates and Forecasts, By Industry (2020-2032) (USD BILLION)
9.3.1.6 Romania
9.3.1.6.1 Romania Flare Monitoring Market Estimates and Forecasts, By Mounting Method (2020-2032) (USD BILLION)
9.3.1.6.2 Romania Flare Monitoring Market Estimates and Forecasts, By Industry (2020-2032) (USD BILLION)
9.3.1.7 Hungary
9.3.1.7.1 Hungary Flare Monitoring Market Estimates and Forecasts, By Mounting Method (2020-2032) (USD BILLION)
9.3.1.7.2 Hungary Flare Monitoring Market Estimates and Forecasts, By Industry (2020-2032) (USD BILLION)
9.3.1.8 turkey
9.3.1.8.1 Turkey Flare Monitoring Market Estimates and Forecasts, By Mounting Method (2020-2032) (USD BILLION)
9.3.1.8.2 Turkey Flare Monitoring Market Estimates and Forecasts, By Industry (2020-2032) (USD BILLION)
9.3.1.9 Rest of Eastern Europe
9.3.1.9.1 Rest of Eastern Europe Flare Monitoring Market Estimates and Forecasts, By Mounting Method (2020-2032) (USD BILLION)
9.3.1.9.2 Rest of Eastern Europe Flare Monitoring Market Estimates and Forecasts, By Industry (2020-2032) (USD BILLION)
9.3.2 Western Europe
9.3.2.1 Trends Analysis
9.3.2.2 Western Europe Flare Monitoring Market Estimates and Forecasts, by Country (2020-2032) (USD BILLION)
9.3.2.3 Western Europe Flare Monitoring Market Estimates and Forecasts, By Mounting Method (2020-2032) (USD BILLION)
9.3.2.4 Western Europe Flare Monitoring Market Estimates and Forecasts, By Industry (2020-2032) (USD BILLION)
9.3.2.5 Germany
9.3.2.5.1 Germany Flare Monitoring Market Estimates and Forecasts, By Mounting Method (2020-2032) (USD BILLION)
9.3.2.5.2 Germany Flare Monitoring Market Estimates and Forecasts, By Industry (2020-2032) (USD BILLION)
9.3.2.6 France
9.3.2.6.1 France Flare Monitoring Market Estimates and Forecasts, By Mounting Method (2020-2032) (USD BILLION)
9.3.2.6.2 France Flare Monitoring Market Estimates and Forecasts, By Industry (2020-2032) (USD BILLION)
9.3.2.7 UK
9.3.2.7.1 UK Flare Monitoring Market Estimates and Forecasts, By Mounting Method (2020-2032) (USD BILLION)
9.3.2.7.2 UK Flare Monitoring Market Estimates and Forecasts, By Industry (2020-2032) (USD BILLION)
9.3.2.8 Italy
9.3.2.8.1 Italy Flare Monitoring Market Estimates and Forecasts, By Mounting Method (2020-2032) (USD BILLION)
9.3.2.8.2 Italy Flare Monitoring Market Estimates and Forecasts, By Industry (2020-2032) (USD BILLION)
9.3.2.9 Spain
9.3.2.9.1 Spain Flare Monitoring Market Estimates and Forecasts, By Mounting Method (2020-2032) (USD BILLION)
9.3.2.9.2 Spain Flare Monitoring Market Estimates and Forecasts, By Industry (2020-2032) (USD BILLION)
9.3.2.10 Netherlands
9.3.2.10.1 Netherlands Flare Monitoring Market Estimates and Forecasts, By Mounting Method (2020-2032) (USD BILLION)
9.3.2.10.2 Netherlands Flare Monitoring Market Estimates and Forecasts, By Industry (2020-2032) (USD BILLION)
9.3.2.11 Switzerland
9.3.2.11.1 Switzerland Flare Monitoring Market Estimates and Forecasts, By Mounting Method (2020-2032) (USD BILLION)
9.3.2.11.2 Switzerland Flare Monitoring Market Estimates and Forecasts, By Industry (2020-2032) (USD BILLION)
9.3.2.12 Austria
9.3.2.12.1 Austria Flare Monitoring Market Estimates and Forecasts, By Mounting Method (2020-2032) (USD BILLION)
9.3.2.12.2 Austria Flare Monitoring Market Estimates and Forecasts, By Industry (2020-2032) (USD BILLION)
9.3.2.13 Rest of Western Europe
9.3.2.13.1 Rest of Western Europe Flare Monitoring Market Estimates and Forecasts, By Mounting Method (2020-2032) (USD BILLION)
9.3.2.13.2 Rest of Western Europe Flare Monitoring Market Estimates and Forecasts, By Industry (2020-2032) (USD BILLION)
9.4 Asia Pacific
9.4.1 Trends Analysis
9.4.2 Asia Pacific Flare Monitoring Market Estimates and Forecasts, by Country (2020-2032) (USD BILLION)
9.4.3 Asia Pacific Flare Monitoring Market Estimates and Forecasts, By Mounting Method (2020-2032) (USD BILLION)
9.4.4 Asia Pacific Flare Monitoring Market Estimates and Forecasts, By Industry (2020-2032) (USD BILLION)
9.4.5 China
9.4.5.1 China Flare Monitoring Market Estimates and Forecasts, By Mounting Method (2020-2032) (USD BILLION)
9.4.5.2 China Flare Monitoring Market Estimates and Forecasts, By Industry (2020-2032) (USD BILLION)
9.4.6 India
9.4.5.1 India Flare Monitoring Market Estimates and Forecasts, By Mounting Method (2020-2032) (USD BILLION)
9.4.5.2 India Flare Monitoring Market Estimates and Forecasts, By Industry (2020-2032) (USD BILLION)
9.4.5 Japan
9.4.5.1 Japan Flare Monitoring Market Estimates and Forecasts, By Mounting Method (2020-2032) (USD BILLION)
9.4.5.2 Japan Flare Monitoring Market Estimates and Forecasts, By Industry (2020-2032) (USD BILLION)
9.4.6 South Korea
9.4.6.1 South Korea Flare Monitoring Market Estimates and Forecasts, By Mounting Method (2020-2032) (USD BILLION)
9.4.6.2 South Korea Flare Monitoring Market Estimates and Forecasts, By Industry (2020-2032) (USD BILLION)
9.4.7 Vietnam
9.4.7.1 Vietnam Flare Monitoring Market Estimates and Forecasts, By Mounting Method (2020-2032) (USD BILLION)
9.2.7.2 Vietnam Flare Monitoring Market Estimates and Forecasts, By Industry (2020-2032) (USD BILLION)
9.4.8 Singapore
9.4.8.1 Singapore Flare Monitoring Market Estimates and Forecasts, By Mounting Method (2020-2032) (USD BILLION)
9.4.8.2 Singapore Flare Monitoring Market Estimates and Forecasts, By Industry (2020-2032) (USD BILLION)
9.4.9 Australia
9.4.9.1 Australia Flare Monitoring Market Estimates and Forecasts, By Mounting Method (2020-2032) (USD BILLION)
9.4.9.2 Australia Flare Monitoring Market Estimates and Forecasts, By Industry (2020-2032) (USD BILLION)
9.4.10 Rest of Asia Pacific
9.4.10.1 Rest of Asia Pacific Flare Monitoring Market Estimates and Forecasts, By Mounting Method (2020-2032) (USD BILLION)
9.4.10.2 Rest of Asia Pacific Flare Monitoring Market Estimates and Forecasts, By Industry (2020-2032) (USD BILLION)
9.5 Middle East and Africa
9.5.1 Middle East
9.5.1.1 Trends Analysis
9.5.1.2 Middle East Flare Monitoring Market Estimates and Forecasts, by Country (2020-2032) (USD BILLION)
9.5.1.3 Middle East Flare Monitoring Market Estimates and Forecasts, By Mounting Method (2020-2032) (USD BILLION)
9.5.1.4 Middle East Flare Monitoring Market Estimates and Forecasts, By Industry (2020-2032) (USD BILLION)
9.5.1.5 UAE
9.5.1.5.1 UAE Flare Monitoring Market Estimates and Forecasts, By Mounting Method (2020-2032) (USD BILLION)
9.5.1.5.2 UAE Flare Monitoring Market Estimates and Forecasts, By Industry (2020-2032) (USD BILLION)
9.5.1.6 Egypt
9.5.1.6.1 Egypt Flare Monitoring Market Estimates and Forecasts, By Mounting Method (2020-2032) (USD BILLION)
9.5.1.6.2 Egypt Flare Monitoring Market Estimates and Forecasts, By Industry (2020-2032) (USD BILLION)
9.5.1.7 Saudi Arabia
9.5.1.7.1 Saudi Arabia Flare Monitoring Market Estimates and Forecasts, By Mounting Method (2020-2032) (USD BILLION)
9.5.1.7.2 Saudi Arabia Flare Monitoring Market Estimates and Forecasts, By Industry (2020-2032) (USD BILLION)
9.5.1.8 Qatar
9.5.1.8.1 Qatar Flare Monitoring Market Estimates and Forecasts, By Mounting Method (2020-2032) (USD BILLION)
9.5.1.8.2 Qatar Flare Monitoring Market Estimates and Forecasts, By Industry (2020-2032) (USD BILLION)
9.5.1.9 Rest of Middle East
9.5.1.9.1 Rest of Middle East Flare Monitoring Market Estimates and Forecasts, By Mounting Method (2020-2032) (USD BILLION)
9.5.1.9.2 Rest of Middle East Flare Monitoring Market Estimates and Forecasts, By Industry (2020-2032) (USD BILLION)
9.5.2 Africa
9.5.2.1 Trends Analysis
9.5.2.2 Africa Flare Monitoring Market Estimates and Forecasts, by Country (2020-2032) (USD BILLION)
9.5.2.3 Africa Flare Monitoring Market Estimates and Forecasts, By Mounting Method (2020-2032) (USD BILLION)
9.5.2.4 Africa Flare Monitoring Market Estimates and Forecasts, By Industry (2020-2032) (USD BILLION)
9.5.2.5 South Africa
9.5.2.5.1 South Africa Flare Monitoring Market Estimates and Forecasts, By Mounting Method (2020-2032) (USD BILLION)
9.5.2.5.2 South Africa Flare Monitoring Market Estimates and Forecasts, By Industry (2020-2032) (USD BILLION)
9.5.2.6 Nigeria
9.5.2.6.1 Nigeria Flare Monitoring Market Estimates and Forecasts, By Mounting Method (2020-2032) (USD BILLION)
9.5.2.6.2 Nigeria Flare Monitoring Market Estimates and Forecasts, By Industry (2020-2032) (USD BILLION)
9.5.2.7 Rest of Africa
9.5.2.7.1 Rest of Africa Flare Monitoring Market Estimates and Forecasts, By Mounting Method (2020-2032) (USD BILLION)
9.5.2.7.2 Rest of Africa Flare Monitoring Market Estimates and Forecasts, By Industry (2020-2032) (USD BILLION)
9.6 Latin America
9.6.1 Trends Analysis
9.6.2 Latin America Flare Monitoring Market Estimates and Forecasts, by Country (2020-2032) (USD BILLION)
9.6.3 Latin America Flare Monitoring Market Estimates and Forecasts, By Mounting Method (2020-2032) (USD BILLION)
9.6.4 Latin America Flare Monitoring Market Estimates and Forecasts, By Industry (2020-2032) (USD BILLION)
9.6.5 Brazil
9.6.5.1 Brazil Flare Monitoring Market Estimates and Forecasts, By Mounting Method (2020-2032) (USD BILLION)
9.6.5.2 Brazil Flare Monitoring Market Estimates and Forecasts, By Industry (2020-2032) (USD BILLION)
9.6.6 Argentina
9.6.6.1 Argentina Flare Monitoring Market Estimates and Forecasts, By Mounting Method (2020-2032) (USD BILLION)
9.6.6.2 Argentina Flare Monitoring Market Estimates and Forecasts, By Industry (2020-2032) (USD BILLION)
9.6.7 Colombia
9.6.7.1 Colombia Flare Monitoring Market Estimates and Forecasts, By Mounting Method (2020-2032) (USD BILLION)
9.6.7.2 Colombia Flare Monitoring Market Estimates and Forecasts, By Industry (2020-2032) (USD BILLION)
9.6.8 Rest of Latin America
9.6.8.1 Rest of Latin America Flare Monitoring Market Estimates and Forecasts, By Mounting Method (2020-2032) (USD BILLION)
9.6.8.2 Rest of Latin America Flare Monitoring Market Estimates and Forecasts, By Industry (2020-2032) (USD BILLION)
10. Company Profiles
10.1 Flotek Industries.
10.1.1 Company Overview
10.1.2 Financial
10.1.3 Products/ Services Offered
110.1.4 SWOT Analysis
10.2 Providence Photonics
10.2.1 Company Overview
10.2.2 Financial
10.2.3 Products/ Services Offered
10.2.4 SWOT Analysis
10.3 Zeeco
10.3.1 Company Overview
10.3.2 Financial
10.3.3 Products/ Services Offered
10.3.4 SWOT Analysis
10.4 CleanFlare
10.4.1 Company Overview
10.4.2 Financial
10.4.3 Products/ Services Offered
10.4.4 SWOT Analysis
10.5 Kuva Systems
10.5.1 Company Overview
10.5.2 Financial
10.5.3 Products/ Services Offered
10.5.4 SWOT Analysis
10.6 Andium
10.6.1 Company Overview
10.6.2 Financial
10.6.3 Products/ Services Offered
10.6.4 SWOT Analysis
10.7 TotalEnergies.
10.7.1 Company Overview
10.7.2 Financial
10.7.3 Products/ Services Offered
10.7.4 SWOT Analysis
10.8 Encino Environmental Services
10.8.1 Company Overview
10.8.2 Financial
10.8.3 Products/ Services Offered
10.8.4 SWOT Analysis
10.9 Flare Industries
10.9.1 Company Overview
10.9.2 Financial
10.9.3 Products/ Services Offered
10.9.4 SWOT Analysis
10.10 John Zink Hamworthy Combustion
10.9.1 Company Overview
10.9.2 Financial
10.9.3 Products/ Services Offered
10.9.4 SWOT Analysis
11. Use Cases and Best Practices
12. Conclusion
An accurate research report requires proper strategizing as well as implementation. There are multiple factors involved in the completion of good and accurate research report and selecting the best methodology to compete the research is the toughest part. Since the research reports we provide play a crucial role in any company’s decision-making process, therefore we at SNS Insider always believe that we should choose the best method which gives us results closer to reality. This allows us to reach at a stage wherein we can provide our clients best and accurate investment to output ratio.
Each report that we prepare takes a timeframe of 350-400 business hours for production. Starting from the selection of titles through a couple of in-depth brain storming session to the final QC process before uploading our titles on our website we dedicate around 350 working hours. The titles are selected based on their current market cap and the foreseen CAGR and growth.
The 5 steps process:
Step 1: Secondary Research:
Secondary Research or Desk Research is as the name suggests is a research process wherein, we collect data through the readily available information. In this process we use various paid and unpaid databases which our team has access to and gather data through the same. This includes examining of listed companies’ annual reports, Journals, SEC filling etc. Apart from this our team has access to various associations across the globe across different industries. Lastly, we have exchange relationships with various university as well as individual libraries.

Step 2: Primary Research
When we talk about primary research, it is a type of study in which the researchers collect relevant data samples directly, rather than relying on previously collected data. This type of research is focused on gaining content specific facts that can be sued to solve specific problems. Since the collected data is fresh and first hand therefore it makes the study more accurate and genuine.
We at SNS Insider have divided Primary Research into 2 parts.
Part 1 wherein we interview the KOLs of major players as well as the upcoming ones across various geographic regions. This allows us to have their view over the market scenario and acts as an important tool to come closer to the accurate market numbers. As many as 45 paid and unpaid primary interviews are taken from both the demand and supply side of the industry to make sure we land at an accurate judgement and analysis of the market.
This step involves the triangulation of data wherein our team analyses the interview transcripts, online survey responses and observation of on filed participants. The below mentioned chart should give a better understanding of the part 1 of the primary interview.

Part 2: In this part of primary research the data collected via secondary research and the part 1 of the primary research is validated with the interviews from individual consultants and subject matter experts.
Consultants are those set of people who have at least 12 years of experience and expertise within the industry whereas Subject Matter Experts are those with at least 15 years of experience behind their back within the same space. The data with the help of two main processes i.e., FGDs (Focused Group Discussions) and IDs (Individual Discussions). This gives us a 3rd party nonbiased primary view of the market scenario making it a more dependable one while collation of the data pointers.
Step 3: Data Bank Validation
Once all the information is collected via primary and secondary sources, we run that information for data validation. At our intelligence centre our research heads track a lot of information related to the market which includes the quarterly reports, the daily stock prices, and other relevant information. Our data bank server gets updated every fortnight and that is how the information which we collected using our primary and secondary information is revalidated in real time.

Step 4: QA/QC Process
After all the data collection and validation our team does a final level of quality check and quality assurance to get rid of any unwanted or undesired mistakes. This might include but not limited to getting rid of the any typos, duplication of numbers or missing of any important information. The people involved in this process include technical content writers, research heads and graphics people. Once this process is completed the title gets uploader on our platform for our clients to read it.
Step 5: Final QC/QA Process:
This is the last process and comes when the client has ordered the study. In this process a final QA/QC is done before the study is emailed to the client. Since we believe in giving our clients a good experience of our research studies, therefore, to make sure that we do not lack at our end in any way humanly possible we do a final round of quality check and then dispatch the study to the client.
By Mounting Method
In-process
Remote
By Industry
Refineries
Petrochemicals
Onshore Oil & Gas Production Sites
Landfills
Others
Request for Segment Customization as per your Business Requirement: Segment Customization Request
Regional Coverage:
North America
US
Canada
Mexico
Europe
Eastern Europe
Poland
Romania
Hungary
Turkey
Rest of Eastern Europe
Western Europe
Germany
France
UK
Italy
Spain
Netherlands
Switzerland
Austria
Rest of Western Europe
Asia Pacific
China
India
Japan
South Korea
Vietnam
Singapore
Australia
Rest of Asia Pacific
Middle East & Africa
Middle East
UAE
Egypt
Saudi Arabia
Qatar
Rest of Middle East
Africa
Nigeria
South Africa
Rest of Africa
Latin America
Brazil
Argentina
Colombia
Rest of Latin America
Request for Country Level Research Report: Country Level Customization Request
Available Customization
With the given market data, SNS Insider offers customization as per the company’s specific needs. The following customization options are available for the report:
Detailed Volume Analysis
Criss-Cross segment analysis (e.g. Product X Application)
Competitive Product Benchmarking
Geographic Analysis
Additional countries in any of the regions
Customized Data Representation
Detailed analysis and profiling of additional market players
The Street Lighting Market Size was valued at USD 10.93 Billion in 2023 and is expected to grow at a CAGR of 4.70% to reach USD 16.52 Billion by 2032.
The Digital Scent Technology Market size was valued at USD 1.09 Billion in 2023 and expected to grow at a CAGR of 9.93% to reach USD 2.56 Billion by 2032.
The Simultaneous Localization and Mapping (SLAM) Market valued at USD 478.45 million in 2023 and is expected to grow at a CAGR of 36.43% During 2024-2032.
The UV Disinfection Equipment Market was calculated USD 3.85 Billion in 2023 & will reach USD 7.07 Billion by 2032, with a growing CAGR of 7% by 2024-2032.
The IO-Link Market was valued at USD 13.9 Billion in 2023 and is expected to reach USD 70.5 Billion by 2032, growing at a CAGR of 19.79% from 2024-2032.
The Laser Technology Market Size was valued at USD 18.76 Billion in 2023 and is expected to reach USD 37.26 Billion by 2032 and grow at a CAGR of 7.96% over the forecast period 2024-2032.

Hi! Click one of our member below to chat on Phone
© 2025 All Rights Reserved by SNS Insider Pvt Ltd


