image

FLAME RETARDANTS MARKET REPORT SCOPE & OVERVIEW:
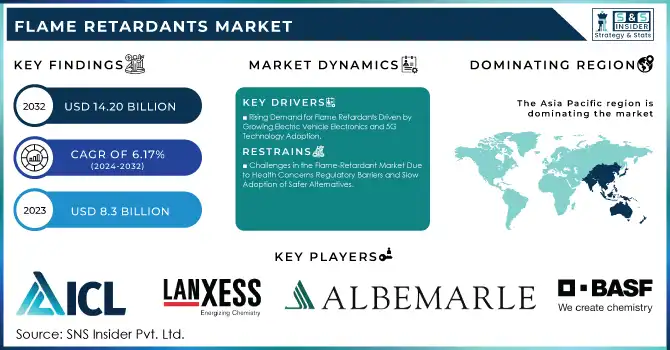
The Flame Retardants Market was valued at USD 8.3 Billion in 2023 and is expected to reach USD 14.20 Billion by 2032, growing at a CAGR of 6.17% over the forecast period 2024-2032.

Flame Retardants Market Revenue Analysis

Get More Information on Flame Retardants Market - Request Sample Report

The Fire Retardants Market is being driven by major forces owing to an increase in safety regulations and growing demand for fire-resistant materials in industries. The growing regulatory environment regarding fire safety & increased demand for flame retardants across various end-use industries such as construction, automotive, and electronics has also prompted an increased focus towards enhancement in properties of materials such as plastics, textiles, coatings, etc., and thus, contributing to the market growth over the forecast period. Some of the demand for this is driven by the construction urge for safer building materials, while the environmental urge for electric automotive the push towards electric vehicles will need increased fire protection. Also, strict rules in different regions, such as North America and Europe, to minimize fire-related risks, is another factor boosting the growth of the market. The number of flame retardants used in the automotive and construction industries in the U.S. rose by 6.5%, whereas Europe's demand increased by 5.8%. Growth for electric vehicle segment was 7% p.a., flame retardants for electronics in Asia-pacific grew by 5.2% Use of eco-friendly materials increased by 12%, while the construction sector anticipates a 6% increase in fire-resistant materials usage

Awareness Of Environmental Sustainability Is Another Factor Driving The Flame Retardants Market

Flame retardants that are not toxic and environmentally friendly are being developed as consumers and manufacturers now demand flame retardants that are not toxic and environmentally friendly. Phosphorous & nitrogen-based flame retardants, on the other hand, provide end-of-life performance and are becoming more environmentally friendly, thus attracting growing interest. Moreover, increasing demand for flame retardants in new applications owing to the growth vehicle or the use of electrically powered vehicles as well as inherent electronic products are enhancing the prospects giving a new impetus to the market. All these factors combined will help the flame retardants market to persist in its growth journey for years to come, right into the next decade. Phosphorus-based solutions increase flame resistance in cotton textiles by 40%, and the demand for eco-friendly flame retardants is growing rapidly. By using nitrogen-phosphorus formulations, a 50% reduction in harmful emissions during combustion has been achieved. In the past year, the demand for non-toxic flame retardants has increased in the marketplace by 30%, mostly due to consumers and regulatory action.

Flame Retardants Market Dynamics

KEY DRIVERS:  

  • Rising Demand for Flame Retardants Driven by Growing Electric Vehicle Electronics and 5G Technology Adoption

One of the most important factors that are accelerating the flame retardants market is the growing electrical and electronics industry. With increasing global demand for consumer electronics, electric vehicles, and other smart devices, manufacturers have to find reliable flame-retardant materials to ensure the safety and robust quality of such products. Specifically, the increasing number of EVs which utilize a diverse array of plastics for components and wiring is growing demand for flame retardants to reduce fire risks in batteries and electrical systems. Her advancement to study polymers and plastics in electronics led to the introduction of flame-retardants for circuit boards and cables to meet safety requirements. Fire-retardants, with opportunities in the electronics industry growing with strides towards 5G, IoT, and wearables. Global electric vehicle registrations grew 35% approximately 14 million vehicles in 2023, driving flame retardant demand, particularly in lithium-ion batteries and electrical systems. However, the demand for these batteries with flame retardants is anticipated to grow at an annual rate of 6.2% over the coming years. The growing demand for non-halogenated flame retardants owing to the increasing penetration of 5G, IoT, and wearable devices in which they find applications such as smartphones, circuit boards, and cables is also expected to propel the market growth.

  • Shift Towards Eco-Friendly Flame Retardants Driven by Consumer Demand and Sustainability Focus in Industries

Recognizing the adverse impact of conventional flame retardants, especially those containing bromine and chlorine, there is a movement to develop and implement safer, more sustainable materials. More manufacturers are searching for flame retardants that are flame retardant but nontoxic and not harmful to the environment. This change is driven by increased regulation and rising consumer demand for environmentally friendly products. This has made phosphorous- and nitrogen-based and intumescent flame retardants attractive and safer options over conventional chemicals. With the core focus of industry moving towards sustainability, the demand for such advanced sustainable flame retardants is foreseen to increase, sliding the market up. Phosphorus-based flame retardants now represent 20% of the total flame-retardant consumption in Europe, having increased from around 15% in the early 2000s reflecting the increased demand for more environmentally friendly flame retardants. Furthermore, around 30% of all of the new flame retardants developed are non-toxic, environmentally friendly flame retardants, up from 10% over the previous decade. Such a trend is fueled by greater acceptance of intumescent and phosphorus-nitrogen flame retardants, providing 5-10% yearly growth in automotive and electronics categories.

RESTRAIN:

  • Challenges in the Flame-Retardant Market Due to Health Concerns Regulatory Barriers and Slow Adoption of Safer Alternatives

The regulatory and health concerns related to various flame-retardant chemicals are some of the key restraining factors for the flame-retardant market. Although effective, the toxicity and environmental persistence of conventional brominated and chlorinated flame retardants have aroused concerns about health hazards. As a result, there have been strict guidelines in place, in some cases, bans in certain areas of the world, mainly in Europe and North America. They will have to spend on research and development to develop safer ecologically preferable substitutes, which is often a daunting and time-consuming task for manufacturers. In some regions, there has been a lack of awareness of newer, safer flame-retardant technologies creating yet another challenge. Some may be resistant to change due to inertia or lack of regulatory pressure, despite a growing interest in sustainable and non-toxic flame retardants. This delays the switch over to less harmful substitutes and slows the development of the market.

Flame Retardants Market Segments

BY TYPE

Aluminum Trihydrate (ATH) accounted for a major portion of the flame retardants market, 28.3%, in 2023. ATH is widely utilized as a filler in plastics, rubber, and coatings, especially in the construction and automotive sectors. Because of its dual properties as a flame retardant and a smoke suppressant, it has become a favorite. Moreover, ATH is non-toxic and eco-friendly and is considered a safer alternative to a few other flame retardants, thus, driving its use. It has entrenched itself only because of its high demand in industries where fire safety and sustainability are key.

Phosphorous-based flame retardants are projected to have the fastest CAGR growth rate through 2024 - 2032 on account of rising environmental concerns and increasing restrictions on brominated and chlorinated flame retardants. Also, phosphorous flame retardants can provide effective thermal stability and fire resistance without releasing toxic gases that are part of the combustion products of conventional flame retardants, which makes phosphorous flame retardants a superior and more sustainable option. Phosphorous flame retardant is in great demand in electronics, automotive (including electric vehicles), and construction which are poised for explosive growth and output within the short-incoming future to be characterized by sustainable and higher-efficient materials. This is primarily driven by their versatility and their ability to meet stringent fire safety standards while also being less harmful to health and the environment.

BY APPLICATION

The polyolefins segment dominated the flame retardants market with 24.8% of the total market share in 2023 and will achieve the fastest CAGR over 2024-2032. This has been mainly due to their widespread industrial applications in the automotive, construction, and consumer electronic industries. Polyethylene and polypropylene are two of the most common polyolefin materials used to create lightweight, durable, cost-effective items. This property of these materials has attributed to their versatile usage, not only as a construction material but in diverse applications which is expected to be a significant segment in the flame retardants market due to the growing demand for fire-resistant materials. The trend towards electric vehicles, coupled with the increased development of smart electronics and energy-efficient buildings, will drive further adoption of flame-retarded polyolefins. Commonly used in components wires, cables, and battery housing all of which require fire safety in the automotive sector these materials are increasingly used for their outstanding performance. Driven by the increasing trend towards sustainability, together with the advent of environmentally safe flame retardants that are functionally compatible with polyolefins, their market share is also growing at a rapid rate, making them a modern manufacturing necessity.

BY END USE

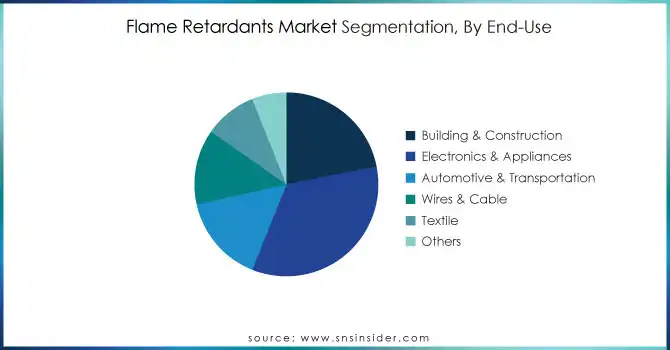
In 2023, Electronics & Appliances held a 34.2% share of the flame retardants market, due to a higher number of uses of flame-retardant materials in cases such as consumer electronics, household appliances, and IT devices. With smartphones, laptops, televisions, and various electronic devices and systems being used more and more everywhere, the demand for fire-resistant components has expanded significantly. Flame retardants are vital for pole safety, since the plastics and polymers typically used in construction have a low ignition threshold, especially with any type of electrical component, including wiring, circuit boards, and casings. Rapid growth in high-tech electronics amid rising focus on fire safety regulations is another factor accountable for the substantial growth of this segment.

Building & Construction is anticipated to become the fastest-growing application during the projection years from 2024-2032, owing to the rising focus on fire safety in residential and commercial buildings. The demand for flame-retardant materials in construction applications is driven by stringent building codes along with fire safety regulations. Examples of these are insulation, coatings, and cladding materials required to make buildings energy-efficient which have become a hallmark of modern architecture, and where the efficacy of flame retardants is crucial. With global urbanization, the demand for fire-safe infrastructure and the fire-safe building and construction sector will grow; hence, flame retardants have the potential to become a major influential market within the next decade.
Flame Retardants Market Regional Analysis

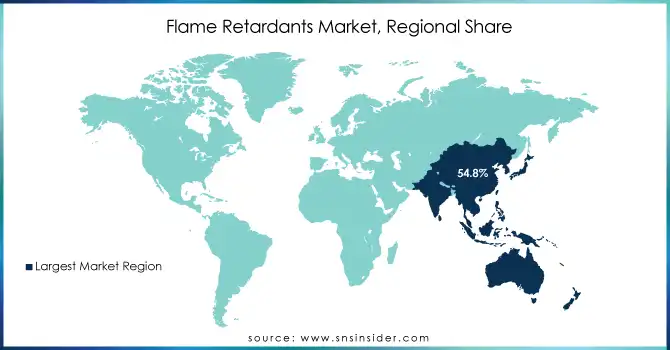
In 2023, Asia Pacific dominated the flame retardants market accounting for 54.8% of the total market share, and it is anticipated to have the fastest CAGR from 2024 to 2032. Factors such as a strong manufacturing base, rapid industrialization, and large demand are being experienced from end-use industries like construction, automotive, and electronics which is fuelling the dominance of the region. This expansion is being driven by countries such as China, India, and Japan, which fuel their economic growth with increased urbanization, large infrastructure projects, and a growing electronics and automotive industry. As an illustration, China, the top consumer and producer of flame retardants, is experiencing significant growth in the electronics and automotive industries, which are the largest end-users of flame-retardant materials. This also plays into the increase in flame-retardant materials due to the country’s rapid transition to electric vehicles, which need fire-safe materials for batteries, wiring, insulation, and more. Furthermore, the Indian construction sector is thriving expeditiously and with an increasing need for fire-safe materials in commercial and residential structures.
Flame-Retardants-Market-Regional-Share

Get Customized Report as per Your Business Requirement - Request For Customized Report

Key players 

Some of the major players in the Flame Retardants Market are:

  • ICL Group (Aluminum Hydroxide, Phosphorus-based Flame Retardants)

  • LANXESS (Exolit OP, Aflammit)

  • Albemarle Corporation (Saytex, GreenCrest)

  • BASF SE (Melapur, Polybond)

  • Jiangsu Yoke Technology Co. Ltd (Brominated Flame Retardants, Phosphorus-based Retardants)

  • Dupont (Zytel, Nomex)

  • Daikin (Fluon, Aflammit)

  • Dow (FIRETEX, FRX)

  • Huntsman International LLC (Melapur, Flamex)

  • Clariant (Exolit, Halogen-Free Flame Retardants)

  • Italmatch Chemicals SpA (Antiblaze, Flamex)

  • DIC Corporation (Flame Retardant Masterbatches, Exolit)

  • RTP Company (Flame Retardant Compounds, Custom Polymers)

  • J.M. Huber Corporation (Hybond, CCB)

  • Kemipex (Phosphorus-based Flame Retardants, Boron Compounds)

  • Tor Minerals International Inc. (Torlon, Alumina Trihydrate)

  • MPI Chemie BV (Thermo-stabilizers, Flame Retardant Agents)

  • Sanwa Chemical Co. Ltd (Halogenated Flame Retardants, Antimony Compounds)

  • Shandong Brother Sci. & Tech. Co. Ltd (Brominated Compounds, Antimony Oxide)

  • Thor (Halogen-Free Flame Retardants, Phosphorus-based Solutions)

Some of the Raw Material Suppliers for Flame Retardants companies:

  • Albemarle

  • Lanxess

  • Dow

  • Solvay

  • BASF

  • SABIC

  • Momentive

  • Honeywell

  • BASF

  • Clariant

RECENT TRENDS

  • In July 2024, ICL launched VeriQuel R100, a sustainable phosphorus-based flame retardant for polyurethane insulation, investing over USD 2 million in R&D.

  • In March 2024, Azelis expanded its partnership with LANXESS to include polymer additives and phosphorus flame retardants in the US, enhancing its product offerings in the region.

  • In April 2024, DuPont launched the Tyvek 400 SFR coverall, a single-use, flame-resistant garment designed to protect against flash fires and hazardous particulates. The coverall is made from Tyvek nonwoven fabric treated for flame resistance.

Flame Retardants Market Report Scope:

Report Attributes Details
Market Size in 2023 US$ 8.3 Billion
Market Size by 2032 US$ 14.20 Billion
CAGR CAGR of 6.17% From 2024 to 2032
Base Year 2023
Forecast Period 2024-2032
Historical Data 2020-2022
Report Scope & Coverage Market Size, Segments Analysis, Competitive  Landscape, Regional Analysis, DROC & SWOT Analysis, Forecast Outlook
Key Segments • By Type (Aluminum Trihydrate, Antimony Oxide, Brominated, Chlorinated, Phosphorous, Nitrogen, Others)
• By Application (Epoxy, Unsaturated Polyester, Polyolefins, Polyvinyl chloride, Polyurethane, Polystyrene, Others)
• By End Use (Building & Construction, Electronics & Appliances, Automotive & Transportation, Wires & Cable, Textile, Others)
Regional Analysis/Coverage North America (US, Canada, Mexico), Europe (Eastern Europe [Poland, Romania, Hungary, Turkey, Rest of Eastern Europe] Western Europe] Germany, France, UK, Italy, Spain, Netherlands, Switzerland, Austria, Rest of Western Europe]), Asia Pacific (China, India, Japan, South Korea, Vietnam, Singapore, Australia, Rest of Asia Pacific), Middle East & Africa (Middle East [UAE, Egypt, Saudi Arabia, Qatar, Rest of Middle East], Africa [Nigeria, South Africa, Rest of Africa], Latin America (Brazil, Argentina, Colombia, Rest of Latin America)
Company Profiles ICL Group, LANXESS, Albemarle Corporation, BASF SE, Jiangsu Yoke Technology Co. Ltd, Dupont, Daikin, Dow, Huntsman International LLC, Clariant, Italmatch Chemicals SpA, DIC Corporation, RTP Company, M. Huber Corporation, Kemipex, Tor Minerals International Inc., MPI Chemie BV, Sanwa Chemical Co. Ltd, Shandong Brother Sci. & Tech. Co. Ltd, Thor, and Others
Key Drivers • Rising Demand for Flame Retardants Driven by Growing Electric Vehicle Electronics and 5G Technology Adoption
• Shift Towards Eco-Friendly Flame Retardants Driven by Consumer Demand and Sustainability Focus in Industries
Restraints • Challenges in the Flame-Retardant Market Due to Health Concerns Regulatory Barriers and Slow Adoption of Safer Alternatives


Frequently Asked Questions

Ans: Asia Pacific dominated the Flame Retardants Market in 2023.

Ans: The Electronics & Appliances segment dominated the Flame Retardants Market in 2023.

Ans: The major growth factor of the Flame Retardants market is the rising demand for fire-resistant materials driven by stringent safety regulations and increased use in industries like construction, electronics, and automotive.

Ans: Flame Retardants Market size was USD 8.3 Billion in 2023 and is expected to Reach USD 14.20 Billion by 2032.

Ans: The Flame Retardants Market is expected to grow at a CAGR of 6.17% during 2024-2032.

TABLE OF CONTENT:

1. Introduction

1.1 Market Definition

1.2 Scope (Inclusion and Exclusions)

1.3 Research Assumptions

2. Executive Summary

2.1 Market Overview

2.2 Regional Synopsis

2.3 Competitive Summary

3. Research Methodology

3.1 Top-Down Approach

3.2 Bottom-up Approach

3.3. Data Validation

3.4 Primary Interviews

4. Market Dynamics Impact Analysis

4.1 Market Driving Factors Analysis

4.1.1 Drivers

4.1.2 Restraints

4.1.3 Opportunities

4.1.4 Challenges

4.2 PESTLE Analysis

4.3 Porter’s Five Forces Model

5. Statistical Insights and Trends Reporting

5.1 Flame Retardants Import/Export Data (2023)

5.2 Flame Retardants Consumption Trends (2023)

      5.3 Flame Retardants Pricing Trends

      5.4 Flame Retardants Supply Chain Dynamics

6. Competitive Landscape

6.1 List of Major Companies, By Region

6.2 Market Share Analysis, By Region

6.3 Product Benchmarking

6.3.1 Product specifications and features

6.3.2 Pricing

6.4 Strategic Initiatives

6.4.1 Marketing and promotional activities

6.4.2 Distribution and Supply Chain Strategies

6.4.3 Expansion plans and new product launches

6.4.4 Strategic partnerships and collaborations

6.5 Technological Advancements

6.6 Market Positioning and Branding

7. Flame Retardants Market Segmentation, By Type

7.1 Chapter Overview

7.2 Aluminum Trihydrate

7.2.1 Aluminum Trihydrate Market Trends Analysis (2020-2032)

7.2.2 Aluminum Trihydrate Market Size Estimates and Forecasts to 2032 (USD Billion)

7.3 Antimony Oxide

7.3.1 Antimony Oxide Market Trends Analysis (2020-2032)

7.3.2 Antimony Oxide Market Size Estimates and Forecasts to 2032 (USD Billion)

7.4 Brominated

7.4.1 Brominated Market Trends Analysis (2020-2032)

7.4.2 Brominated Market Size Estimates and Forecasts to 2032 (USD Billion)

7.5 Chlorinated

7.5.1 Chlorinated Market Trends Analysis (2020-2032)

7.5.2 Chlorinated Market Size Estimates and Forecasts to 2032 (USD Billion)

7.6 Phosphorous

7.6.1 Phosphorous Market Trends Analysis (2020-2032)

7.6.2 Phosphorous Market Size Estimates and Forecasts to 2032 (USD Billion)

7.7 Nitrogen

7.7.1 Nitrogen Market Trends Analysis (2020-2032)

7.7.2 Nitrogen Market Size Estimates and Forecasts to 2032 (USD Billion)

7.8 Others

7.8.1 Others Market Trends Analysis (2020-2032)

7.8.2 Others Market Size Estimates and Forecasts to 2032 (USD Billion)

8. Flame Retardants Market Segmentation, By Application

8.1 Chapter Overview

8.2 Epoxy

8.2.1 Epoxy Market Trends Analysis (2020-2032)

8.2.2 Epoxy Market Size Estimates and Forecasts to 2032 (USD Billion)

8.3 Unsaturated Polyester

8.3.1 Unsaturated Polyester Market Trends Analysis (2020-2032)

8.3.2 Unsaturated Polyester Market Size Estimates and Forecasts to 2032 (USD Billion)

8.4 Polyolefins

8.4.1 Polyolefins Market Trends Analysis (2020-2032)

8.4.2 Polyolefins Market Size Estimates and Forecasts to 2032 (USD Billion)

8.5 Polyvinyl chloride

8.5.1 Polyvinyl chloride Market Trends Analysis (2020-2032)

8.5.2 Polyvinyl chloride Market Size Estimates and Forecasts to 2032 (USD Billion)

8.6 Polyurethane

8.6.1 Polyurethane Market Trends Analysis (2020-2032)

8.6.2 Polyurethane Market Size Estimates and Forecasts to 2032 (USD Billion)

8.7 Polystyrene

8.7.1 Polystyrene Market Trends Analysis (2020-2032)

8.7.2 Polystyrene Market Size Estimates and Forecasts to 2032 (USD Billion)

8.8 Others

8.8.1 Others Market Trends Analysis (2020-2032)

8.8.2 Others Market Size Estimates and Forecasts to 2032 (USD Billion)

9. Flame Retardants Market Segmentation, By End Use

9.1 Chapter Overview

9.2 Building & Construction

9.2.1 Building & Construction Market Trends Analysis (2020-2032)

9.2.2 Building & Construction Market Size Estimates and Forecasts to 2032 (USD Billion)

9.3 Electronics & Appliances

9.3.1 Electronics & Appliances Market Trends Analysis (2020-2032)

9.3.2 Electronics & Appliances Market Size Estimates and Forecasts to 2032 (USD Billion)

9.4 Automotive & Transportation

               9.4.1 Automotive & Transportation Market Trends Analysis (2020-2032)

9.4.2 Automotive & Transportation Market Size Estimates and Forecasts to 2032 (USD Billion)

9.5 Wires & Cable

9.5.1 Wires & Cable Market Trends Analysis (2020-2032)

9.5.2 Wires & Cable Market Size Estimates and Forecasts to 2032 (USD Billion)

9.6 Textile

9.6.1 Textile Market Trends Analysis (2020-2032)

9.6.2 Textile Market Size Estimates and Forecasts to 2032 (USD Billion)

9.7 Others

9.7.1 Others Market Trends Analysis (2020-2032)

9.7.2 Others Market Size Estimates and Forecasts to 2032 (USD Billion)

10. Regional Analysis

10.1 Chapter Overview

10.2 North America

10.2.1 Trends Analysis

10.2.2 North America Flame Retardants Market Estimates and Forecasts, by Country (2020-2032) (USD Billion)

10.2.3 North America Flame Retardants Market Estimates and Forecasts, By Type (2020-2032) (USD Billion)  

10.2.4 North America Flame Retardants Market Estimates and Forecasts, By Application (2020-2032) (USD Billion)

10.2.5 North America Flame Retardants Market Estimates and Forecasts, By End Use (2020-2032) (USD Billion)

10.2.6 USA

10.2.6.1 USA Flame Retardants Market Estimates and Forecasts, By Type (2020-2032) (USD Billion)

10.2.6.2 USA Flame Retardants Market Estimates and Forecasts, By Application (2020-2032) (USD Billion)

10.2.6.3 USA Flame Retardants Market Estimates and Forecasts, By End Use (2020-2032) (USD Billion)

10.2.7 Canada

10.2.7.1 Canada Flame Retardants Market Estimates and Forecasts, By Type (2020-2032) (USD Billion)

10.2.7.2 Canada Flame Retardants Market Estimates and Forecasts, By Application (2020-2032) (USD Billion)

10.2.7.3 Canada Flame Retardants Market Estimates and Forecasts, By End Use (2020-2032) (USD Billion)

10.2.8 Mexico

10.2.8.1 Mexico Flame Retardants Market Estimates and Forecasts, By Type (2020-2032) (USD Billion)

10.2.8.2 Mexico Flame Retardants Market Estimates and Forecasts, By Application (2020-2032) (USD Billion)

10.2.8.3 Mexico Flame Retardants Market Estimates and Forecasts, By End Use (2020-2032) (USD Billion)

10.3 Europe

10.3.1 Eastern Europe

10.3.1.1 Trends Analysis

10.3.1.2 Eastern Europe Flame Retardants Market Estimates and Forecasts, by Country (2020-2032) (USD Billion)

10.3.1.3 Eastern Europe Flame Retardants Market Estimates and Forecasts, By Type (2020-2032) (USD Billion)  

10.3.1.4 Eastern Europe Flame Retardants Market Estimates and Forecasts, By Application (2020-2032) (USD Billion)

10.3.1.5 Eastern Europe Flame Retardants Market Estimates and Forecasts, By End Use (2020-2032) (USD Billion)

10.3.1.6 Poland

10.3.1.6.1 Poland Flame Retardants Market Estimates and Forecasts, By Type (2020-2032) (USD Billion)

10.3.1.6.2 Poland Flame Retardants Market Estimates and Forecasts, By Application (2020-2032) (USD Billion)

10.3.1.6.3 Poland Flame Retardants Market Estimates and Forecasts, By End Use (2020-2032) (USD Billion)

10.3.1.7 Romania

10.3.1.7.1 Romania Flame Retardants Market Estimates and Forecasts, By Type (2020-2032) (USD Billion)

10.3.1.7.2 Romania Flame Retardants Market Estimates and Forecasts, By Application (2020-2032) (USD Billion)

10.3.1.7.3 Romania Flame Retardants Market Estimates and Forecasts, By End Use (2020-2032) (USD Billion)

10.3.1.8 Hungary

10.3.1.8.1 Hungary Flame Retardants Market Estimates and Forecasts, By Type (2020-2032) (USD Billion)

10.3.1.8.2 Hungary Flame Retardants Market Estimates and Forecasts, By Application (2020-2032) (USD Billion)

10.3.1.8.3 Hungary Flame Retardants Market Estimates and Forecasts, By End Use (2020-2032) (USD Billion)

10.3.1.9 Turkey

10.3.1.9.1 Turkey Flame Retardants Market Estimates and Forecasts, By Type (2020-2032) (USD Billion)

10.3.1.9.2 Turkey Flame Retardants Market Estimates and Forecasts, By Application (2020-2032) (USD Billion)

10.3.1.9.3 Turkey Flame Retardants Market Estimates and Forecasts, By End Use (2020-2032) (USD Billion)

10.3.1.10 Rest of Eastern Europe

10.3.1.10.1 Rest of Eastern Europe Flame Retardants Market Estimates and Forecasts, By Type (2020-2032) (USD Billion)

10.3.1.10.2 Rest of Eastern Europe Flame Retardants Market Estimates and Forecasts, By Application (2020-2032) (USD Billion)

10.3.1.10.3 Rest of Eastern Europe Flame Retardants Market Estimates and Forecasts, By End Use (2020-2032) (USD Billion)

10.3.2 Western Europe

10.3.2.1 Trends Analysis

10.3.2.2 Western Europe Flame Retardants Market Estimates and Forecasts, by Country (2020-2032) (USD Billion)

10.3.2.3 Western Europe Flame Retardants Market Estimates and Forecasts, By Type (2020-2032) (USD Billion)  

10.3.2.4 Western Europe Flame Retardants Market Estimates and Forecasts, By Application (2020-2032) (USD Billion)

10.3.2.5 Western Europe Flame Retardants Market Estimates and Forecasts, By End Use (2020-2032) (USD Billion)

10.3.2.6 Germany

10.3.2.6.1 Germany Flame Retardants Market Estimates and Forecasts, By Type (2020-2032) (USD Billion)

10.3.2.6.2 Germany Flame Retardants Market Estimates and Forecasts, By Application (2020-2032) (USD Billion)

10.3.2.6.3 Germany Flame Retardants Market Estimates and Forecasts, By End Use (2020-2032) (USD Billion)

10.3.2.7 France

10.3.2.7.1 France Flame Retardants Market Estimates and Forecasts, By Type (2020-2032) (USD Billion)

10.3.2.7.2 France Flame Retardants Market Estimates and Forecasts, By Application (2020-2032) (USD Billion)

10.3.2.7.3 France Flame Retardants Market Estimates and Forecasts, By End Use (2020-2032) (USD Billion)

10.3.2.8 UK

10.3.2.8.1 UK Flame Retardants Market Estimates and Forecasts, By Type (2020-2032) (USD Billion)

10.3.2.8.2 UK Flame Retardants Market Estimates and Forecasts, By Application (2020-2032) (USD Billion)

10.3.2.8.3 UK Flame Retardants Market Estimates and Forecasts, By End Use (2020-2032) (USD Billion)

10.3.2.9 Italy

10.3.2.9.1 Italy Flame Retardants Market Estimates and Forecasts, By Type (2020-2032) (USD Billion)

10.3.2.9.2 Italy Flame Retardants Market Estimates and Forecasts, By Application (2020-2032) (USD Billion)

10.3.2.9.3 Italy Flame Retardants Market Estimates and Forecasts, By End Use (2020-2032) (USD Billion)

10.3.2.10 Spain

10.3.2.10.1 Spain Flame Retardants Market Estimates and Forecasts, By Type (2020-2032) (USD Billion)

10.3.2.10.2 Spain Flame Retardants Market Estimates and Forecasts, By Application (2020-2032) (USD Billion)

10.3.2.10.3 Spain Flame Retardants Market Estimates and Forecasts, By End Use (2020-2032) (USD Billion)

10.3.2.11 Netherlands

10.3.2.11.1 Netherlands Flame Retardants Market Estimates and Forecasts, By Type (2020-2032) (USD Billion)

10.3.2.11.2 Netherlands Flame Retardants Market Estimates and Forecasts, By Application (2020-2032) (USD Billion)

10.3.2.11.3 Netherlands Flame Retardants Market Estimates and Forecasts, By End Use (2020-2032) (USD Billion)

10.3.2.12 Switzerland

10.3.2.12.1 Switzerland Flame Retardants Market Estimates and Forecasts, By Type (2020-2032) (USD Billion)

10.3.2.12.2 Switzerland Flame Retardants Market Estimates and Forecasts, By Application (2020-2032) (USD Billion)

10.3.2.12.3 Switzerland Flame Retardants Market Estimates and Forecasts, By End Use (2020-2032) (USD Billion)

10.3.2.13 Austria

10.3.2.13.1 Austria Flame Retardants Market Estimates and Forecasts, By Type (2020-2032) (USD Billion)

10.3.2.13.2 Austria Flame Retardants Market Estimates and Forecasts, By Application (2020-2032) (USD Billion)

10.3.2.13.3 Austria Flame Retardants Market Estimates and Forecasts, By End Use (2020-2032) (USD Billion)

10.3.2.14 Rest of Western Europe

10.3.2.14.1 Rest of Western Europe Flame Retardants Market Estimates and Forecasts, By Type (2020-2032) (USD Billion)

10.3.2.14.2 Rest of Western Europe Flame Retardants Market Estimates and Forecasts, By Application (2020-2032) (USD Billion)

10.3.2.14.3 Rest of Western Europe Flame Retardants Market Estimates and Forecasts, By End Use (2020-2032) (USD Billion)

10.4 Asia Pacific

10.4.1 Trends Analysis

10.4.2 Asia Pacific Flame Retardants Market Estimates and Forecasts, by Country (2020-2032) (USD Billion)

10.4.3 Asia Pacific Flame Retardants Market Estimates and Forecasts, By Type (2020-2032) (USD Billion)  

10.4.4 Asia Pacific Flame Retardants Market Estimates and Forecasts, By Application (2020-2032) (USD Billion)

10.4.5 Asia Pacific Flame Retardants Market Estimates and Forecasts, By End Use (2020-2032) (USD Billion)

10.4.6 China

10.4.6.1 China Flame Retardants Market Estimates and Forecasts, By Type (2020-2032) (USD Billion)

10.4.6.2 China Flame Retardants Market Estimates and Forecasts, By Application (2020-2032) (USD Billion)

10.4.6.3 China Flame Retardants Market Estimates and Forecasts, By End Use (2020-2032) (USD Billion)

10.4.7 India

10.4.7.1 India Flame Retardants Market Estimates and Forecasts, By Type (2020-2032) (USD Billion)

10.4.7.2 India Flame Retardants Market Estimates and Forecasts, By Application (2020-2032) (USD Billion)

10.4.7.3 India Flame Retardants Market Estimates and Forecasts, By End Use (2020-2032) (USD Billion)

10.4.8 Japan

10.4.8.1 Japan Flame Retardants Market Estimates and Forecasts, By Type (2020-2032) (USD Billion)

10.4.8.2 Japan Flame Retardants Market Estimates and Forecasts, By Application (2020-2032) (USD Billion)

10.4.8.3 Japan Flame Retardants Market Estimates and Forecasts, By End Use (2020-2032) (USD Billion)

10.4.9 South Korea

10.4.9.1 South Korea Flame Retardants Market Estimates and Forecasts, By Type (2020-2032) (USD Billion)

10.4.9.2 South Korea Flame Retardants Market Estimates and Forecasts, By Application (2020-2032) (USD Billion)

10.4.9.3 South Korea Flame Retardants Market Estimates and Forecasts, By End Use (2020-2032) (USD Billion)

10.4.10 Vietnam

10.4.10.1 Vietnam Flame Retardants Market Estimates and Forecasts, By Type (2020-2032) (USD Billion)

10.4.10.2 Vietnam Flame Retardants Market Estimates and Forecasts, By Application (2020-2032) (USD Billion)

10.4.10.3 Vietnam Flame Retardants Market Estimates and Forecasts, By End Use (2020-2032) (USD Billion)

10.4.11 Singapore

10.4.11.1 Singapore Flame Retardants Market Estimates and Forecasts, By Type (2020-2032) (USD Billion)

10.4.11.2 Singapore Flame Retardants Market Estimates and Forecasts, By Application (2020-2032) (USD Billion)

10.4.11.3 Singapore Flame Retardants Market Estimates and Forecasts, By End Use (2020-2032) (USD Billion)

10.4.12 Australia

10.4.12.1 Australia Flame Retardants Market Estimates and Forecasts, By Type (2020-2032) (USD Billion)

10.4.12.2 Australia Flame Retardants Market Estimates and Forecasts, By Application (2020-2032) (USD Billion)

10.4.12.3 Australia Flame Retardants Market Estimates and Forecasts, By End Use (2020-2032) (USD Billion)

10.4.13 Rest of Asia Pacific

10.4.13.1 Rest of Asia Pacific Flame Retardants Market Estimates and Forecasts, By Type (2020-2032) (USD Billion)

10.4.13.2 Rest of Asia Pacific Flame Retardants Market Estimates and Forecasts, By Application (2020-2032) (USD Billion)

10.4.13.3 Rest of Asia Pacific Flame Retardants Market Estimates and Forecasts, By End Use (2020-2032) (USD Billion)

10.5 Middle East and Africa

10.5.1 Middle East

10.5.1.1 Trends Analysis

10.5.1.2 Middle East Flame Retardants Market Estimates and Forecasts, by Country (2020-2032) (USD Billion)

10.5.1.3 Middle East Flame Retardants Market Estimates and Forecasts, By Type (2020-2032) (USD Billion)  

10.5.1.4 Middle East Flame Retardants Market Estimates and Forecasts, By Application (2020-2032) (USD Billion)

10.5.1.5 Middle East Flame Retardants Market Estimates and Forecasts, By End Use (2020-2032) (USD Billion)

10.5.1.6 UAE

10.5.1.6.1 UAE Flame Retardants Market Estimates and Forecasts, By Type (2020-2032) (USD Billion)

10.5.1.6.2 UAE Flame Retardants Market Estimates and Forecasts, By Application (2020-2032) (USD Billion)

10.5.1.6.3 UAE Flame Retardants Market Estimates and Forecasts, By End Use (2020-2032) (USD Billion)

10.5.1.7 Egypt

10.5.1.7.1 Egypt Flame Retardants Market Estimates and Forecasts, By Type (2020-2032) (USD Billion)

10.5.1.7.2 Egypt Flame Retardants Market Estimates and Forecasts, By Application (2020-2032) (USD Billion)

10.5.1.7.3 Egypt Flame Retardants Market Estimates and Forecasts, By End Use (2020-2032) (USD Billion)

10.5.1.8 Saudi Arabia

10.5.1.8.1 Saudi Arabia Flame Retardants Market Estimates and Forecasts, By Type (2020-2032) (USD Billion)

10.5.1.8.2 Saudi Arabia Flame Retardants Market Estimates and Forecasts, By Application (2020-2032) (USD Billion)

10.5.1.8.3 Saudi Arabia Flame Retardants Market Estimates and Forecasts, By End Use (2020-2032) (USD Billion)

10.5.1.9 Qatar

10.5.1.9.1 Qatar Flame Retardants Market Estimates and Forecasts, By Type (2020-2032) (USD Billion)

10.5.1.9.2 Qatar Flame Retardants Market Estimates and Forecasts, By Application (2020-2032) (USD Billion)

10.5.1.9.3 Qatar Flame Retardants Market Estimates and Forecasts, By End Use (2020-2032) (USD Billion)

10.5.1.10 Rest of Middle East

10.5.1.10.1 Rest of Middle East Flame Retardants Market Estimates and Forecasts, By Type (2020-2032) (USD Billion)

10.5.1.10.2 Rest of Middle East Flame Retardants Market Estimates and Forecasts, By Application (2020-2032) (USD Billion)

10.5.1.10.3 Rest of Middle East Flame Retardants Market Estimates and Forecasts, By End Use (2020-2032) (USD Billion)

10.5.2 Africa

10.5.2.1 Trends Analysis

10.5.2.2 Africa Flame Retardants Market Estimates and Forecasts, by Country (2020-2032) (USD Billion)

10.5.2.3 Africa Flame Retardants Market Estimates and Forecasts, By Type (2020-2032) (USD Billion)  

10.5.2.4 Africa Flame Retardants Market Estimates and Forecasts, By Application (2020-2032) (USD Billion)

10.5.2.5 Africa Flame Retardants Market Estimates and Forecasts, By End Use (2020-2032) (USD Billion)

10.5.2.6 South Africa

10.5.2.6.1 South Africa Flame Retardants Market Estimates and Forecasts, By Type (2020-2032) (USD Billion)

10.5.2.6.2 South Africa Flame Retardants Market Estimates and Forecasts, By Application (2020-2032) (USD Billion)

10.5.2.6.3 South Africa Flame Retardants Market Estimates and Forecasts, By End Use (2020-2032) (USD Billion)

10.5.2.7 Nigeria

10.5.2.7.1 Nigeria Flame Retardants Market Estimates and Forecasts, By Type (2020-2032) (USD Billion)

10.5.2.7.2 Nigeria Flame Retardants Market Estimates and Forecasts, By Application (2020-2032) (USD Billion)

10.5.2.7.3 Nigeria Flame Retardants Market Estimates and Forecasts, By End Use (2020-2032) (USD Billion)

10.5.2.8 Rest of Africa

10.5.2.8.1 Rest of Africa Flame Retardants Market Estimates and Forecasts, By Type (2020-2032) (USD Billion)

10.5.2.8.2 Rest of Africa Flame Retardants Market Estimates and Forecasts, By Application (2020-2032) (USD Billion)

10.5.2.8.3 Rest of Africa Flame Retardants Market Estimates and Forecasts, By End Use (2020-2032) (USD Billion)

10.6 Latin America

10.6.1 Trends Analysis

10.6.2 Latin America Flame Retardants Market Estimates and Forecasts, by Country (2020-2032) (USD Billion)

10.6.3 Latin America Flame Retardants Market Estimates and Forecasts, By Type (2020-2032) (USD Billion)  

10.6.4 Latin America Flame Retardants Market Estimates and Forecasts, By Application (2020-2032) (USD Billion)

10.6.5 Latin America Flame Retardants Market Estimates and Forecasts, By End Use (2020-2032) (USD Billion)

10.6.6 Brazil

10.6.6.1 Brazil Flame Retardants Market Estimates and Forecasts, By Type (2020-2032) (USD Billion)

10.6.6.2 Brazil Flame Retardants Market Estimates and Forecasts, By Application (2020-2032) (USD Billion)

10.6.6.3 Brazil Flame Retardants Market Estimates and Forecasts, By End Use (2020-2032) (USD Billion)

10.6.7 Argentina

10.6.7.1 Argentina Flame Retardants Market Estimates and Forecasts, By Type (2020-2032) (USD Billion)

10.6.7.2 Argentina Flame Retardants Market Estimates and Forecasts, By Application (2020-2032) (USD Billion)

10.6.7.3 Argentina Flame Retardants Market Estimates and Forecasts, By End Use (2020-2032) (USD Billion)

10.6.8 Colombia

10.6.8.1 Colombia Flame Retardants Market Estimates and Forecasts, By Type (2020-2032) (USD Billion)

10.6.8.2 Colombia Flame Retardants Market Estimates and Forecasts, By Application (2020-2032) (USD Billion)

10.6.8.3 Colombia Flame Retardants Market Estimates and Forecasts, By End Use (2020-2032) (USD Billion)

10.6.9 Rest of Latin America

10.6.9.1 Rest of Latin America Flame Retardants Market Estimates and Forecasts, By Type (2020-2032) (USD Billion)

10.6.9.2 Rest of Latin America Flame Retardants Market Estimates and Forecasts, By Application (2020-2032) (USD Billion)

10.6.9.3 Rest of Latin America Flame Retardants Market Estimates and Forecasts, By End Use (2020-2032) (USD Billion)

11. Company Profiles

11.1 ICL Group

11.1.1 Company Overview

11.1.2 Financial

11.1.3 Products/ Services Offered

11.1.4 SWOT Analysis

11.2 LANXESS

11.2.1 Company Overview

11.2.2 Financial

11.2.3 Products/ Services Offered

11.2.4 SWOT Analysis

11.3 Albemarle Corporation

11.3.1 Company Overview

11.3.2 Financial

11.3.3 Products/ Services Offered

11.3.4 SWOT Analysis

11.4 BASF SE

11.4.1 Company Overview

11.4.2 Financial

11.4.3 Products/ Services Offered

11.4.4 SWOT Analysis

11.5 Jiangsu Yoke Technology Co. Ltd

11.5.1 Company Overview

11.5.2 Financial

11.5.3 Products/ Services Offered

11.5.4 SWOT Analysis

11.6 Dupont

11.6.1 Company Overview

11.6.2 Financial

11.6.3 Products/ Services Offered

11.6.4 SWOT Analysis

11.7 Daikin

11.7.1 Company Overview

11.7.2 Financial

11.7.3 Products/ Services Offered

11.7.4 SWOT Analysis

11.8 Dow

11.8.1 Company Overview

11.8.2 Financial

11.8.3 Products/ Services Offered

11.8.4 SWOT Analysis

11.9 Huntsman International LLC

11.9.1 Company Overview

11.9.2 Financial

11.9.3 Products/ Services Offered

11.9.4 SWOT Analysis

11.10 Clariant

11.10.1 Company Overview

11.10.2 Financial

11.10.3 Products/ Services Offered

11.10.4 SWOT Analysis

12. Use Cases and Best Practices

13. Conclusion

An accurate research report requires proper strategizing as well as implementation. There are multiple factors involved in the completion of good and accurate research report and selecting the best methodology to compete the research is the toughest part. Since the research reports we provide play a crucial role in any company’s decision-making process, therefore we at SNS Insider always believe that we should choose the best method which gives us results closer to reality. This allows us to reach at a stage wherein we can provide our clients best and accurate investment to output ratio.

Each report that we prepare takes a timeframe of 350-400 business hours for production. Starting from the selection of titles through a couple of in-depth brain storming session to the final QC process before uploading our titles on our website we dedicate around 350 working hours. The titles are selected based on their current market cap and the foreseen CAGR and growth.


The 5 steps process:

Step 1: Secondary Research:

Secondary Research or Desk Research is as the name suggests is a research process wherein, we collect data through the readily available information. In this process we use various paid and unpaid databases which our team has access to and gather data through the same. This includes examining of listed companies’ annual reports, Journals, SEC filling etc. Apart from this our team has access to various associations across the globe across different industries. Lastly, we have exchange relationships with various university as well as individual libraries.

Secondary Research

Step 2: Primary Research

When we talk about primary research, it is a type of study in which the researchers collect relevant data samples directly, rather than relying on previously collected data.  This type of research is focused on gaining content specific facts that can be sued to solve specific problems. Since the collected data is fresh and first hand therefore it makes the study more accurate and genuine.

We at SNS Insider have divided Primary Research into 2 parts.

Part 1 wherein we interview the KOLs of major players as well as the upcoming ones across various geographic regions. This allows us to have their view over the market scenario and acts as an important tool to come closer to the accurate market numbers. As many as 45 paid and unpaid primary interviews are taken from both the demand and supply side of the industry to make sure we land at an accurate judgement and analysis of the market.

This step involves the triangulation of data wherein our team analyses the interview transcripts, online survey responses and observation of on filed participants. The below mentioned chart should give a better understanding of the part 1 of the primary interview.

Primary Research

Part 2: In this part of primary research the data collected via secondary research and the part 1 of the primary research is validated with the interviews from individual consultants and subject matter experts.

Consultants are those set of people who have at least 12 years of experience and expertise within the industry whereas Subject Matter Experts are those with at least 15 years of experience behind their back within the same space. The data with the help of two main processes i.e., FGDs (Focused Group Discussions) and IDs (Individual Discussions). This gives us a 3rd party nonbiased primary view of the market scenario making it a more dependable one while collation of the data pointers.

Step 3: Data Bank Validation

Once all the information is collected via primary and secondary sources, we run that information for data validation. At our intelligence centre our research heads track a lot of information related to the market which includes the quarterly reports, the daily stock prices, and other relevant information. Our data bank server gets updated every fortnight and that is how the information which we collected using our primary and secondary information is revalidated in real time.

Data Bank Validation

Step 4: QA/QC Process

After all the data collection and validation our team does a final level of quality check and quality assurance to get rid of any unwanted or undesired mistakes. This might include but not limited to getting rid of the any typos, duplication of numbers or missing of any important information. The people involved in this process include technical content writers, research heads and graphics people. Once this process is completed the title gets uploader on our platform for our clients to read it.

Step 5: Final QC/QA Process:

This is the last process and comes when the client has ordered the study. In this process a final QA/QC is done before the study is emailed to the client. Since we believe in giving our clients a good experience of our research studies, therefore, to make sure that we do not lack at our end in any way humanly possible we do a final round of quality check and then dispatch the study to the client.

KEY SEGMENTS:

By Type

  • Aluminum Trihydrate
  • Antimony Oxide
  • Brominated
  • Chlorinated
  • Phosphorous
  • Nitrogen
  • Others

By Application

  • Epoxy
  • Unsaturated Polyester
  • Polyolefins
  • Polyvinyl chloride
  • Polyurethane
  • Polystyrene
  • Others

By End Use

  • Building & Construction
  • Electronics & Appliances
  • Automotive & Transportation
  • Wires & Cable
  • Textile
  • Others

Request for Segment Customization as per your Business Requirement: Segment Customization Request

REGIONAL COVERAGE:

North America

  • US
  • Canada
  • Mexico

Europe

  • Eastern Europe
    • Poland
    • Romania
    • Hungary
    • Turkey
    • Rest of Eastern Europe
  • Western Europe
    • Germany
    • France
    • UK
    • Italy
    • Spain
    • Netherlands
    • Switzerland
    • Austria
    • Rest of Western Europe

Asia Pacific

  • China
  • India
  • Japan
  • South Korea
  • Vietnam
  • Singapore
  • Australia
  • Rest of Asia Pacific

Middle East & Africa

  • Middle East
    • UAE
    • Egypt
    • Saudi Arabia
    • Qatar
    • Rest of the Middle East
  • Africa
    • Nigeria
    • South Africa
    • Rest of Africa

Latin America

  • Brazil
  • Argentina
  • Colombia
  • Rest of Latin America

Request for Country Level Research Report: Country Level Customization Request

AVAILABLE CUSTOMIZATION:

With the given market data, SNS Insider offers customization as per the company’s specific needs. The following customization options are available for the report:

  • Product Analysis
  • Criss-Cross segment analysis (e.g. Product X Application)
  • Product Matrix which gives a detailed comparison of the product portfolio of each company
  • Geographic Analysis
  • Additional countries in any of the regions
  • Company Information
  • Detailed analysis and profiling of additional market players (Up to five)

  •            5000 (33% Discount)


  •            8950 (40% Discount)


  •            3050 (23% Discount)

Start a Conversation

Hi! Click one of our member below to chat on Phone