Fiberglass Market Report Scope & Overview:
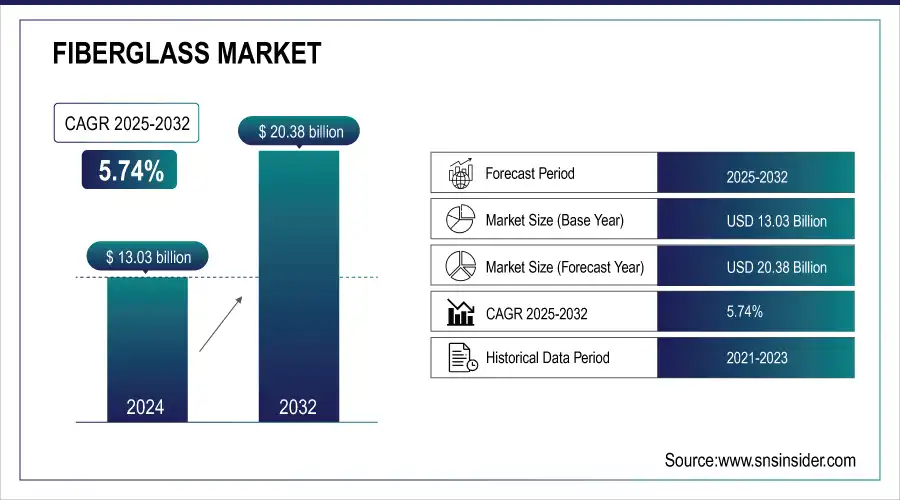
The Fiberglass Market size was USD 13.03 Billion in 2024 and is expected to reach USD 20.38 Billion by 2032 and grow at a CAGR of 5.74% over the forecast period of 2025-2032.
To get more information on Fiberglass Market - Request Free Sample Report
The Fiberglass Market is growing due to rising demand across automotive, construction, energy, and industrial sectors. Its lightweight, durable, and corrosion-resistant properties make it ideal for applications such as automotive components, wind turbine blades, roofing, insulation, and piping systems. Increasing focus on fuel efficiency and sustainability in automotive and renewable energy sectors is driving adoption. Growth in construction, particularly in emerging economies, further boosts demand for high-performance building materials. Technological advancements in fiberglass composites, coupled with rising investments in infrastructure and renewable energy projects, are accelerating market expansion globally, making fiberglass an essential material for modern industrial applications.

Market Size and Forecast:
-
Fiberglass Market Size in 2024: USD 13.03 Billion
-
Fiberglass Market Size by 2032: USD 20.38 Billion
-
CAGR: 5.74% from 2025 to 2032
-
Base Year: 2024
-
Forecast Period: 2025–2032
-
Historical Data: 2021–2023
Key Fiberglass Market Trends
-
Growing demand in construction due to lightweight, corrosion-resistant fiberglass reinforcement.
-
Expansion in wind energy sector for wind turbine blades driving fiberglass consumption.
-
Increasing use in automotive for lightweighting and fuel efficiency.
-
Rising adoption in marine and aerospace applications for durability and high strength-to-weight ratio.
-
Development of eco-friendly and recyclable fiberglass composites for sustainability.
-
Innovations in resin and fiber technology improving performance and reducing production costs.
-
Shift towards 3D and complex-shaped fiberglass components for industrial customization.
-
Increasing electrical and electronics applications, including insulation and PCB substrates.
Fiberglass Market Growth Drivers
-
Increasing demand for lightweight and high-performance materials which drives the market growth.
The demand for lightweight, high-performance materials is one of the major drivers for the fiberglass market as all industries are demanding advanced materials that will provide better strength, durability, and efficiency. Highly speculated for its strength-to-weight ratio and languorous resistance is fiberglass which makes it an alternative to conventional materials like steel and aluminum with unprecedented thermal insulation properties. The growing trend of lightweight components in the automotive and aerospace industries to improve fuel efficiency and meet stringent emission standards has propelled the market for fiberglass-reinforced composite materials. Likewise, in wind applications, lighter fiberglass materials play a significant role in making longer and more cost-effective wind turbine blades, yielding higher energy production while minimizing operational costs. In addition, the construction and industrial sectors are increasingly integrating high-performance fiberglass in insulation, reinforcement, and composite structures to enhance energy efficiency and durability.
Fiberglass Market Restraints
-
High production and energy costs may hamper the market growth.
Hire production and energy costs attributed to fiberglass manufacturing are major hindrances to market growth. To manufacture glass, raw materials like silica sand, alumina, limestone, and boron must first be melted at very high temperatures, a highly energy-intensive process. However, the cost of operation is very high, as this process requires large amounts of energy, which could hit profitability, particularly in regions with variable costs of electricity and fuel. Moreover, production costs from specialized labor, equipment maintenance, and environmental compliance are greater. Energy prices rallying because of the ongoing geopolitical situation and supply chain issues is directly impacting manufacturing costs, creating a scenario where fiberglass just isn't as competitive against more expensive carbon fiber or thermoplastics. This has put them under continuous duress to improve production efficiency and consider cheaper alternatives to maintain their growth in the market.
Fiberglass Market Opportunities
-
Advancements in fiberglass recycling technologies create an opportunity in the market.
Fiberglass recycling technologies are evolving to provide a huge opportunity for the market to resolve issues in sustainability and minimize carbon footprint in the environment. Being thus non-biodegradable, fiberglass cannot be properly disposed of by conventional methods, such as landfilling and incineration, and will thus pose ecological issues. However innovative developments in mechanical, chemical, and thermal recycling processes are allowing fiberglass waste to be recovered more efficiently than ever before. In this regard, companies are creating closed-loop recycling structures that process fiberglass from end-of-life and reuse it in new applications, minimizing the requirement for virgin raw materials. Also, new pyrolysis and solvolysis methods, which decompose fiberglass composites into reusable fibers and resins, create more economical avenues for recycling such materials.
Fiberglass Market Challenges
-
Difficulties in fiberglass recycling and waste management may create a challenge for the market.
Due to its specificity, composites, such as fiberglass, are challenging to recycle, thus, creating a hurdle for its waste management and recycling will hamper the market growth. Conventional ways to dispose of waste like dumping into landfills and incinerating pollute the environment and get more challenging by time with more waste management rules from governments around the world. In addition, while recycling metals and thermoplastics is merely melting those at high temperatures and reshaping them, technical recycling of fiberglass is a complex and expensive process. While new upcycling methods through chemical and thermal recycling are in development, they are at a very early stage and not widely available, as these technologies are costly and the infrastructure is limited. Without a scalable and cost-effective recycling system in place, waste grows and manufacturers are pushed to create sustainable alternatives. With rising environmental issues, firms have to be creative with their recycling technologies and new materials, to hold their competitiveness, while everyone on the planet is trying to be more sustainable.
Fiberglass Market Segmentation Analysis:
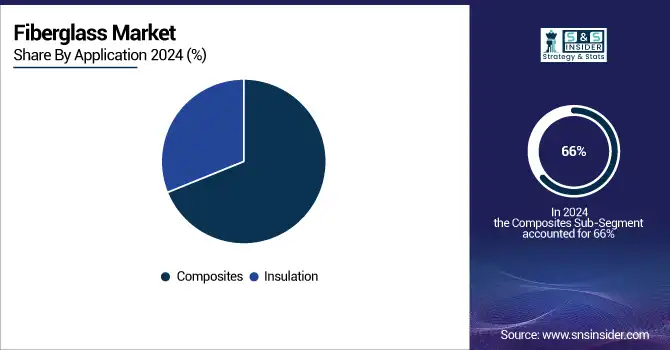
By Application
Composites held the largest market share around 66% in 2024. Fiberglass composites have now replaced metals in many structural components, reinforced panels, and high-performance materials because of their low density and better specific stiffness and strength. This has further increased the adoption of fiberglass composites, with rising demand for fuel-efficient vehicles & aircraft reducing energy consumption by comparatively sacrificing weights. Moreover, the growth of the renewable energy sector worldwide, specifically the production of wind turbine blades has been significant to the market growth. The enhancement in composite manufacturing processes, including resin infusion and automated fiber placement technology, is leading to a wider application of composites in various sectors. Fiberglass composites are forecasted to remain the leader as industries look for lower-cost, high-performance materials.
By Product Type
Glass wool held the largest market share around 37% in 2024. Glass wool is usually used in the insulation, construction, and industrial sectors. Glass wool is a type of fiber obtained from the fine strands of glass, and the large glass wool fibers of thermal and sound insulation are even used in building construction for homes, commercial buildings, and industrial buildings. It is also in demand owing to the growing emphasis on energy-efficient and sustainable construction practices, as well as stringent building insulation regulations enforced by governments across the globe to decrease energy consumption. Furthermore, glass wool is easy to handle, lightweight, and non-combustible, making it superior to other insulating materials (barrier). The market share of polymer insulators increased with its rising acceptance in HVAC systems, automotive applications, and industrial equipment insulation.
By End Use Industry
Construction held the largest market share around 38% in 2024. This is owing to the rising demand for materials that are lightweight, energy-efficient, and durable. Found in insulation, roofing, cladding, reinforced panels, and structural components, fiberglass is an essential construction material in residential, commercial, and industrial jobs. The growing focus on energy-efficient buildings and green ventilation systems has also augmented the demand for fiberglass insulation as it reduces energy consumption with improved thermal efficiency. Also, composite material made from fiberglass have established their position in bridges, tunnels, and other infrastructure projects, offering high strength, corrosion resistance, and long-life services comparable to conventional materials such as steel and concrete.
Fiberglass Market Regional Analysis
Asia Pacific Fiberglass Market Insights
Asia Pacific held the largest market share around 42% in 2024. Rapid industrialization, urbanization, and infrastructure development in major economies across the region such as China, India, Japan, and South Korea enabled Asia Pacific to dominate the fiberglass market. Various end-use industries are growth drivers for fiberglass including construction, automotive, aerospace, and wind energy, in addition, various governments are promoting energy-efficient buildings, electric vehicles, and renewable energy projects in the region leading to the high demand for fiberglass in these applications. China is the largest producer and consumer of fiberglass in the world with an established manufacturing base and investments in the manufacture of composite materials, and insulation products, and a stronghold in the regional market. Furthermore, factors such as an inexpensive supply of raw materials, labor, and favorable government policies have led to increased foreign direct investments (FDIs) in the fiberglass manufacturing industry of the region.

Get Customized Report as per Your Business Requirement - Enquiry Now
North America Fiberglass Market Insights
North America held a significant market share in the market. The fiberglass market in North America accounted for a large market share owing to high demand across the construction, automotive, aerospace, and renewable energy sectors. Fiberglass insulation materials are widely required in this region due to the well-established construction industry and focus on energy-efficient buildings. Furthermore, the increasing use of fiberglass composites in the aerospace and automotive sector especially in manufacturing lightweight and fuel-efficient vehicles and aircraft is anticipated to complement the growth of the fiberglass market over the forecast period. The U.S. and Canada's wind energy sector is another major contributor, with fiberglass used in wind turbine blades to help them be stronger and perform better. Additionally, the established fiberglass manufacturers and continuous advancements in the R&D of new composite materials further consolidated the share of the region.
Europe Fiberglass Market Insights
The Europe Fiberglass Market is witnessing steady growth in 2024, driven by the region’s advanced manufacturing infrastructure, strong automotive and construction industries, and emphasis on lightweight and sustainable materials. Key markets such as Germany, France, and the U.K. are adopting fiberglass extensively for automotive components, wind energy, and building applications. Environmental regulations and EU directives on energy efficiency are encouraging the use of durable, recyclable, and high-performance fiberglass materials. Moreover, the presence of several leading fiberglass manufacturers and continuous innovation in composite solutions are further propelling market growth across the region.
Latin America (LATAM) Fiberglass Market Insights
The LATAM Fiberglass Market is gradually expanding in 2024, fueled by growing industrialization, infrastructure development, and increasing demand for construction and automotive materials. Countries such as Brazil, Mexico, and Argentina are emerging as major adopters of fiberglass for roofing, insulation, and transportation applications. Investments in renewable energy projects, such as wind farms, are also driving demand for fiberglass composites. Additionally, government initiatives to improve energy efficiency and modernize industrial facilities are stimulating the adoption of high-performance fiberglass solutions across the region.
Middle East & Africa (MEA) Fiberglass Market Insights
The MEA Fiberglass Market is gaining significant momentum in 2024, driven by rapid urbanization, industrial diversification, and growth in the energy and construction sectors. Countries like the UAE, Saudi Arabia, and South Africa are increasingly using fiberglass for infrastructure projects, automotive components, and industrial insulation. Regional focus on sustainable and lightweight materials is encouraging the adoption of advanced fiberglass composites. Furthermore, government-led initiatives to enhance renewable energy capacity, along with rising investments in residential and commercial construction, are accelerating market growth across the region.
Fiberglass Market Competitive Landscape
LANXESS
LANXESS is a global specialty chemicals company offering high-performance plastics and materials for automotive, industrial, and e-mobility applications.
-
In 2024, LANXESS presented new high-performance plastic solutions for lightweight materials for automotive, two-wheeler, and e-mobility applications at PLASTINDIA 2023 held in Gandhinagar, Gujarat, India. These advanced plastics are designed for sustainable mobility, providing higher durability, lower weight, and improved fuel consumption.
Ahlstrom
Ahlstrom is a leading global provider of fiber-based materials for industrial, construction, and filtration applications.
-
In 2023, Ahlstrom introduced a new glass fiber tissue production line aimed at enhancing high-performance building materials. This expansion strengthens Ahlstrom’s position in the construction and industrial sectors by offering advanced glass fiber solutions for applications such as roofing, flooring, and wall coverings.
Saint-Gobain
Saint-Gobain is a multinational corporation specializing in construction materials, high-performance solutions, and interior/exterior building products.
-
In 2023, Saint-Gobain acquired U.P. Twiga Fiberglass Ltd., a leading manufacturer of glass wool insulation in India. This strategic acquisition enhances Saint-Gobain’s presence in the interior and façade solutions market and expands its product portfolio.
Fiberglass Market Key Players
-
Owens Corning (Advantex Glass Fiber, FOAMGLAS Insulation)
-
Saint-Gobain (Isover Glass Wool, Vetrotex Roving)
-
Nippon Electric Glass (E-Glass Fiber, T-glass Fiber)
-
Jushi Group Co. Ltd. (E6 Roving, ThermoFlow Chopped Strands)
-
3B-The Fiberglass Company (SE2020 Direct Roving, DS220 Chopped Strands)
-
PPG Industries (InnoFiber Roving, HYBON Roving)
-
Johns Manville (StarRov Roving, Microlite Insulation)
-
Taishan Fiberglass, Inc. (ECR Glass Fiber, High Modulus Fiber)
-
Chongqing Polycomp International Corp. (CPIC E-glass Roving, Chopped Strands)
-
Knauf Insulation (ECOSE Technology, JetSpray System)
-
AGY Holding Corp. (S-2 Glass Fiber, L-Glass™ Fiber)
-
BASF (Ultradur GF, Ultramid GF)
-
Toray Industries (Toray Glass Fiber, TORAYCA)
-
Hengshi Fiberglass (High-Performance Roving, Chopped Strand Mat)
-
Ahlstrom (Glass Veil, Engineered Glass Mat)
-
SGL Carbon (SIGRATHERM Insulation, SIGRABOND)
-
Taiwan Glass Industry Corp. (E-Glass Roving, Chopped Strands)
-
Negri Bossi (Glass Fiber-Reinforced Polymers, Thermoset Composites)
-
Şişecam (ECR Glass Fiber, Continuous Filament Mat)
-
LANXESS (Tepex Dynalite, Durethan GF)
| Report Attributes | Details |
|---|---|
|
Market Size in 2024 |
USD 13.03 Billion |
|
Market Size by 2032 |
USD 20.38 Billion |
|
CAGR |
CAGR of 5.74% From 2025 to 2032 |
|
Base Year |
2023 |
|
Forecast Period |
2025-2032 |
|
Historical Data |
2021-2022 |
|
Report Scope & Coverage |
Market Size, Segments Analysis, Competitive Landscape, Regional Analysis, DROC & SWOT Analysis, Forecast Outlook |
|
Key Segments |
• By Product Type (Glass Wool, Yarn, Roving, Chopped Strand, Others) |
|
Regional Analysis/Coverage |
North America (US, Canada), Europe (Germany, France, UK, Italy, Spain, Poland, Russsia, Rest of Europe), Asia Pacific (China, India, Japan, South Korea, Australia,ASEAN Countries, Rest of Asia Pacific), Middle East & Africa (UAE, Saudi Arabia, Qatar, Egypt, South Africa, Rest of Middle East & Africa), Latin America (Brazil, Argentina, Mexico, Colombia Rest of Latin America) |
|
Company Profiles |
|
