The Fiber Optics Market was valued at USD 8.73 billion in 2023 and is expected to reach USD 16.02 billion by 2032, growing at a CAGR of 7.02% over the forecast period 2024-2032. Optical fibers have been adopted rapidly in various industries due to advancements in technology, and the development of high-performance fiber types and materials. This growth is driven by rising demand from other measures of telecommunications, data centers, health care, and automotive. Fiber optic deployment plays a crucial role in the rollout of 5G networks, which require high-speed, low-latency communication. The demand for dependable high-capacity fiber optics will only grow as industries facilitate digital transformation to help support critical infrastructure and allow transformation to pursue innovation.
Key Drivers:
Rising Demand for High-Speed Internet and 5G Technologies Drives Growth in Fiber Optics Market
The fiber optics market is partly growing due to the greater need for high-speed internet, data transmission, and communication infrastructure enhancements. In both residential and commercial sectors, rising bandwidth consumption and demand for faster Internet connections create a key driver for fiber optics growth. The increased uptake of cloud computing, the Internet of Things (IoT), and 5G technologies will also increase the utilization of fiber-optic networks as they offer quicker and more dependable connections. These networks are also favored by their ability to transmit high amounts of data over long distances without signal degradation which also makes them ideal for data centers, telecom, and broadband providers.
Restrain:
High Installation Costs and Deployment Challenges Limit Fiber Optic Adoption for Small Businesses and Telecom Operators
High initial installation costs which include raw materials cost, installation labor, and operation-specific equipment are some of the major restraints. The difficulty and cost of deploying fiber optic cables, especially in already developed urban areas, may further increase the costs and the time required to deploy at scale. Moreover, fiber optics require regular upkeep and need to be upgraded, which will lead to long-term operational costs. Such aspects are tough to overcome for small and medium businesses or regional telecom operators when adopting fiber optic technologies that hampers market penetration.
Opportunity:
Emerging Economies and Industry Applications Drive Lucrative Growth Opportunities for Fiber Optics Market
There are plenty of growth prospects in this market as well, especially in an increasingly digitized world and emerging economies. Governments are pulling funds for fiber-optic networks to improve connectivity, while widespread rural and underserved areas have a great opportunity for market penetration. Moreover, rising applications for fiber optics in healthcare, automotive, and smart cities industries offer lucrative growth opportunities for fiber optics market players. The push for energy-saving technologies, smart grids, and automation creates additional opportunities further because optical fibers have much lower energy usage and higher performance than copper cables.
Challenges:
Competing Technologies and High Costs Pose Challenges to Fiber Optics Adoption and Market Growth
An additional challenge is from competing technologies, like wireless and copper-based networks, which are still advancing. Wireless Broadband and 5G networks can potentially provide the same level of speeds and performance as wired broadband but with no physical cabling required making it more economical and appealing in a lot of applications. Additionally, the initial investment in fiber optics technology makes it difficult for the technology to be adopted in rural or remote areas, which inhibits its growth potential. In some areas where the laws and zoning requirements are strict, this can lead to additional regulatory roadblocks and lengthy waiting periods between filing applications for permits to erect additional portions of the network.
By Type
Multi-mode fiber optic market accounted for 51.3% in 2023. The most common applications for multi-mode fibers are LANs (local area networks), data centers, and telecommunication systems because they can handle high bandwidth and more short-distance transmission. They can be extremely appealing to a wide range of industries from healthcare to education to manufacturing thanks to their low cost to set up and ease-of-use characteristics. With increasing data center transmission requirements, multi-mode fibers will remain a prominent portion of enterprise and lower-gradient networks.
Plastic Optical Fiber is projected to witness the highest growth over the compound annual growth rate (CAGR) from 2024 to 2032. Compared to the standard glass fiber optics, POF comes with more flexibility, is easier to install, and is less expensive. These are the characteristics that position POF for consumer electronics, automotive, and home networking applications. These competitive advantages of POF are expected to lead to faster adoption of this type of optical fiber, market growth higher than the average, and, therefore, the evolution in many industrial sectors where the demand for lightweight and low-cost POF solutions is increasing.
By Application
The telecom sector held the largest share of 40.3% in 2023. The increasing demand for solutions based on high-speed internet, data transmission, and seamless communication services in urban and rural areas is the main reason for this dominance. Fiber optics are a crucial component for telecom operator growth of broadband networks, allowing for faster speeds, more bandwidth, and increased reliability. Fiber optics in the telecommunication industry maintain their adoption thanks to the advances in 5G technologies, smart urban development, and the heightened demand for solid telecommunication infrastructure. Telecom companies have moved to fiber optic networks as their core networks to carry services and reach wide areas.
The medical segment is anticipated to grow with the fastest compound annual growth rate (CAGR) from 2024-2032. Growing demand for advanced medical technologies such as telemedicine, remote patient monitoring, and high-definition imaging is driving the need for high-speed, long-distance transmission of data, which fiber optics can provide. The low-cost, high-precision, and high-bandwidth capacity of fiber optics technology is widely used in medical applications like endoscopic, diagnosis imaging, and surgery. With an ever-growing digital transformation in healthcare, fiber optics will play an important role in enabling innovations and better patient care, fueling segment growth.
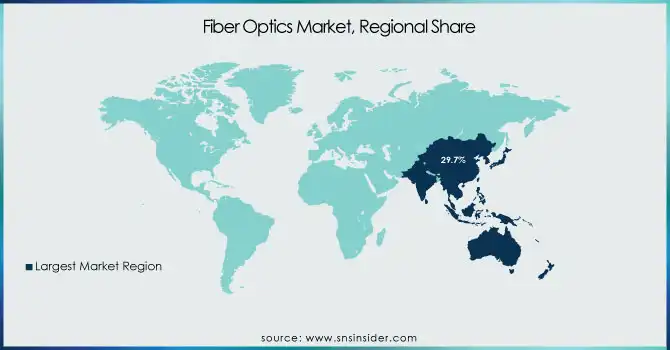
Asia Pacific region accounted for more than 29.7% of the overall fiber optics market share in 2023 and is projected to record the highest CAGR during 2024 – 2032. Factors fueling this surge include the region's fast-paced uptake of modern technologies, widespread infrastructure projects, and greater demand for high-speed Internet and communication services. Meanwhile, many other Asian nations as China, India, Japan, and South Korea are leading the pack on fiber optic networks and it also preparing to meet the post-pandemic era where the floodgates of digital services and smart technology are getting wider. Such is the case in China, for example, where the nation has launched an ambitious "Broadband China" project, which includes the construction of a national backbone fiber optic network to ensure universal access in urban and rural areas. The Chinese government is making large investments to promote fiber optics to help meet the demand for 5G, smart cities, and IoT applications. The "BharatNet" project in India is connecting more than 250,000 villages with fast fiber optics to address the connectivity gaps and allow rural communities to access digital services. While Japan and South Korea lead the way in 5G deployment, fiber optics are at the heart of both countries' plans to provide high-speed, low-latency communication for the next generation of mobile communication systems.
Some of the major players in the Fiber Optics Market are:
Corning Inc. (Optical Fiber, Fiber Connectors),
Cisco Systems, Inc. (Fiber Optic Transceivers, Fiber Optic Cables),
Prysmian Group (Optical Cables, Fiber Optic Solutions),
CommScope Holding Company, Inc. (Fiber Optic Cable, Structured Cabling),
Nexans S.A. (Fiber Optic Cables, Fiber Optic Connectors),
Sumitomo Electric Industries, Ltd. (Optical Fiber Cables, Optical Fiber Fusion Splicer),
Fujikura Ltd. (Fiber Optic Cables, Fusion Splicer),
OFS Fitel, LLC (Optical Fiber, Fiber Optic Cable Assemblies),
LS Cable & System Ltd. (Fiber Optic Cables, Fiber Connectors),
Hengtong Group (Optical Fiber Cable, Fiber Optic Splice Closure),
Sterlite Technologies Ltd. (Fiber Optic Cables, Optical Transport Solutions),
Broadcom Inc. (Fiber Optic Transceivers, Fiber Optic Modules),
Huawei Technologies Co., Ltd. (Fiber Optic Cables, Fiber Optic Transceivers),
TE Connectivity Ltd. (Fiber Optic Connectors, Optical Fiber Cables),
Zyxel Communications (Fiber Optic Modems, Fiber Optic Routers).
In August 2024, Corning and Lumen Technologies signed a supply agreement for next-generation fiber-optic cables to support the growing AI demands in data centers.
In February 2025, CommScope announced an official partnership with the MoneyGram Haas F1 Team as their Official Connectivity Partner. The collaboration will enhance the team's operations with advanced network solutions for trackside connectivity and race-day support.
Report Attributes | Details |
---|---|
Market Size in 2023 | USD 8.73 Billion |
Market Size by 2032 | USD 16.02 Billion |
CAGR | CAGR of 7.02% From 2024 to 2032 |
Base Year | 2023 |
Forecast Period | 2024-2032 |
Historical Data | 2020-2022 |
Report Scope & Coverage | Market Size, Segments Analysis, Competitive Landscape, Regional Analysis, DROC & SWOT Analysis, Forecast Outlook |
Key Segments | • By Type (Single-mode, Multi-mode, Plastic Optical Fiber (POF)) • By Application (Telecom, Oil & Gas, Military & Aerospace, BFSI, Medical, Railway, Others) |
Regional Analysis/Coverage | North America (US, Canada, Mexico), Europe (Eastern Europe [Poland, Romania, Hungary, Turkey, Rest of Eastern Europe] Western Europe] Germany, France, UK, Italy, Spain, Netherlands, Switzerland, Austria, Rest of Western Europe]), Asia Pacific (China, India, Japan, South Korea, Vietnam, Singapore, Australia, Rest of Asia Pacific), Middle East & Africa (Middle East [UAE, Egypt, Saudi Arabia, Qatar, Rest of Middle East], Africa [Nigeria, South Africa, Rest of Africa], Latin America (Brazil, Argentina, Colombia, Rest of Latin America) |
Company Profiles | Corning Inc., Cisco Systems, Inc., Prysmian Group, CommScope Holding Company, Inc., Nexans S.A., Sumitomo Electric Industries, Ltd., Fujikura Ltd., OFS Fitel, LLC, LS Cable & System Ltd., Hengtong Group, Sterlite Technologies Ltd., Broadcom Inc., Huawei Technologies Co., Ltd., TE Connectivity Ltd., Zyxel Communications. |
Ans: The Fiber Optics Market is expected to grow at a CAGR of 7.02% during 2024-2032.
Ans: Fiber Optics Market size was USD 8.73 Billion in 2023 and is expected to Reach USD 16.02 Billion by 2032.
Ans: The major growth factor of the fiber optics market is the increasing demand for high-speed internet and data transmission driven by advancements in 5G, cloud computing, and IoT technologies.
Ans: The Multi-mode segment dominated the Industrial battery market in 2023.
Ans: Asia Pacific dominated the Fiber Optics Market in 2023.
Table of Content
1. Introduction
1.1 Market Definition
1.2 Scope (Inclusion and Exclusions)
1.3 Research Assumptions
2. Executive Summary
2.1 Market Overview
2.2 Regional Synopsis
2.3 Competitive Summary
3. Research Methodology
3.1 Top-Down Approach
3.2 Bottom-up Approach
3.3. Data Validation
3.4 Primary Interviews
4. Market Dynamics Impact Analysis
4.1 Market Driving Factors Analysis
4.1.1 Drivers
4.1.2 Restraints
4.1.3 Opportunities
4.1.4 Challenges
4.2 PESTLE Analysis
4.3 Porter’s Five Forces Model
5. Statistical Insights and Trends Reporting
5.1 Adoption Rate
5.2 Technological Advancements
5.3 Fiber Deployment in 5G Networks
6. Competitive Landscape
6.1 List of Major Companies, By Region
6.2 Market Share Analysis, By Region
6.3 Product Benchmarking
6.3.1 Product specifications and features
6.3.2 Pricing
6.4 Strategic Initiatives
6.4.1 Marketing and promotional activities
6.4.2 Distribution and Supply Chain Strategies
6.4.3 Expansion plans and new product launches
6.4.4 Strategic partnerships and collaborations
6.5 Technological Advancements
6.6 Market Positioning and Branding
7. Fiber Optics Market Segmentation, By Type
7.1 Chapter Overview
7.2 Single-mode
7.2.1 Single mode Devices Market Trends Analysis (2020-2032)
7.2.2 Single mode Market Size Estimates and Forecasts to 2032 (USD BILLION)
7.3 Multi-mode
7.3.1 Multi-mode Market Trends Analysis (2020-2032)
7.3.2 Multi-mode Market Size Estimates and Forecasts to 2032 (USD BILLION)
7.4 Plastic Optical Fiber (POF)
7.4.1 Plastic Optical Fiber (POF) Market Trends Analysis (2020-2032)
7.4.2 Plastic Optical Fiber (POF) Market Size Estimates and Forecasts to 2032 (USD BILLION)
8. Fiber Optics Market Segmentation, By Application
8.1 Chapter Overview
8.2 Telecom
8.2.1 Telecom Market Trends Analysis (2020-2032)
8.2.2 Telecom Market Size Estimates and Forecasts to 2032 (USD BILLION)
8.3 Oil & Gas
8.3.1 Oil & Gas Market Trends Analysis (2020-2032)
8.3.2 Oil & Gas Market Size Estimates and Forecasts to 2032 (USD BILLION)
8.4 Military & Aerospace
8.4.1 Military & Aerospace Market Trends Analysis (2020-2032)
8.4.2 Military & Aerospace Market Size Estimates and Forecasts to 2032 (USD BILLION)
8.5 BFSI
8.5.1 BFSI Market Trends Analysis (2020-2032)
8.5.2 BFSI Market Size Estimates and Forecasts to 2032 (USD BILLION)
8.6 Medical
8.6.1 Medical Market Trends Analysis (2020-2032)
8.6.2 Medical Market Size Estimates and Forecasts to 2032 (USD BILLION)
8.7 Railway
8.7.1 Railway Market Trends Analysis (2020-2032)
8.7.2 Railway Market Size Estimates and Forecasts to 2032 (USD BILLION)
8.8 Others
8.8.1 Others Market Trends Analysis (2020-2032)
8.8.2 Others Market Size Estimates and Forecasts to 2032 (USD BILLION)
9. Regional Analysis
9.1 Chapter Overview
9.2 North America
9.2.1 Trends Analysis
9.2.2 North America Fiber Optics Market Estimates and Forecasts, by Country (2020-2032) (USD BILLION)
9.2.3 North America Fiber Optics Market Estimates and Forecasts, By Type (2020-2032) (USD BILLION)
9.2.4 North America Fiber Optics Market Estimates and Forecasts, By Application (2020-2032) (USD BILLION)
9.2.5 USA
9.2.5.1 USA Fiber Optics Market Estimates and Forecasts, By Type (2020-2032) (USD BILLION)
9.2.5.2 USA Fiber Optics Market Estimates and Forecasts, By Application (2020-2032) (USD BILLION)
9.2.6 Canada
9.2.6.1 Canada Fiber Optics Market Estimates and Forecasts, By Type (2020-2032) (USD BILLION)
9.2.6.2 Canada Fiber Optics Market Estimates and Forecasts, By Application (2020-2032) (USD BILLION)
9.2.7 Mexico
9.2.7.1 Mexico Fiber Optics Market Estimates and Forecasts, By Type (2020-2032) (USD BILLION)
9.2.7.2 Mexico Fiber Optics Market Estimates and Forecasts, By Application (2020-2032) (USD BILLION)
9.3 Europe
9.3.1 Eastern Europe
9.3.1.1 Trends Analysis
9.3.1.2 Eastern Europe Fiber Optics Market Estimates and Forecasts, by Country (2020-2032) (USD BILLION)
9.3.1.3 Eastern Europe Fiber Optics Market Estimates and Forecasts, By Type (2020-2032) (USD BILLION)
9.3.1.4 Eastern Europe Fiber Optics Market Estimates and Forecasts, By Application (2020-2032) (USD BILLION)
9.3.1.5 Poland
9.3.1.5.1 Poland Fiber Optics Market Estimates and Forecasts, By Type (2020-2032) (USD BILLION)
9.3.1.5.2 Poland Fiber Optics Market Estimates and Forecasts, By Application (2020-2032) (USD BILLION)
9.3.1.6 Romania
9.3.1.6.1 Romania Fiber Optics Market Estimates and Forecasts, By Type (2020-2032) (USD BILLION)
9.3.1.6.2 Romania Fiber Optics Market Estimates and Forecasts, By Application (2020-2032) (USD BILLION)
9.3.1.7 Hungary
9.3.1.7.1 Hungary Fiber Optics Market Estimates and Forecasts, By Type (2020-2032) (USD BILLION)
9.3.1.7.2 Hungary Fiber Optics Market Estimates and Forecasts, By Application (2020-2032) (USD BILLION)
9.3.1.8 turkey
9.3.1.8.1 Turkey Fiber Optics Market Estimates and Forecasts, By Type (2020-2032) (USD BILLION)
9.3.1.8.2 Turkey Fiber Optics Market Estimates and Forecasts, By Application (2020-2032) (USD BILLION)
9.3.1.9 Rest of Eastern Europe
9.3.1.9.1 Rest of Eastern Europe Fiber Optics Market Estimates and Forecasts, By Type (2020-2032) (USD BILLION)
9.3.1.9.2 Rest of Eastern Europe Fiber Optics Market Estimates and Forecasts, By Application (2020-2032) (USD BILLION)
9.3.2 Western Europe
9.3.2.1 Trends Analysis
9.3.2.2 Western Europe Fiber Optics Market Estimates and Forecasts, by Country (2020-2032) (USD BILLION)
9.3.2.3 Western Europe Fiber Optics Market Estimates and Forecasts, By Type (2020-2032) (USD BILLION)
9.3.2.4 Western Europe Fiber Optics Market Estimates and Forecasts, By Application (2020-2032) (USD BILLION)
9.3.2.5 Germany
9.3.2.5.1 Germany Fiber Optics Market Estimates and Forecasts, By Type (2020-2032) (USD BILLION)
9.3.2.5.2 Germany Fiber Optics Market Estimates and Forecasts, By Application (2020-2032) (USD BILLION)
9.3.2.6 France
9.3.2.6.1 France Fiber Optics Market Estimates and Forecasts, By Type (2020-2032) (USD BILLION)
9.3.2.6.2 France Fiber Optics Market Estimates and Forecasts, By Application (2020-2032) (USD BILLION)
9.3.2.7 UK
9.3.2.7.1 UK Fiber Optics Market Estimates and Forecasts, By Type (2020-2032) (USD BILLION)
9.3.2.7.2 UK Fiber Optics Market Estimates and Forecasts, By Application (2020-2032) (USD BILLION)
9.3.2.8 Italy
9.3.2.8.1 Italy Fiber Optics Market Estimates and Forecasts, By Type (2020-2032) (USD BILLION)
9.3.2.8.2 Italy Fiber Optics Market Estimates and Forecasts, By Application (2020-2032) (USD BILLION)
9.3.2.9 Spain
9.3.2.9.1 Spain Fiber Optics Market Estimates and Forecasts, By Type (2020-2032) (USD BILLION)
9.3.2.9.2 Spain Fiber Optics Market Estimates and Forecasts, By Application (2020-2032) (USD BILLION)
9.3.2.10 Netherlands
9.3.2.10.1 Netherlands Fiber Optics Market Estimates and Forecasts, By Type (2020-2032) (USD BILLION)
9.3.2.10.2 Netherlands Fiber Optics Market Estimates and Forecasts, By Application (2020-2032) (USD BILLION)
9.3.2.11 Switzerland
9.3.2.11.1 Switzerland Fiber Optics Market Estimates and Forecasts, By Type (2020-2032) (USD BILLION)
9.3.2.11.2 Switzerland Fiber Optics Market Estimates and Forecasts, By Application (2020-2032) (USD BILLION)
9.3.2.12 Austria
9.3.2.12.1 Austria Fiber Optics Market Estimates and Forecasts, By Type (2020-2032) (USD BILLION)
9.3.2.12.2 Austria Fiber Optics Market Estimates and Forecasts, By Application (2020-2032) (USD BILLION)
9.3.2.13 Rest of Western Europe
9.3.2.13.1 Rest of Western Europe Fiber Optics Market Estimates and Forecasts, By Type (2020-2032) (USD BILLION)
9.3.2.13.2 Rest of Western Europe Fiber Optics Market Estimates and Forecasts, By Application (2020-2032) (USD BILLION)
9.4 Asia Pacific
9.4.1 Trends Analysis
9.4.2 Asia Pacific Fiber Optics Market Estimates and Forecasts, by Country (2020-2032) (USD BILLION)
9.4.3 Asia Pacific Fiber Optics Market Estimates and Forecasts, By Type (2020-2032) (USD BILLION)
9.4.4 Asia Pacific Fiber Optics Market Estimates and Forecasts, By Application (2020-2032) (USD BILLION)
9.4.5 China
9.4.5.1 China Fiber Optics Market Estimates and Forecasts, By Type (2020-2032) (USD BILLION)
9.4.5.2 China Fiber Optics Market Estimates and Forecasts, By Application (2020-2032) (USD BILLION)
9.4.6 India
9.4.5.1 India Fiber Optics Market Estimates and Forecasts, By Type (2020-2032) (USD BILLION)
9.4.5.2 India Fiber Optics Market Estimates and Forecasts, By Application (2020-2032) (USD BILLION)
9.4.5 Japan
9.4.5.1 Japan Fiber Optics Market Estimates and Forecasts, By Type (2020-2032) (USD BILLION)
9.4.5.2 Japan Fiber Optics Market Estimates and Forecasts, By Application (2020-2032) (USD BILLION)
9.4.6 South Korea
9.4.6.1 South Korea Fiber Optics Market Estimates and Forecasts, By Type (2020-2032) (USD BILLION)
9.4.6.2 South Korea Fiber Optics Market Estimates and Forecasts, By Application (2020-2032) (USD BILLION)
9.4.7 Vietnam
9.4.7.1 Vietnam Fiber Optics Market Estimates and Forecasts, By Type (2020-2032) (USD BILLION)
9.2.7.2 Vietnam Fiber Optics Market Estimates and Forecasts, By Application (2020-2032) (USD BILLION)
9.4.8 Singapore
9.4.8.1 Singapore Fiber Optics Market Estimates and Forecasts, By Type (2020-2032) (USD BILLION)
9.4.8.2 Singapore Fiber Optics Market Estimates and Forecasts, By Application (2020-2032) (USD BILLION)
9.4.9 Australia
9.4.9.1 Australia Fiber Optics Market Estimates and Forecasts, By Type (2020-2032) (USD BILLION)
9.4.9.2 Australia Fiber Optics Market Estimates and Forecasts, By Application (2020-2032) (USD BILLION)
9.4.10 Rest of Asia Pacific
9.4.10.1 Rest of Asia Pacific Fiber Optics Market Estimates and Forecasts, By Type (2020-2032) (USD BILLION)
9.4.10.2 Rest of Asia Pacific Fiber Optics Market Estimates and Forecasts, By Application (2020-2032) (USD BILLION)
9.5 Middle East and Africa
9.5.1 Middle East
9.5.1.1 Trends Analysis
9.5.1.2 Middle East Fiber Optics Market Estimates and Forecasts, by Country (2020-2032) (USD BILLION)
9.5.1.3 Middle East Fiber Optics Market Estimates and Forecasts, By Type (2020-2032) (USD BILLION)
9.5.1.4 Middle East Fiber Optics Market Estimates and Forecasts, By Application (2020-2032) (USD BILLION)
9.5.1.5 UAE
9.5.1.5.1 UAE Fiber Optics Market Estimates and Forecasts, By Type (2020-2032) (USD BILLION)
9.5.1.5.2 UAE Fiber Optics Market Estimates and Forecasts, By Application (2020-2032) (USD BILLION)
9.5.1.6 Egypt
9.5.1.6.1 Egypt Fiber Optics Market Estimates and Forecasts, By Type (2020-2032) (USD BILLION)
9.5.1.6.2 Egypt Fiber Optics Market Estimates and Forecasts, By Application (2020-2032) (USD BILLION)
9.5.1.7 Saudi Arabia
9.5.1.7.1 Saudi Arabia Fiber Optics Market Estimates and Forecasts, By Type (2020-2032) (USD BILLION)
9.5.1.7.2 Saudi Arabia Fiber Optics Market Estimates and Forecasts, By Application (2020-2032) (USD BILLION)
9.5.1.8 Qatar
9.5.1.8.1 Qatar Fiber Optics Market Estimates and Forecasts, By Type (2020-2032) (USD BILLION)
9.5.1.8.2 Qatar Fiber Optics Market Estimates and Forecasts, By Application (2020-2032) (USD BILLION)
9.5.1.9 Rest of Middle East
9.5.1.9.1 Rest of Middle East Fiber Optics Market Estimates and Forecasts, By Type (2020-2032) (USD BILLION)
9.5.1.9.2 Rest of Middle East Fiber Optics Market Estimates and Forecasts, By Application (2020-2032) (USD BILLION)
9.5.2 Africa
9.5.2.1 Trends Analysis
9.5.2.2 Africa Fiber Optics Market Estimates and Forecasts, by Country (2020-2032) (USD BILLION)
9.5.2.3 Africa Fiber Optics Market Estimates and Forecasts, By Type (2020-2032) (USD BILLION)
9.5.2.4 Africa Fiber Optics Market Estimates and Forecasts, By Application (2020-2032) (USD BILLION)
9.5.2.5 South Africa
9.5.2.5.1 South Africa Fiber Optics Market Estimates and Forecasts, By Type (2020-2032) (USD BILLION)
9.5.2.5.2 South Africa Fiber Optics Market Estimates and Forecasts, By Application (2020-2032) (USD BILLION)
9.5.2.6 Nigeria
9.5.2.6.1 Nigeria Fiber Optics Market Estimates and Forecasts, By Type (2020-2032) (USD BILLION)
9.5.2.6.2 Nigeria Fiber Optics Market Estimates and Forecasts, By Application (2020-2032) (USD BILLION)
9.5.2.7 Rest of Africa
9.5.2.7.1 Rest of Africa Fiber Optics Market Estimates and Forecasts, By Type (2020-2032) (USD BILLION)
9.5.2.7.2 Rest of Africa Fiber Optics Market Estimates and Forecasts, By Application (2020-2032) (USD BILLION)
9.6 Latin America
9.6.1 Trends Analysis
9.6.2 Latin America Fiber Optics Market Estimates and Forecasts, by Country (2020-2032) (USD BILLION)
9.6.3 Latin America Fiber Optics Market Estimates and Forecasts, By Type (2020-2032) (USD BILLION)
9.6.4 Latin America Fiber Optics Market Estimates and Forecasts, By Application (2020-2032) (USD BILLION)
9.6.5 Brazil
9.6.5.1 Brazil Fiber Optics Market Estimates and Forecasts, By Type (2020-2032) (USD BILLION)
9.6.5.2 Brazil Fiber Optics Market Estimates and Forecasts, By Application (2020-2032) (USD BILLION)
9.6.6 Argentina
9.6.6.1 Argentina Fiber Optics Market Estimates and Forecasts, By Type (2020-2032) (USD BILLION)
9.6.6.2 Argentina Fiber Optics Market Estimates and Forecasts, By Application (2020-2032) (USD BILLION)
9.6.7 Colombia
9.6.7.1 Colombia Fiber Optics Market Estimates and Forecasts, By Type (2020-2032) (USD BILLION)
9.6.7.2 Colombia Fiber Optics Market Estimates and Forecasts, By Application (2020-2032) (USD BILLION)
9.6.8 Rest of Latin America
9.6.8.1 Rest of Latin America Fiber Optics Market Estimates and Forecasts, By Type (2020-2032) (USD BILLION)
9.6.8.2 Rest of Latin America Fiber Optics Market Estimates and Forecasts, By Application (2020-2032) (USD BILLION)
10. Company Profiles
10.1 Corning Inc.
10.1.1 Company Overview
10.1.2 Financial
10.1.3 Products/ Services Offered
110.1.4 SWOT Analysis
10.2 Cisco Systems, Inc
10.2.1 Company Overview
10.2.2 Financial
10.2.3 Products/ Services Offered
10.2.4 SWOT Analysis
10.3 Prysmian Group
10.3.1 Company Overview
10.3.2 Financial
10.3.3 Products/ Services Offered
10.3.4 SWOT Analysis
10.4 CommScope Holding Company, Inc
10.4.1 Company Overview
10.4.2 Financial
10.4.3 Products/ Services Offered
10.4.4 SWOT Analysis
10.5 Nexans S.A
10.5.1 Company Overview
10.5.2 Financial
10.5.3 Products/ Services Offered
10.5.4 SWOT Analysis
10.6 Sumitomo Electric Industries, Ltd.
10.6.1 Company Overview
10.6.2 Financial
10.6.3 Products/ Services Offered
10.6.4 SWOT Analysis
10.7 Fujikura Ltd.
10.7.1 Company Overview
10.7.2 Financial
10.7.3 Products/ Services Offered
10.7.4 SWOT Analysis
10.8 OFS Fitel, LLC
10.8.1 Company Overview
10.8.2 Financial
10.8.3 Products/ Services Offered
10.8.4 SWOT Analysis
10.9 LS Cable & System Ltd
10.9.1 Company Overview
10.9.2 Financial
10.9.3 Products/ Services Offered
10.9.4 SWOT Analysis
10.10 Hengtong Group
10.9.1 Company Overview
10.9.2 Financial
10.9.3 Products/ Services Offered
10.9.4 SWOT Analysis
11. Use Cases and Best Practices
12. Conclusion
An accurate research report requires proper strategizing as well as implementation. There are multiple factors involved in the completion of good and accurate research report and selecting the best methodology to compete the research is the toughest part. Since the research reports we provide play a crucial role in any company’s decision-making process, therefore we at SNS Insider always believe that we should choose the best method which gives us results closer to reality. This allows us to reach at a stage wherein we can provide our clients best and accurate investment to output ratio.
Each report that we prepare takes a timeframe of 350-400 business hours for production. Starting from the selection of titles through a couple of in-depth brain storming session to the final QC process before uploading our titles on our website we dedicate around 350 working hours. The titles are selected based on their current market cap and the foreseen CAGR and growth.
The 5 steps process:
Step 1: Secondary Research:
Secondary Research or Desk Research is as the name suggests is a research process wherein, we collect data through the readily available information. In this process we use various paid and unpaid databases which our team has access to and gather data through the same. This includes examining of listed companies’ annual reports, Journals, SEC filling etc. Apart from this our team has access to various associations across the globe across different industries. Lastly, we have exchange relationships with various university as well as individual libraries.
Step 2: Primary Research
When we talk about primary research, it is a type of study in which the researchers collect relevant data samples directly, rather than relying on previously collected data. This type of research is focused on gaining content specific facts that can be sued to solve specific problems. Since the collected data is fresh and first hand therefore it makes the study more accurate and genuine.
We at SNS Insider have divided Primary Research into 2 parts.
Part 1 wherein we interview the KOLs of major players as well as the upcoming ones across various geographic regions. This allows us to have their view over the market scenario and acts as an important tool to come closer to the accurate market numbers. As many as 45 paid and unpaid primary interviews are taken from both the demand and supply side of the industry to make sure we land at an accurate judgement and analysis of the market.
This step involves the triangulation of data wherein our team analyses the interview transcripts, online survey responses and observation of on filed participants. The below mentioned chart should give a better understanding of the part 1 of the primary interview.
Part 2: In this part of primary research the data collected via secondary research and the part 1 of the primary research is validated with the interviews from individual consultants and subject matter experts.
Consultants are those set of people who have at least 12 years of experience and expertise within the industry whereas Subject Matter Experts are those with at least 15 years of experience behind their back within the same space. The data with the help of two main processes i.e., FGDs (Focused Group Discussions) and IDs (Individual Discussions). This gives us a 3rd party nonbiased primary view of the market scenario making it a more dependable one while collation of the data pointers.
Step 3: Data Bank Validation
Once all the information is collected via primary and secondary sources, we run that information for data validation. At our intelligence centre our research heads track a lot of information related to the market which includes the quarterly reports, the daily stock prices, and other relevant information. Our data bank server gets updated every fortnight and that is how the information which we collected using our primary and secondary information is revalidated in real time.
Step 4: QA/QC Process
After all the data collection and validation our team does a final level of quality check and quality assurance to get rid of any unwanted or undesired mistakes. This might include but not limited to getting rid of the any typos, duplication of numbers or missing of any important information. The people involved in this process include technical content writers, research heads and graphics people. Once this process is completed the title gets uploader on our platform for our clients to read it.
Step 5: Final QC/QA Process:
This is the last process and comes when the client has ordered the study. In this process a final QA/QC is done before the study is emailed to the client. Since we believe in giving our clients a good experience of our research studies, therefore, to make sure that we do not lack at our end in any way humanly possible we do a final round of quality check and then dispatch the study to the client.
Key Segments:
By Type
Single mode
Multi-mode
Plastic Optical Fiber (POF)
By Application
Telecom
Oil & Gas
Military & Aerospace
BFSI
Medical
Railway
Others
Request for Segment Customization as per your Business Requirement: Segment Customization Request
Regional Coverage:
North America
US
Canada
Mexico
Europe
Eastern Europe
Poland
Romania
Hungary
Turkey
Rest of Eastern Europe
Western Europe
Germany
France
UK
Italy
Spain
Netherlands
Switzerland
Austria
Rest of Western Europe
Asia Pacific
China
India
Japan
South Korea
Vietnam
Singapore
Australia
Rest of Asia Pacific
Middle East & Africa
Middle East
UAE
Egypt
Saudi Arabia
Qatar
Rest of Middle East
Africa
Nigeria
South Africa
Rest of Africa
Latin America
Brazil
Argentina
Colombia
Rest of Latin America
Request for Country Level Research Report: Country Level Customization Request
Available Customization
With the given market data, SNS Insider offers customization as per the company’s specific needs. The following customization options are available for the report:
Detailed Volume Analysis
Criss-Cross segment analysis (e.g. Product X Application)
Competitive Product Benchmarking
Geographic Analysis
Additional countries in any of the regions
Customized Data Representation
Detailed analysis and profiling of additional market players
The Microcontroller Market Size was valued at USD 29.11 Billion in 2023 and is expected to reach USD 69.33 Billion by 2032 and grow at a CAGR of 10.1% over the forecast period 2024-2032.
The Silicon Photomultiplier Market size is expected to be valued at USD 138.09 Million in 2023. It is estimated to reach USD 274.43 Million by 2032, growing at a CAGR of 7.93% during 2024-2032.
IR Spectroscopy Market Size was valued at USD 0.43 billion in 2023 and is expected to reach USD 0.904 billion at 8.6% CAGR by forecast period 2024-2032
The Total Station Market was valued at USD 1.87 billion in 2023 and is expected to reach USD 3.13 billion by 2032, growing at a CAGR of 5.94% over the forecast period 2024-2032.
The Commercial Printing Market Size was valued at USD 524.92 Billion in 2023 and is expected to grow at 2.59% CAGR to reach USD 659.39 Billion by 2032
Data Center Interconnect Market Size was valued at USD 11.45 billion in 2023 and is expected to reach USD 37.53 billion by 2032 and grow at a CAGR of 14.1% over the forecast period 2024-2032.
Hi! Click one of our member below to chat on Phone