Fiber Optics Collimating Lens Market Size
Get more information on Fiber Optics Collimating Lens Market - Request Sample Report
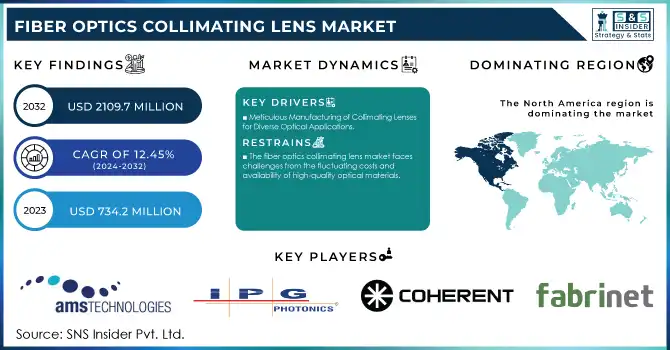
The Fiber Optics Collimating Lens Market Size was valued at USD 734.2 million in 2023 and expected to reach USD 2109.7 Million by 2032, and grow at a CAGR of 12.45% over the forecast period 2024-2032.
The Fiber Optics Collimating Lens Market is experiencing significant growth due to the rising demand for high-speed data transmission driven by 5G network expansion, advancements in telecommunications infrastructure, and increasing reliance on fiber optic systems. Collimating lenses are critical for enhancing signal transmission by focusing light into parallel beams, improving the performance of fiber optic networks across key industries such as telecommunications, medical imaging, and industrial automation. Innovations like near-infrared diffuse correlation spectroscopy/tomography (DCS/DCT) highlight their importance in medical applications, with collimating micro-lens fiber arrays enabling noninvasive imaging and precise signal collection.
In telecommunications, advancements such as the Large-Beam Fiber Coupler (LBFC) with Double-combined Collimating Lenses (DCL) have achieved coupling efficiencies up to 95.16%, emphasizing their role in minimizing signal loss and optimizing data flow. These lenses also address challenges like radial, axial, and angular mismatches in optical systems, ensuring superior performance in diverse applications. As industries increasingly adopt advanced fiber optic technologies, supported by improved materials and manufacturing processes, the demand for collimating lenses is set to grow, solidifying their role as a cornerstone in high-performance data transmission and optical sensing systems worldwide.
Fiber Optics Collimating Lens Market Dynamics
Drivers
-
Meticulous Manufacturing of Collimating Lenses for Diverse Optical Applications
The production of collimating lenses is a highly precise process designed to meet the diverse needs of applications such as laser collimators, beam expanders, and optical communication systems. It encompasses key stages like lens fabrication, material inspection, coating application, assembly, and rigorous testing. The specific application dictates critical factors, including material selection, coating design, and testing methodologies. Materials are chosen based on their refractive index, transmission range, and resistance to environmental conditions. Precision grinding and polishing techniques shape the lenses, with aspheric lenses requiring advanced computer-controlled machinery to achieve the precise surface profiles necessary to minimize optical aberrations. Companies like Chineselens Optics set industry standards by providing both standard and custom collimating lenses. Standard lenses, ideal for quick-turnaround projects, come in various diameters, focal lengths, coatings, and mounting sizes. Coating options cover a wide range of wavelengths, including 405 nm, 543 nm, 633 nm, 780 nm, 1064 nm, 1310 nm, 1550 nm, and 2000 nm, ensuring optimal performance for diverse applications.
Restraints
-
The fiber optics collimating lens market faces challenges from the fluctuating costs and availability of high-quality optical materials.
These materials are critical for producing lenses with high transmission efficiency, minimal aberrations, and robust environmental resistance, which are essential for applications in telecommunications, medical imaging, and industrial automation. However, the reliance on rare or specialized materials introduces cost volatility, driven by factors such as resource scarcity, geopolitical tensions, and fluctuating global demand. Supply chain disruptions, further exacerbated by the COVID-19 pandemic and economic uncertainties, complicate the procurement of these essential materials. For example, advanced coatings tailored for specific wavelengths, such as 405 nm, 633 nm, and 1550 nm, are indispensable for achieving optimal optical performance, yet their supply often experiences delays and price hikes. Custom solutions like polycapillary optics and precision collimators add complexity to material requirements, increasing dependency on stable and timely supplies. This instability impacts production timelines, increases costs, and creates challenges in meeting customer demands.
Additionally, the intense competition for resources due to growing global demand for fiber optic solutions intensifies supply chain pressures, forcing manufacturers to adopt innovative strategies. To mitigate these challenges, companies are exploring alternative materials, diversifying supplier networks, and investing in localized production capabilities to reduce reliance on vulnerable supply chains. However, these measures often entail significant upfront costs, posing further hurdles for smaller manufacturers. As the demand for fiber optics technology accelerates, especially with advancements in 5G, IoT, and medical diagnostics, addressing material availability and cost volatility remains a critical priority for the collimating lens market. Ensuring consistent access to high-quality materials and stabilizing costs will be essential to sustaining growth and innovation in this dynamic industry.
Fiber Optics Collimating Lens Market Segment Analysis
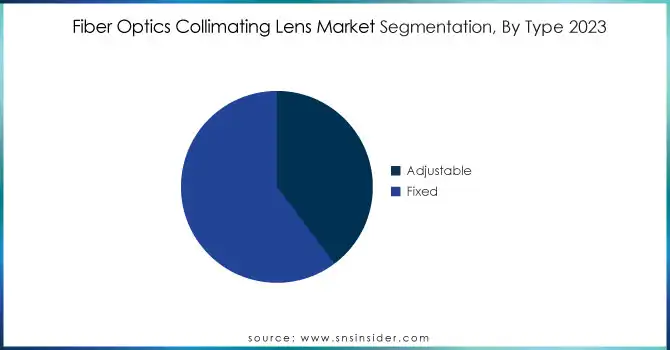
By Type
The Fixed segment dominates the Fiber Optics Collimating Lens Market, accounting for approximately 61% of the market share in 2023. This dominance is primarily due to the widespread use of fixed collimating lenses in applications that require stable, precise alignment over long periods, such as in telecommunications, fiber optic communication systems, and laser collimators. Fixed collimating lenses offer consistent performance, minimal aberrations, and ease of integration into various systems, making them a preferred choice for industries that rely on high-precision optical components. Their robust design and ability to maintain consistent collimation over time further drive their demand. As the need for efficient and reliable optical communication continues to grow, the fixed segment is expected to maintain its leading position in the market.
By Lens Type
The Fiber Lenses segment holds a dominant share of approximately 71% in the Fiber Optics Collimating Lens Market in 2023. This segment's leading position can be attributed to the increasing adoption of fiber optic technology in telecommunications, data centers, and medical applications. Fiber lenses are preferred for their ability to provide precise collimation in compact, efficient systems, making them essential for high-speed data transmission, optical sensing, and laser applications. Their integration with fiber optic cables allows for better control of light propagation, ensuring minimal loss and enhanced signal integrity. As the demand for faster, more reliable communication systems grows, particularly with the rollout of 5G and advanced optical sensing technologies, the fiber lenses segment is expected to maintain its dominant market position, driven by their superior performance and versatility.
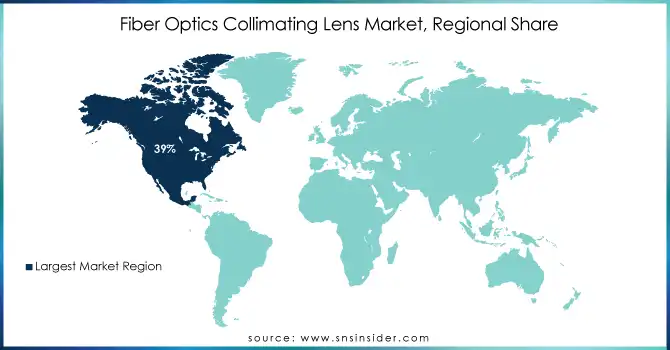
Fiber Optics Collimating Lens Market Regional Overview
North America holds the largest revenue share of around 39% in the as of 2023, driven by its advanced technological infrastructure, significant investments in telecommunications, and a high demand for fiber-optic solutions in industries like healthcare, automotive, and aerospace. The region is home to several key players in the market, fostering innovation and driving the adoption of collimating lenses for applications such as optical communication, laser collimators, and beam expanders. Additionally, North America benefits from a strong presence of research and development activities and government initiatives supporting the growth of fiber optic technologies. With its growing data centers and expanding 5G network infrastructure, North America is expected to maintain its dominance in the fiber optics collimating lens market during the forecast period.
Asia-Pacific is expected to be the fastest-growing region in the Fiber Optics Collimating Lens Market during the forecast period from 2024 to 2032. This growth is primarily driven by the rapid expansion of telecommunications infrastructure, the rise in data consumption, and increasing investments in advanced technologies such as 5G, fiber optics, and optical sensing. Countries like China, Japan, South Korea, and India are at the forefront, with significant demand for high-performance collimating lenses across industries such as telecommunications, healthcare, automotive, and aerospace. The region’s strong manufacturing base, coupled with a growing number of research and development activities, also contributes to the market's expansion. Additionally, the rising adoption of smart devices, autonomous vehicles, and medical imaging solutions further supports the demand for fiber optics collimating lenses in the Asia-Pacific market. With these factors combined, Asia-Pacific is poised for substantial market growth in the coming years.
Get Customized Report as per your Business Requirement - Request For Customized Report
KEY PLAYERS:
Some of the major players in Fiber Optics Collimating Lens Market with their product:
-
AMS Technologies AG (Fiber optic collimating lenses and optical components)
-
IPG Photonics Corporation (Fiber optic collimators and high-power laser components)
-
Coherent (Optical lenses, collimators, and fiber optic components for laser systems)
-
Fabrinet (Precision fiber optic components and collimating lenses for telecom and industrial applications)
-
Thorlabs Inc. (Fiber optic components, including collimating lenses for scientific and industrial applications)
-
Daheng New Epoch Technology, Inc. (CDHC) (Optical components, including fiber optic collimating lenses for imaging and telecommunications)
-
Edmund Optics (Custom optical systems and fiber optic collimating lenses for research and development)
-
FS.Com (Fiber optic components, including collimating lenses for high-performance optical systems)
-
Gooch & Housego (Precision fiber optic collimating lenses for industrial, medical, and defense applications)
-
TRIOPTICS (Fiber optic lenses, collimating lenses, and optical systems for metrology and testing)
-
SCANLAB GmbH (Beam deflection systems and fiber optic collimating lenses for laser applications)
-
Rochester Precision Optics (Optical systems, including fiber optic collimating lenses for telecommunications)
-
LightPath Technologies (Optical lenses and custom collimating lenses for telecom and industrial applications)
-
CeramOptec (Fiber optic collimating lenses and optical components for medical and industrial uses)
-
Fiberguide Industries, Inc. (Fiber optic components, including collimating lenses for laser systems and telecommunications)
-
OZ Optics, Ltd. (Custom fiber optic collimating lenses and optical components for telecommunication applications)
-
Avantes (Fiber optic components, including collimating lenses for spectroscopy and sensing applications)
-
Laser Mechanisms (Fiber optic collimating lenses and laser-based components for material processing)
-
Schott AG (Precision optical components, including fiber optic collimating lenses for industrial and telecommunications applications)
-
II-VI Incorporated (Optical lenses, collimators, and fiber optic components for telecommunications, aerospace, and defense)
List of suppliers that provide raw materials and components for the Fiber Optics Collimating Lens Market:
-
Corning Incorporated
-
Momentive Performance Materials
-
Schott AG
-
Hoya Corporation
-
Shenzhen JY Optoelectronics
-
Swarovski Optik
-
JDS Uniphase (Lumentum)
-
OptoTech
-
Lumentum Operations LLC
-
Thorlabs Inc.
-
Optical Cable Corporation (OCC)
-
2M Technologies
-
II-VI Incorporated
-
YOKOGAWA Electric Corporation
-
Fujikura Ltd.
-
Sumitomo Electric Industries, Ltd.
-
U.S. Sensor
-
Laserline GmbH
-
Furukawa Electric Co., Ltd.
-
Teledyne Optech
Recent Development
-
May, 2024 – IPG Photonics launches an automated cobot laser welding and cleaning system, expanding its LightWELD family. The system provides turnkey solutions for fabricators, enabling easy setup and efficient production with minimal training, improving productivity and reducing operating costs.
-
October, 2024 – Coherent's UV lasers enhance semiconductor wafer inspection, enabling the detection of minute defects, crucial for improving yields and reducing manufacturing costs.
| Report Attributes | Details |
| Market Size in 2023 | USD 734.2 Million |
| Market Size by 2032 | USD 2109.7 Million |
| CAGR | CAGR of 12.45% From 2024 to 2032 |
| Base Year | 2023 |
| Forecast Period | 2024-2032 |
| Historical Data | 2020-2022 |
| Report Scope & Coverage | Market Size, Segments Analysis, Competitive Landscape, Regional Analysis, DROC & SWOT Analysis, Forecast Outlook |
| Key Segments | • By Type (Adjustable, Fixed) • By Lens Type (Fiber Lenses, GRIN Lenses) • By Mode (Multimode, Single Mode) • By Wavelength (<1000>2000 NM) • By Application (Metrology, Medical Diagnostic & Imaging, Communication, Lasers and Detectors, Spectroscopy and Microscopy, Others) |
| Regional Analysis/Coverage | North America (US, Canada, Mexico), Europe (Eastern Europe [Poland, Romania, Hungary, Turkey, Rest of Eastern Europe] Western Europe] Germany, France, UK, Italy, Spain, Netherlands, Switzerland, Austria, Rest of Western Europe]), Asia Pacific (China, India, Japan, South Korea, Vietnam, Singapore, Australia, Rest of Asia Pacific), Middle East & Africa (Middle East [UAE, Egypt, Saudi Arabia, Qatar, Rest of Middle East], Africa [Nigeria, South Africa, Rest of Africa], Latin America (Brazil, Argentina, Colombia, Rest of Latin America) |
| Company Profiles | AMS Technologies AG, IPG Photonics Corporation, Coherent, Fabrinet, Thorlabs Inc., Daheng New Epoch Technology, Inc. (CDHC), Edmund Optics, FS.Com, Gooch & Housego, TRIOPTICS, SCANLAB GmbH, Rochester Precision Optics, LightPath Technologies, CeramOptec, Fiberguide Industries, Inc., OZ Optics, Ltd., Avantes, Laser Mechanisms, Schott AG, and II-VI Incorporated. |
| Key Drivers | • Meticulous Manufacturing of Collimating Lenses for Diverse Optical Applications |
| Restraints | • The fiber optics collimating lens market faces challenges from the fluctuating costs and availability of high-quality optical materials. |
