Get more information on Fiber Optical Cable Market - Request Free Sample Report
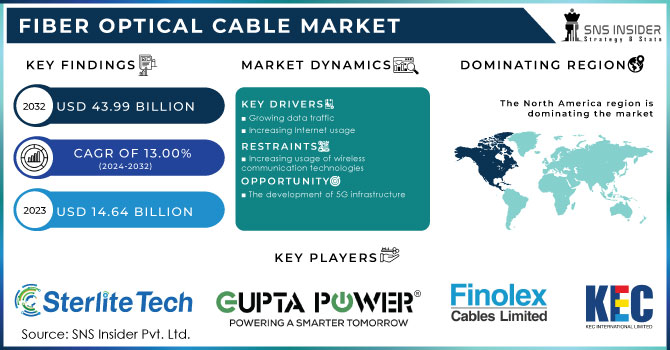
The Fiber Optical Cable Market size was valued at USD 14.64 billion in 2023. It is expected to reach USD 43.99 billion by 2032 and grow at a CAGR of 13.00% over the forecast period 2024-2032.
A cable that carries data using fibers or plastic rather than metal is referred to as an optical fiber cable. This cable is made of a collection of glass threads that transmit modified signals using light rays. Additionally, it offers some advantages over other communication cable types, including high bandwidth, decreased sensitivity to interference, reduced thickness, less weight, and the capacity to transport data digitally, all of which are contributing to the market's revenue growth. Fibre optic connections are important for Local Area Networks (LAN). These cables are being used by telecommunications companies to replace telephone lines. Additionally, since fiber optics transmit messages by light, there are no means for the data to be retrieved, which is a huge worry for the communications industry.
Another driver boosting market revenue growth is the rising demand for fiber optic cable, which is used in telecommunications services including internet, television, and telephones. For long-distance and high-performance data networking, fiber optics are used. For instance, Google Fibre and Verizon FIOS, the two companies' respective solutions, both use fiber optics to provide users with gigabit internet speeds.
KEY DRIVERS:
Growing data traffic
Increasing Internet usage
The number of internet users has been increasing exponentially over the world. Social media services, online entertainment, Voice over IP (VoIP), and mobile payments have all grown widespread thanks to the rise in internet usage. Consequently, traffic related to With the widespread use of tablets, laptops, smartphones, and other wireless devices, data services, video streaming, online gaming, and the internet have all experienced significant growth.
To get to its destination, wireless traffic uses a fiber optic wireline network. As a result, landline networks like front haul and back haul are largely responsible for the rise of mobile communications. The increased use of multimedia results in significant data production and repetition on a global scale. The installation of new fiber optic connections will rise due to the increase in data generated.
RESTRAIN:
Increasing usage of wireless communication technologies
One of the main inhibitors for fiber optics manufacturers is the growing usage of wireless communication solutions in place of cable ones. In wireless communications systems, a microwave radio spectrum is used to send data from one place to another. The dishes, antenna systems, and receivers all receive the data from a single central point. Radiofrequency (RF) and fiber space optics (FSO) are the two main technologies for wireless communication. Because they don't interfere with one another, RF and FSO technologies are less expensive to implement. In comparison to fiber optics technology, these technologies boost communication application efficiency. Furthermore, wireless communication systems are becoming more popular than fiber.
OPPORTUNITY:
The development of 5G infrastructure
The widespread adoption of 5G in developed and developing economies would present advantageous business possibilities for vendors of fiber optics. The deployment of optical fibers is crucial to the development of 5G infrastructure.
These optical fibers are capable of transmitting a significant amount of data quickly between two locations. Telecom service providers are placing a strong emphasis on installing more recent 5G base stations to acquire a competitive edge in the market as 5G services continue to be commercialized. As of March 2022, the telecom service providers in China had deployed around 1.425 million 5G base stations across the nation, according to the Ministry of Industry and Information Technology (MIIT) of China. These base stations are network-capable.
CHALLENGES:
expensive installation costs.
Installing fiber optic networks in rough terrain presents difficulties
Fiber optic cables are normally put into conduits beside the pipeline, trenchless solutions present substantial obstacles to installing the conduits.
Technical and administrative issues might be the cause of challenges in fiber use. With subsea fiber optic cable networks, many telecom corporations have telecommunications infrastructure throughout the world. the cable company Verizon By the end of 2021, the US had established a fiber optic network called Fibre Optic Service (FiOS), which had 480,99 sales locations. The corporation expects to reach 18.1 million homes and 8.1 million internet subscribers by the end of 2025 and has plans to install another 550,000 FiOS locations by 2022.
IMPACT ANALYSIS
In the first half of 2020, the COVID-19 pandemic significantly affected the supply chain for raw materials and components. The pandemic also forced the forced closing of fiber optics manufacturing facilities, which to some part slowed the market's expansion. However, some market participants were able to run their manufacturing plants during COVID-19 with a limited capacity. For instance, Sterlite Technologies Limited (India) resumed production in April 2020. Operations during the epidemic at 65% of their full worldwide capability. The corporation started operating its factories again in China, India, and Italy.
IMPACT OF RUSSIAN UKRAINE WAR
The struggle for control of Ukraine's internet demonstrates how both sides see access to the internet as a vital weapon in a 21st-century conflict. A crucial part of the war effort has been the constant flow of images and video from Ukraine, which has given the entire world a front-row view of the invasion. Because of Russia's actions to block access to mobile and Internet networks, the occupied Ukrainians were left in an information vacuum, which Russia filled with its propaganda. Throughout the conflict, a large portion of the proof of the crimes committed by Russian troops in the captured territories has only recently come to light. Russia has made numerous efforts to regulate the flow of information. Ukrainian telecom operators' more than 4,000 base stations have been Since the start of the invasion, Russian troops have taken over or destroyed more than 60,000 kilometers of fiber-optic Internet links, according to Ukraine's Special Communications Service. Additionally, 18 television and radio transmission antennas were damaged by Russian soldiers.
IMPACT OF ONGOING RECESSION
The market's growth prospects are also anticipated to be accelerated by the rising preference in the telecommunications industry and data centers. The utilization of fiber optic cables allows for high-speed, long-distance communication. The demand for greater connectivity in the home and commercial sectors will provide the fiber optic cable market with a wide range of possible opportunities. the use of fiber optic cable to support the transmission of a significant amount of digital content, hence driving the rising demand for digital content. As a result, the market will probably be fueled by the growing use of fiber cable in the industry of digital content.
Recessions have a substantial influence on the fiber optic cable business and can spread to other areas of the economy. As businesses and individuals reduce their spending during economic downturns, the demand for fiber optic cable installations tends to decline. Due to the decreased profits and revenues experienced by fiber optic cable producers, there are more layoffs, budget cuts, and postponed expenditures in R&D. As more businesses look for low-cost solutions to boost operational efficiency or provide remote work options, there are prospects for growth during recessions. To be competitive in challenging times, fiber optic enterprises must immediately adapt by evaluating their present business models, looking out for new markets, and investing in cutting-edge technologies.
By Fibre Type
Glass
Plastic
By cable type
Single-mode
Multi-mode
By development
Underground
Underwater
Aerial
By Application
Communication
Telecom
Premises
Utility
CATV
Military
Industrial
Others
Non-communication
Sensors
Fiber Optic Lighting
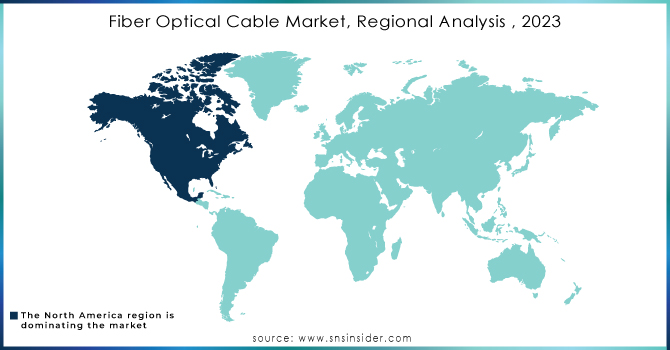
Fiber Optics Market Boom in North America, Fueling Demand and Growth Due to the rising need for high-speed internet and data transmission.
North America has one of the largest fiber optics markets in the world. With numerous telecommunications and technology businesses investing in fiber optic networks, the United States is the world's largest consumer of fiber optic technology. The region's economy is also progressing due to the growing usage of fiber optics in a variety of end-user sectors, including healthcare, defense, and other industries. The development of smart cities and the growing use of loT technology will increase demand for fiber optics in North America. The business is also expanding as a result of government programs to upgrade the telecommunications infrastructure and increased demand for data center computing.
Need any customization research on Fiber Optical Cable Market - Enquiry Now
REGIONAL COVERAGE:
North America
USA
Canada
Mexico
Europe
Germany
UK
France
Italy
Spain
The Netherlands
Rest of Europe
Asia-Pacific
Japan
South Korea
China
India
Australia
Rest of Asia-Pacific
The Middle East & Africa
Israel
UAE
South Africa
Rest of the Middle East & Africa
Latin America
Brazil
Argentina
Rest of Latin American
The major players are Gupta Power Infrastructure Limited, Sterlite Technologies Limited, Birla Cable Ltd. (Mp Birla Group), Finolex Cables Limited, Kec International Ltd. (Rpg Enterprises), Apar Industries Ltd., Aksh Optifibre, Polycab India Limited, Vindhya Telelinks Ltd. (Mp Birla Group), Universal Cables Ltd. (Mp Birla Group) and other players listed in the final report.
Corning Incorporated (US) announced in May 2022 the addition of MiniXtend HD cables for 12 to 72 fibers and MiniXtend XD cables for 192 and 288 fibers to its MiniXtend cable range. High density, duct space efficiency, and a smaller carbon footprint are all features of the new MiniXtend HD and MiniXtend XD cables.
New ITU-T G.654.E terrestrial ultra-low-loss optical fibers and cables were introduced in November 2021 by Sumitomo Electric Industries, Ltd. (Japan) through its PureAdvance line. Ultra-low-loss optical fibers and cables, which are the new goods, are appropriate for broadband applications.
Prysmian Group (Italy) extended its collaboration agreement with Openreach for an additional three years in October 2021. To support Openreach's revised Full Fibre broadband construction plan, Prysmian Group will contribute innovation and expertise.
Report Attributes | Details |
Market Size in 2023 | US$ 14.64 Bn |
Market Size by 2032 | US$ 43.99 Bn |
CAGR | CAGR of 13.00% From 2024 to 2032 |
Base Year | 2023 |
Forecast Period | 2024-2032 |
Historical Data | 2020-2022 |
Report Scope & Coverage | Market Size, Segments Analysis, Competitive Landscape, Regional Analysis, DROC & SWOT Analysis, Forecast Outlook |
Key Segments | • By Fibre Type (Glass, Plastic) • By cable type (Single-mode, Multi-mode) • By development (Underground, Underwater, Aerial) • By Application (Communication, Non-Communication) |
Regional Analysis/Coverage | North America (USA, Canada, Mexico), Europe (Germany, UK, France, Italy, Spain, Netherlands, Rest of Europe), Asia-Pacific (Japan, South Korea, China, India, Australia, Rest of Asia-Pacific), The Middle East & Africa (Israel, UAE, South Africa, Rest of Middle East & Africa), Latin America (Brazil, Argentina, Rest of Latin America) |
Company Profiles | Gupta Power Infrastructure Limited, Sterlite Technologies Limited, Birla Cable Ltd. (Mp Birla Group), Finolex Cables Limited, Kec International Ltd. (Rpg Enterprises), Apar Industries Ltd., Aksh Optifibre, Polycab India Limited, Vindhya Telelinks Ltd. (Mp Birla Group), Universal Cables Ltd. (Mp Birla Group) |
Key Drivers | • Growing data traffic • Increasing Internet usage |
Market Opportunities | • The development of 5G infrastructure |
Ans: The market for Fiber Optical Cable Market is anticipated to expand by 8.38 % from 2024 to 2031.
Ans: 22.56 billion is expected to grow by 2031.
Ans: Gupta Power Infrastructure Limited, Sterlite Technologies Limited, Birla Cable Ltd. (Mp Birla Group), Finolex Cables Limited, Kec International Ltd. (Rpg Enterprises), Apar Industries Ltd., Aksh Optifibre, Polycab India Limited, Vindhya Telelinks Ltd. (Mp Birla Group), Universal Cables Ltd. (Mp Birla Group), etc.
Ans: The Fiber Optical Cable Market size was valued at USD 11.85 billion in 2023.
Ans: North America is dominating the Market
Table of Contents
1. Introduction
1.1 Market Definition
1.2 Scope
1.3 Research Assumptions
2. Research Methodology
3. Market Dynamics
3.1 Drivers
3.2 Restraints
3.3 Opportunities
3.4 Challenges
4. Impact Analysis
4.1 COVID-19 Impact Analysis
4.2 Impact of Ukraine- Russia War
4.3 Impact of Ongoing Recession
4.3.1 Introduction
4.3.2 Impact on major economies
4.3.2.1 US
4.3.2.2 Canada
4.3.2.3 Germany
4.3.2.4 France
4.3.2.5 United Kingdom
4.3.2.6 China
4.3.2.7 Japan
4.3.2.8 South Korea
4.3.2.9 Rest of the World
5. Value Chain Analysis
6. Porter’s 5 forces model
7. PEST Analysis
8. Fiber Optical Cable Market Segmentation, By Fibre Type
8.1 Glass
8.2 Plastic
9. Fiber Optical Cable Market Segmentation, By cable type
9.1 Single-mode
9.2 Multi-mode
10. Fiber Optical Cable Market Segmentation, By Development
10.1 Underground
10.2 Underwater
10.3 Aerial
11. Fiber Optical Cable Market Segmentation, By Application
11.1 Communication
11.1.1 Telecom
11.1.2 Premises
11.1.3 Utility
11.1.4 CATV
11.1.5 Military
11.1.6 Industrial
11.1.7 Others
11.2 Non-communication
11.2.1 Sensors
11.2.2 Fiber Optic Lighting
12. Regional Analysis
12.1 Introduction
12.2 North America
12.2.1 North America Fiber Optical Cable Market by Country
12.2.2North America Fiber Optical Cable Market by Fibre Type
12.2.3 North America Fiber Optical Cable Market by Cable Type
12.2.4 North America Fiber Optical Cable Market by Development
12.2.5 North America Fiber Optical Cable Market by Application
12.2.6 USA
12.2.6.1 USA Fiber Optical Cable Market by Fibre Type
12.2.6.2 USA Fiber Optical Cable Market by Cable Type
12.2.6.3 USA Fiber Optical Cable Market by Development
12.2.6.4 USA Fiber Optical Cable Market by Application
12.2.7 Canada
12.2.7.1 Canada Fiber Optical Cable Market by Fibre Type
12.2.7.2 Canada Fiber Optical Cable Market by Cable Type
12.2.7.3 Canada Fiber Optical Cable Market by Development
12.2.7.4 Canada Fiber Optical Cable Market by Application
12.2.8 Mexico
12.2.8.1 Mexico Fiber Optical Cable Market by Fibre Type
12.2.8.2 Mexico Fiber Optical Cable Market by Cable Type
12.2.8.3 Mexico Fiber Optical Cable Market by Development
12.2.8.4 Mexico Fiber Optical Cable Market by Application
12.3 Europe
12.3.1 Europe Fiber Optical Cable Market by country
12.3.2 Europe Fiber Optical Cable Market by Fibre Type
12.3.3 Europe Fiber Optical Cable Market by Cable Type
12.3.4 Europe Fiber Optical Cable Market by Development
12.3.5 Europe Fiber Optical Cable Market by Application
12.3.6 Germany
12.3.6.1 Germany Fiber Optical Cable Market by Fibre Type
12.3.6.2 Germany Fiber Optical Cable Market by Cable Type
12.3.6.3 Germany Fiber Optical Cable Market by Development
12.3.6.4 Germany Fiber Optical Cable Market by Application
12.3.7 UK
12.3.7.1 UK Fiber Optical Cable Market by Fibre Type
12.3.7.2 UK Fiber Optical Cable Market by Cable Type
12.3.7.3 UK Fiber Optical Cable Market by Development
12.3.7.4 UK Fiber Optical Cable Market by Application
12.3.8 France
12.3.8.1 France Fiber Optical Cable Market by Fibre Type
12.3.8.2 France Fiber Optical Cable Market by Cable Type
12.3.8.3 France Fiber Optical Cable Market by Development
12.3.8.4 France Fiber Optical Cable Market by Application
12.3.9 Italy
12.3.9.1 Italy Fiber Optical Cable Market by Fibre Type
12.3.9.2 Italy Fiber Optical Cable Market by Cable Type
12.3.9.3 Italy Fiber Optical Cable Market by Development
12.3.9.4 Italy Fiber Optical Cable Market by Application
12.3.10 Spain
12.3.10.1 Spain Fiber Optical Cable Market by Fibre Type
12.3.10.2 Spain Fiber Optical Cable Market by Cable Type
12.3.10.3 Spain Fiber Optical Cable Market by Development
12.3.10.4 Spain Fiber Optical Cable Market by Application
12.3.11 The Netherlands
12.3.11.1 Netherlands Fiber Optical Cable Market by Fibre Type
12.3.11.2 Netherlands Fiber Optical Cable Market by Cable Type
12.3.11.3 Netherlands Fiber Optical Cable Market by Development
12.3.11.4 Netherlands Fiber Optical Cable Market by Application
12.3.12 Rest of Europe
12.3.12.1 Rest of Europe Fiber Optical Cable Market by Fibre Type
12.3.12.2 Rest of Europe Fiber Optical Cable Market by Cable Type
12.3.12.3 Rest of Europe Fiber Optical Cable Market by Development
12.3.12.4 Rest of Europe Fiber Optical Cable Market by Application
12.4 Asia-Pacific
12.4.1 Asia Pacific Fiber Optical Cable Market by country
12.4.2 Asia Pacific Fiber Optical Cable Market by Fibre Type
12.4.3 Asia Pacific Fiber Optical Cable Market by Cable Type
12.4.4 Asia Pacific Fiber Optical Cable Market by Development
12.4.5 Asia Pacific Fiber Optical Cable Market by Application
12.4.6 Japan
12.4.6.1 Japan Fiber Optical Cable Market by Fibre Type
12.4.6.2 Japan Fiber Optical Cable Market by Cable Type
12.4.6.3 Japan Fiber Optical Cable Market by Development
12.4.6.4 Japan Fiber Optical Cable Market by Application
12.4.7 South Korea
12.4.7.1 South Korea Fiber Optical Cable Market by Fibre Type
12.4.7.2 South Korea Fiber Optical Cable Market by Cable Type
12.4.7.3 South Korea Fiber Optical Cable Market by Development
12.4.7.4 South Korea Fiber Optical Cable Market by Application
12.4.8 China
12.4.8.1 China Fiber Optical Cable Market by Fibre Type
12.4.8.2 China Fiber Optical Cable Market by Cable Type
12.4.8.3 China Fiber Optical Cable Market by Development
12.4.8.4 China Fiber Optical Cable Market by Application
12.4.9 India
12.4.9.1 India Fiber Optical Cable Market by Fibre Type
12.4.9.2 India Fiber Optical Cable Market by Cable Type
12.4.9.3 India Fiber Optical Cable Market by Development
12.4.9.4 India Fiber Optical Cable Market by Application
12.4.11 Australia
12.4.10.1 Australia Fiber Optical Cable Market by Fibre Type
12.4.10.2 Australia Fiber Optical Cable Market by Cable Type
12.4.10.3 Australia Fiber Optical Cable Market by Development
12.4.10.4 Australia Fiber Optical Cable Market by Application
12.4.11 Rest of Asia-Pacific
12.4.11.1 APAC Fiber Optical Cable Market by Fibre Type
12.4.11.2 APAC Fiber Optical Cable Market by Cable Type
12.4.11.3 APAC Fiber Optical Cable Market by Development
12.4.11.4 APAC Fiber Optical Cable Market by Application
12.5 The Middle East & Africa
12.5.1 The Middle East & Africa Fiber Optical Cable Market by country
12.5.2 The Middle East & Africa Fiber Optical Cable Market by Fibre Type
12.5.3 The Middle East & Africa Fiber Optical Cable Market by Cable Type
12.5.4The Middle East & Africa Fiber Optical Cable Market by Development
12.5.5 The Middle East & Africa Fiber Optical Cable Market by Application
12.5.6 Israel
12.5.6.1 Israel Fiber Optical Cable Market by Fibre Type
12.5.6.2 Israel Fiber Optical Cable Market by Cable Type
12.5.6.3 Israel Fiber Optical Cable Market by Development
12.5.6.4 Israel Fiber Optical Cable Market by Application
12.5.7 UAE
12.5.7.1 UAE Fiber Optical Cable Market by Fibre Type
12.5.7.2 UAE Fiber Optical Cable Market by Cable Type
12.5.7.3 UAE Fiber Optical Cable Market by Development
12.5.7.4 UAE Fiber Optical Cable Market by Application
12.5.8South Africa
12.5.8.1 South Africa Fiber Optical Cable Market by Fibre Type
12.5.8.2 South Africa Fiber Optical Cable Market by Cable Type
12.5.8.3 South Africa Fiber Optical Cable Market by Development
12.5.8.4 South Africa Fiber Optical Cable Market by Application
12.5.9 Rest of Middle East & Africa
12.5.9.1 Rest of Middle East & Asia Fiber Optical Cable Market by Fibre Type
12.5.9.2 Rest of Middle East & Asia Fiber Optical Cable Market by Cable Type
12.5.9.3 Rest of Middle East & Asia Fiber Optical Cable Market by Development
12.5.9.4 Rest of Middle East & Asia Fiber Optical Cable Market by Application
12.6 Latin America
12.6.1 Latin America Fiber Optical Cable Market by Country
12.6.2 Latin America Fiber Optical Cable Market by Fibre Type
12.6.3 Latin America Fiber Optical Cable Market by Cable Type
12.6.4 Latin America Fiber Optical Cable Market by Development
12.6.5 Latin America Fiber Optical Cable Market by Application
12.6.6 Brazil
12.6.6.1 Brazil Fiber Optical Cable Market by Fibre Type
12.6.6.2 Brazil Africa Fiber Optical Cable Market by Cable Type
12.6.6.3 Brazil Fiber Optical Cable Market by Development
12.6.6.4 Brazil Fiber Optical Cable Market by Application
12.6.7 Argentina
12.6.7.1 Argentina Fiber Optical Cable Market by Fibre Type
12.6.7.2 Argentina Fiber Optical Cable Market by Cable Type
12.6.7.3 Argentina Fiber Optical Cable Market by Development
12.6.7.4 Argentina Fiber Optical Cable Market by Application
12.6.8 Rest of Latin America
12.6.8.1 Rest of Latin America Fiber Optical Cable Market by Fibre Type
12.6.8.2 Rest of Latin America Fiber Optical Cable Market by Cable Type
12.6.8.3 Rest of Latin America Fiber Optical Cable Market by Development
12.6.8.4 Rest of Latin America Fiber Optical Cable Market by Application
13. Company Profile
13.1 Gupta Power Infrastructure Limited
13.1.1 Market Overview
13.1.2 Financials
13.1.3 Product/Services/Offerings
13.1.4 SWOT Analysis
13.1.5 The SNS View
13.2 Sterlite Technologies Limited
13.2.1 Market Overview
13.2.2 Financials
13.2.3 Product/Services/Offerings
13.2.4 SWOT Analysis
13.2.5 The SNS View
13.3 Birla Cable Ltd. (Mp Birla Group),
13.3.1 Market Overview
13.3.2 Financials
13.3.3 Product/Services/Offerings
13.3.4 SWOT Analysis
13.3.5 The SNS View
13.4 Finolex Cables Limited
13.4.1 Market Overview
13.4.2 Financials
13.4.3 Product/Services/Offerings
13.4.4 SWOT Analysis
13.4.5 The SNS View
13.5 Kec International Ltd. (Rpg Enterprises),
13.5.1 Market Overview
13.5.2 Financials
13.5.3 Product/Services/Offerings
13.5.4 SWOT Analysis
13.5.5 The SNS View
13.6 Apar Industries Ltd.
13.6.1 Market Overview
13.6.2 Financials
13.6.3 Product/Services/Offerings
13.6.4 SWOT Analysis
13.6.5 The SNS View
13.7 Aksh Optifibre
13.7.1 Market Overview
13.7.2 Financials
13.7.3 Product/Services/Offerings
13.7.4 SWOT Analysis
13.7.5 The SNS View
13.8 Polycab India Limited
13.8.1 Market Overview
13.8.2 Financials
13.8.3 Product/Services/Offerings
13.8.4 SWOT Analysis
13.8.5 The SNS View
13.9 Vindhya Telelinks Ltd. (Mp Birla Group)
13.9.1 Market Overview
13.9.2 Financials
13.9.3 Product/Services/Offerings
13.9.4 SWOT Analysis
13.9.5 The SNS View
13.10 Universal Cables Ltd. (Mp Birla Group)
13.10.1 Market Overview
13.10.2 Financials
13.10.3 Product/Services/Offerings
13.10.4 SWOT Analysis
13.10.5 The SNS View
14. Competitive Landscape
14.1 Competitive Benchmarking
14.2 Market Share Analysis
14.3 Recent Developments
15. USE Cases and Best Practices
16. Conclusion
An accurate research report requires proper strategizing as well as implementation. There are multiple factors involved in the completion of good and accurate research report and selecting the best methodology to compete the research is the toughest part. Since the research reports we provide play a crucial role in any company’s decision-making process, therefore we at SNS Insider always believe that we should choose the best method which gives us results closer to reality. This allows us to reach at a stage wherein we can provide our clients best and accurate investment to output ratio.
Each report that we prepare takes a timeframe of 350-400 business hours for production. Starting from the selection of titles through a couple of in-depth brain storming session to the final QC process before uploading our titles on our website we dedicate around 350 working hours. The titles are selected based on their current market cap and the foreseen CAGR and growth.
The 5 steps process:
Step 1: Secondary Research:
Secondary Research or Desk Research is as the name suggests is a research process wherein, we collect data through the readily available information. In this process we use various paid and unpaid databases which our team has access to and gather data through the same. This includes examining of listed companies’ annual reports, Journals, SEC filling etc. Apart from this our team has access to various associations across the globe across different industries. Lastly, we have exchange relationships with various university as well as individual libraries.
Step 2: Primary Research
When we talk about primary research, it is a type of study in which the researchers collect relevant data samples directly, rather than relying on previously collected data. This type of research is focused on gaining content specific facts that can be sued to solve specific problems. Since the collected data is fresh and first hand therefore it makes the study more accurate and genuine.
We at SNS Insider have divided Primary Research into 2 parts.
Part 1 wherein we interview the KOLs of major players as well as the upcoming ones across various geographic regions. This allows us to have their view over the market scenario and acts as an important tool to come closer to the accurate market numbers. As many as 45 paid and unpaid primary interviews are taken from both the demand and supply side of the industry to make sure we land at an accurate judgement and analysis of the market.
This step involves the triangulation of data wherein our team analyses the interview transcripts, online survey responses and observation of on filed participants. The below mentioned chart should give a better understanding of the part 1 of the primary interview.
Part 2: In this part of primary research the data collected via secondary research and the part 1 of the primary research is validated with the interviews from individual consultants and subject matter experts.
Consultants are those set of people who have at least 12 years of experience and expertise within the industry whereas Subject Matter Experts are those with at least 15 years of experience behind their back within the same space. The data with the help of two main processes i.e., FGDs (Focused Group Discussions) and IDs (Individual Discussions). This gives us a 3rd party nonbiased primary view of the market scenario making it a more dependable one while collation of the data pointers.
Step 3: Data Bank Validation
Once all the information is collected via primary and secondary sources, we run that information for data validation. At our intelligence centre our research heads track a lot of information related to the market which includes the quarterly reports, the daily stock prices, and other relevant information. Our data bank server gets updated every fortnight and that is how the information which we collected using our primary and secondary information is revalidated in real time.
Step 4: QA/QC Process
After all the data collection and validation our team does a final level of quality check and quality assurance to get rid of any unwanted or undesired mistakes. This might include but not limited to getting rid of the any typos, duplication of numbers or missing of any important information. The people involved in this process include technical content writers, research heads and graphics people. Once this process is completed the title gets uploader on our platform for our clients to read it.
Step 5: Final QC/QA Process:
This is the last process and comes when the client has ordered the study. In this process a final QA/QC is done before the study is emailed to the client. Since we believe in giving our clients a good experience of our research studies, therefore, to make sure that we do not lack at our end in any way humanly possible we do a final round of quality check and then dispatch the study to the client.
The Solid State Battery Market size is expected to be valued at USD 83.20 Million in 2023. It is estimated to reach USD 1953.07 Million by 2032 with a growing CAGR of 42% over the forecast period 2024-2032.
The Ambient Lighting Market size was valued at USD 66.47 billion in 2023. It is expected to reach USD 160.62 billion by 2032 and grow at a CAGR of 10.30% over the forecast period 2024-2032.
The SerDes Market Size was valued at USD 0.761 Billion in 2023, and expected to reach USD 2.44 Billion by 2032, and grow at a CAGR of 12.25% over the forecast period 2024-2032.
The Autonomous Mobile Robots for Logistics and Warehousing Market was valued at $2.96 billion in 2023 and is expecting to grow to $18.56 billion at 22.6% CAGR by 2024-2032
The Semiconductor Market Size was USD 573.42 billion in 2023 and is expected to reach USD 1641.9 billion by 2032, growing at a CAGR of 12.4% over the forecast period of 2024-2032.
Neuromorphic Chip Market Size was valued at USD 97.30 Million in 2023 and is expected to reach USD 3058.5 Million by 2032 and grow at a CAGR of 46.80% over the forecast period 2024-2032.
Hi! Click one of our member below to chat on Phone