Fermentation Chemicals Market Report Scope and Overview:
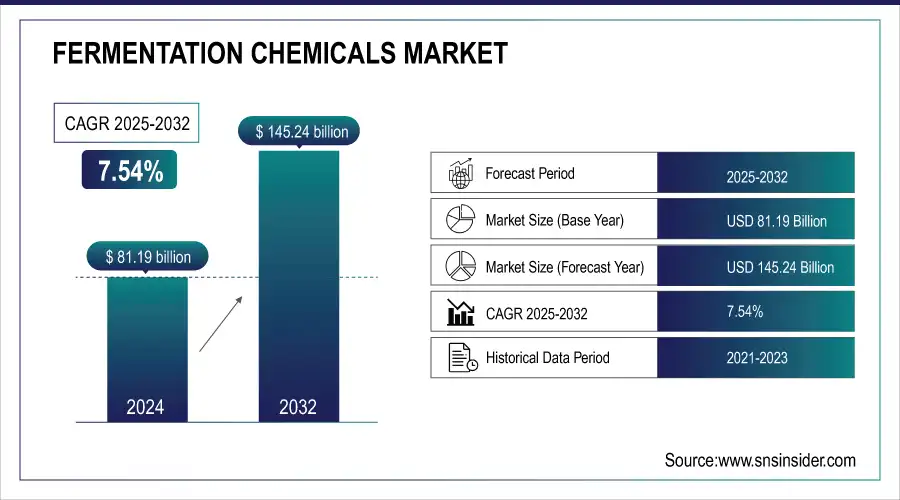
The Fermentation Chemicals Market Size was valued at USD 81.19 billion in 2024 and is expected to reach USD 145.24 billion by 2032 and grow at a CAGR of 7.54% over the forecast period 2025-2032.
The Fermentation Chemicals Market is driven by factors such as increasing demand for pharmaceutical products, growing awareness of the benefits of fermented food and beverages, and the rising need for sustainable industrial practices. The rise in demand for bio-based feedstock, particularly in industrial biotechnology, is credited with the expansion. Due to the increasing need for methanol and ethanol as well as to meet demands from various chemicals and industrial end-use applications, it is anticipated that the need for fermentation chemicals will only grow. Additionally, a similar, presumably greater demand for other organic acids from producers of fiber and plastic will have a major influence on the rise over the coming years.

Get E-PDF Sample Report on Fermentation Chemicals Market - Request Sample Report
For example, Evonik Industries announced the release of "Vecollan," a very pure and soluble collagen made through fermentation, in July 2022. This collagen is not obtained from animals. Its triple-helix structure, which is derived from a fermentation-based production technique, replicates the characteristics of natural collagen and makes it appropriate for use in pharmaceutical, medical, and other life science applications.

Fermentation Chemicals Market Highlights:
-
Fermentation chemicals are extensively used across pharmaceuticals, food & beverages, and industrial sectors, enhancing product quality, shelf life, and sustainability.
-
The market is driven by increasing awareness of the benefits of fermentation-based products, including improved nutrition, digestibility, and eco-friendly production.
-
Rising demand for specialty chemicals and the development of novel fermentation techniques are creating growth opportunities across industries.
-
North America leads the market with the highest revenue share, while Asia-Pacific is expected to witness the fastest growth due to rising populations and increasing industrialization.
-
Market growth is restrained by dependency on specific raw materials like sugarcane, starch, and corn, making the industry vulnerable to supply fluctuations and price volatility.
-
High production costs and ongoing R&D requirements for fermentation-based processes may limit expansion in the near term.
Moreover, In the pharmaceutical sector, fermentation chemicals are utilized in the production of antibiotics, vaccines, and other medicinal products. The food and beverage industry also heavily relies on fermentation chemicals. They are used in the production of alcoholic beverages, such as beer and wine, as well as in the manufacturing of dairy products, bread, and pickles. Fermentation chemicals enhance the flavor, texture, and shelf life of these products, meeting the demands of consumers and ensuring their satisfaction. Furthermore, fermentation chemicals find extensive applications in industrial processes. They are used in the production of biofuels, bioplastics, and various chemicals used in the manufacturing sector. These chemicals offer a sustainable and eco-friendly alternative to traditional chemical production methods, contributing to the global efforts towards a greener future
Fermentation chemicals are produced using an expensive process that takes a lot of research and development. Furthermore, because high-quality feedstocks produce better yields, feedstock quality is critical to the synthesis of fermentation chemicals. The development of this costly and still-emerging approach for generating chemicals from bio-based basic materials is ongoing. These elements are probably going to limit the product market's potential for expansion in the upcoming years.
Fermentation Chemicals Market Drivers:
-
Increasing awareness about the benefits of fermentation-based products drives the market growth.
Fermentation, the biological process involves the breakdown of complex compounds by microorganisms, resulting in the production of various chemicals and substances. These fermentation-based products have found applications in diverse industries such as food and beverages, pharmaceuticals, and biofuels. One of the key reasons for the rising awareness about fermentation-based products is their potential to enhance food preservation and nutritional value. Fermented foods, such as yogurt, cheese, and sauerkraut, not only have an extended shelf life but also offer improved digestibility and increased nutrient content. This has led to a growing demand for such products among health-conscious consumers.
Furthermore, fermentation plays a crucial role in the production of pharmaceuticals and biopharmaceuticals. The process enables the synthesis of essential drugs, vaccines, and therapeutic proteins. These fermentation-derived pharmaceuticals have proven to be effective in treating various diseases and medical conditions, contributing to the overall growth of the pharmaceutical industry. Additionally, the utilization of fermentation in the production of biofuels has gained significant traction in recent years. Biofuels, such as ethanol and biodiesel, offer a sustainable alternative to fossil fuels, reducing greenhouse gas emissions and promoting environmental conservation. As a result, governments and industries worldwide are increasingly investing in fermentation-based biofuel production, driving the demand for fermentation chemicals.
Fermentation Chemicals Market Restraints:
-
More dependency on raw materials hampers market growth.
The growth of the fermentation chemicals market is constrained by a high dependency on raw materials. Production of these chemicals largely relies on specific feedstocks such as sugarcane, starch, and corn. Any fluctuations in the availability or pricing of these raw materials can directly affect manufacturing processes, production costs, and overall revenue, thereby hindering market expansion. This reliance on agricultural inputs makes the market vulnerable to supply chain disruptions, seasonal variations, and global commodity price volatility
Fermentation Chemicals Market Opportunities:
-
Increasing demand for specialty chemicals and the development of novel fermentation techniques
The fermentation chemicals market is benefiting from the rising demand for specialty chemicals and the continuous development of novel fermentation techniques. Innovations in fermentation processes enable the production of high-value chemicals with improved efficiency, purity, and sustainability. This trend is driving the adoption of advanced fermentation technologies across various industries, including pharmaceuticals, food and beverages, and agriculture, thereby supporting market growth.
Fermentation Chemicals Market Segment Analysis:
By Product
Alcohol product type dominated the market with the highest revenue share of more than 57.22% in 2024. The fermentation indicates that the activity of microbes is beneficial. Alcoholic beverages including wine, beer, and cider are made by fermentation. Dairy products and leavening bread are further products of fermentation. The food and beverage business has a strong demand for fermentation chemicals since it is the oldest biotechnology that humans have utilized to generate safer, more stable, and superior food products.
Organic acid demand is also rising in the upcoming time such as acids classified as organic (phenolic) have pKa values of three (carboxylic) or higher. Other names for them include malic acid, propionic acid, fumaric acid, lactic acid, citric acid, kojic acid, acetic acid, gluconic acid, 2-ketoglutaric acid, 5-ketoglutaric acid, and -ketoglutaric acid. It is now feasible to generate organic acids on a big scale thanks to modern technologies. since they can prolong a product's shelf life and prevent the growth of microorganisms. Food preservatives often contain organic acids such as lactic acid, fumaric acid, and tartaric acid.

By Application
The industrial application dominated the market with the highest revenue share of more than 43% in 2024. The high proportion can be attributed to rising biotechnology, research and development, and production from renewable raw materials investments. Low conversion and relatively few applications of directly biosynthesized fermentation chemicals are among the drawbacks of formulating from lignocellulosic feedstock, nevertheless.
The food & beverage are anticipated to expand at the fastest compound annual growth rate (CAGR) during the projected period. Food and beverage demand is expected to rise in tandem with the world population growth. Food items that are traditionally produced through fermentation chemicals include dairy products like cheese, sour cream, yogurt, and kefir; food additives like flavors; alcoholic beverages like distilled spirits, beer, and wine; plant products like sauerkraut, bread, coffee, soy, sauce, and tofu; and fermented meat and fish like salami and pepperoni.
Fermentation Chemicals Market Regional Analysis:
North America Fermentation Chemicals Market Trends:
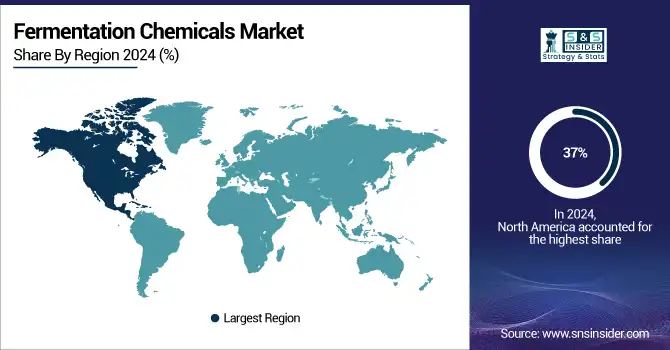
North America dominated the fermentation chemical market with the highest revenue share of about 37% in 2024. This dominance is due to the increasing consumption of chemicals across various industries, including pharmaceuticals, industrial, and food & beverages. Moreover, the thriving pharmaceutical sector in countries like the United States, Mexico, and Canada is expected to further fuel the demand for fermentation chemicals in North America. Furthermore, the region's strong presence of major cosmetic manufacturing companies is anticipated to drive the demand for fermentation chemicals. These companies rely heavily on fermentation chemicals to enhance the quality and effectiveness of their products. As a result, the demand for fermentation chemicals is projected to witness significant growth in North America.

Get Customized Report as Per Your Business Requirement - Request For Customized Report
For instance, As customer demand for plant-based products rises, in March 2022 Nestle SA will invest USD 675 million in a new plant in Metro Phoenix, Arizona, to create beverages, including oat milk coffee creamers. In 2024, the plant is anticipated to begin operations.
Asia-Pacific Fermentation Chemicals Market Trends:
Asia Pacific is expected to grow with the highest CAGR of about 6.9% in the fermentation chemical market during the forecast period of 2025-2032. The expected growth in this region is attributed to the increasing purchasing power parity, high-income levels, and expanding populations in countries such as China and India. These factors have led to a surge in demand for fermentation chemicals. Moreover, the forecast period anticipates a significant rise in demand for fermentation chemicals across various industries, driven by the growing number of food and beverage start-ups, particularly in India.
Europe Fermentation Chemicals Market Trends:
Europe holds a significant share in the fermentation chemicals market due to its well-established pharmaceutical, food & beverage, and specialty chemicals industries. Countries such as Germany, France, and the United Kingdom are home to major chemical manufacturers investing in advanced fermentation technologies. The increasing focus on sustainable production methods and bio-based products is expected to drive the demand for fermentation chemicals in the region. Strong R&D infrastructure and government support for biotechnology further enhance market growth prospects in Europe.
Latin America Fermentation Chemicals Market Trends:
Latin America is expected to see steady growth in the fermentation chemicals market due to increasing investments in the pharmaceutical, food & beverage, and cosmetic industries. Brazil and Mexico are key contributors, with growing industrialization and demand for plant-based and bio-based products. Additionally, supportive government policies and initiatives for sustainable production practices are likely to enhance the adoption of fermentation chemicals during the forecast period.
Middle East & Africa Fermentation Chemicals Market Trends:
The Middle East & Africa region is witnessing gradual growth in the fermentation chemicals market, driven by expanding industrial sectors and increasing adoption of bio-based chemicals. Countries such as Saudi Arabia, UAE, and South Africa are investing in industrial biotechnology and specialty chemicals, which boosts the demand for fermentation-based products. Moreover, rising industrialization and initiatives to diversify economies beyond oil and gas are expected to further support market growth in this region.
Fermentation Chemicals Market Key Players:
-
BASF SE
-
DuPont Danisco
-
Dow
-
Evonik Industries AG
-
Amano Enzymes USA Co. Ltd.
-
Cargill, Inc.
-
ADM
-
Ajinomoto Co., Inc.
-
DSM-Firmenich
-
International Flavors & Fragrances Inc. (IFF)
-
Kerry Group plc
-
Advanced Enzyme Technologies Ltd.
-
Dyadic International Inc.
-
Longda Bio-products
-
Lesaffre
-
Adisseo
-
Novus International, Inc.
Fermentation Chemicals Market Competitive Landscape:
Archer Daniels Midland (ADM), established in 1902 and headquartered in Chicago, IL, is a global leader in human and animal nutrition and one of the world’s largest agricultural origination and processing companies. ADM processes crops such as corn, oilseeds, and wheat into a wide range of products for food, animal feed, industrial applications, and energy, focusing on sustainability, innovation, and global supply chain efficiency.
Solugen, founded in 2016 and based in Houston, TX, is a chemical company that combines synthetic biology with metal catalysis to produce carbon-negative chemicals from plant-derived feedstocks. Solugen’s Bioforge technology supports sustainable specialty chemical production, reducing environmental impact.
-
In 2023, ADM and Solugen announced that they will be manufacturing plant-based specialty chemicals, including fermentation chemicals. The company intends to manufacture specialty chemicals and bio-based building block molecules to serve the cleaning, personal care, agriculture, and energy industries.
Novozymes, established in 2000 and headquartered in Bagsværd, Denmark, is a global leader in industrial biotechnology. The company specializes in enzymes, microorganisms, and biopharmaceutical ingredients, serving sectors such as food and beverages, agriculture, bioenergy, and household care, focusing on sustainable solutions and innovation across diverse industries.
-
In July 2022, Novozymes introduced Innova® Apex and Innova® Turbo to their Innova platform. These new additions are specifically designed to optimize fermentation times, allowing ethanol producers to achieve their production targets and business goals more effectively.
BASF SE, founded in 1865 and headquartered in Ludwigshafen, Germany, is the world’s largest chemical producer. The company offers chemicals, plastics, crop protection, and performance products across diverse industries. Operating in 93 countries with over 112,000 employees, BASF focuses on innovation, sustainability, and global market leadership in chemicals.
-
In Jan 2022, BASF expanded the production capacity of their enzyme plant in Ludwigshafen, Germany. This expansion has resulted in a significant increase in the number of feasible fermentation runs that can be conducted annually.
| Report Attributes | Details |
|---|---|
| Market Size in 2024 | USD 81.19 billion |
| Market Size by 2032 | USD 145.24 Billion |
| CAGR | CAGR of 7.54 % From 2025 to 2032 |
| Base Year | 2024 |
| Forecast Period | 2025-2032 |
| Historical Data | 2021-2023 |
| Report Scope & Coverage | Market Size, Segments Analysis, Competitive Landscape, Regional Analysis, DROC & SWOT Analysis, Forecast Outlook |
| Key Segments | • By Products (Alcohols, Amino Acids, Enzymes, Organic Acids, And Others) • By Application (Industrial Application, Cosmetic & Toiletry, Plastics & Fibers, Food & Beverages, Nutritional & Pharmaceutical, And Others) |
| Regional Analysis/Coverage | North America (US, Canada), Europe (Germany, UK, France, Italy, Spain, Russia, Poland, Rest of Europe), Asia Pacific (China, India, Japan, South Korea, Australia, ASEAN Countries, Rest of Asia Pacific), Middle East & Africa (UAE, Saudi Arabia, Qatar, South Africa, Rest of Middle East & Africa), Latin America (Brazil, Argentina, Mexico, Colombia, Rest of Latin America). |
| Company Profiles | AB Enzymes, BASF SE, DuPont Danisco, Dow, Evonik Industries AG, Chr. Hansen Holding A/S, Amano Enzymes USA Co. Ltd., Cargill, Inc., ADM (Archer Daniels Midland), Novozymes A/S, Ajinomoto Co., Inc., DSM-Firmenich, International Flavors & Fragrances Inc. (IFF), Kerry Group plc, Advanced Enzyme Technologies Ltd., Dyadic International Inc., Longda Bio-products, Lesaffre, Adisseo, Novus International, Inc. |

