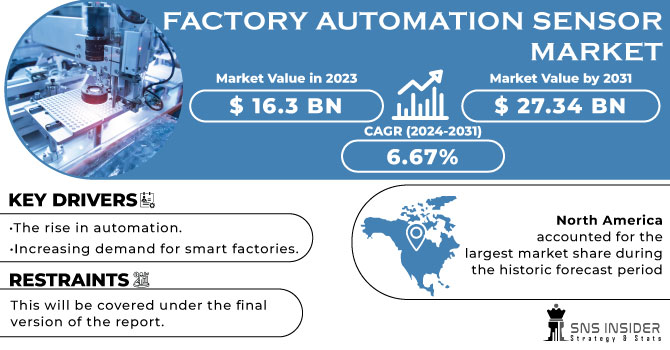
The Factory Automation Sensor Market Size was valued at USD 15.98 billion in 2023 and is expected to reach USD 26.26 billion by 2032 and grow at a CAGR of 5.68% over the forecast period 2024-2032.
Get more information on Factory Automation Sensor Market - Request Sample Report
The Factory Automation Sensor Market is seeing significant growth, driven by the rise of Industrial Internet of Things (IIoT) technologies and a growing need for energy-efficient solutions. Sensors are integral to IIoT applications, enabling real-time data collection, accurate monitoring, and seamless communication, which in turn boost productivity and operational efficiency in industrial processes. Advancements such as ultra-reliable low-latency communication (URLLC) for wireless control are enhancing sensor performance while minimizing power consumption. The integration of AI and machine learning in smart manufacturing technologies further accelerates this growth by enabling predictive maintenance, automated quality control, and process optimization. These innovations align with the broader trends in automation and energy efficiency across industries. The increased adoption of smart factories, powered by AI and decentralized manufacturing, is enhancing operational efficiency and helping manufacturers stay competitive in a dynamic industry. This shift is evident in sectors like LNG, where automation technologies are playing a crucial role in optimizing energy efficiency, managing risk, and reducing emissions. For example, companies like Emerson are leveraging advanced automation and intelligent sensors in LNG projects to improve plant performance and reduce energy consumption, contributing to sustainability goals. Similarly, industrial AI’s power demands, though initially high, are being managed more efficiently in sectors like factory automation, where energy consumption is optimized. The adoption of AI-powered systems and energy-efficient sensors is poised to help manufacturers navigate challenges like labor shortages and volatile material costs. As manufacturers anticipate increased revenues in 2025, as indicated by a recent Institute for Supply Management survey, the integration of smart factory technologies promises to boost energy efficiency, reduce operational costs, and enable businesses in increasingly complex market, positioning them to capitalize on emerging opportunities.
Drivers
Advancements in Sensor Technology Driving Industrial Automation Market Growth
The rapid evolution of sensor technology is a key driver in the expansion of the industrial automation market. Innovations such as miniaturized sensors, wireless connectivity, and AI integration are transforming automation systems, making them more efficient, versatile, and essential for modern manufacturing processes. This technological progression has fueled the increasing demand for industrial automation cables, which are critical for connecting advanced sensors and ensuring high-speed data transmission. The rise in industrial robot adoption has significantly boosted the demand for current sensors, enabling more precise data collection and improving operational efficiency. Miniaturized sensors are reducing the size and cost of automation systems, while wireless connectivity ensures seamless communication between machines and centralized control units. Additionally, AI integration enhances sensor capabilities by enabling predictive maintenance, real-time monitoring, and optimized machine performance. AI-powered quality control systems further contribute to the manufacturing process by improving precision and reducing operational costs. The growing implementation of Industry 4.0 technologies is driving the need for smart manufacturing solutions, where interconnected systems, data analytics, and automation converge to create highly efficient and adaptive production environments. Automation cables play a central role in this transformation, as they facilitate the communication necessary for smart factories to operate effectively. As companies increasingly adopt automation systems, IoT, and data analytics to optimize industrial processes, the demand for advanced industrial automation cables continues to rise.
Restraints
Cybersecurity Risks and Challenges in the Evolution of Industrial Automation Systems.
As industrial automation systems become more interconnected through the Internet of Things (IoT) and wireless communication, cybersecurity concerns are emerging as a significant challenge. The vulnerabilities in sensor systems, networks, and data transmission channels are increasingly targeted by cybercriminals, exposing businesses to risks such as data breaches, theft, and operational disruptions. The integration of IoT and AI in industrial sensors intensifies these security risks, as the interconnectivity of devices creates numerous entry points for potential hackers. These vulnerabilities can result in compromised data collection, equipment malfunctions, and even production process disruptions. Automation systems that lack proper security measures are prone to causing substantial financial losses and prolonged operational downtime. Additionally, managing and securing the vast amounts of data generated by industrial sensors becomes a complex task, as organizations strive to protect their systems from evolving cyber threats. The growing demand for AI-powered cybersecurity solutions to secure smart factories reflects this concern. However, the absence of standardized cybersecurity frameworks and inadequate regulation in operational technology (OT) systems slow the implementation of effective security protocols. With industrial automation increasingly reliant on wireless communication, establishing a robust cybersecurity infrastructure is vital to ensure the protection and smooth operation of these advanced technologies.
By Sensor Type
The temperature sensors segment is leading the Factory Automation Sensor Market, holding a 25% share in 2023. These sensors are crucial in factory automation for monitoring and controlling temperatures within manufacturing processes, ensuring optimal performance, safety, and product quality. They are widely used across industries such as automotive, food and beverage, pharmaceuticals, and chemicals. Temperature sensors help in preventing equipment damage, improving energy efficiency, and maintaining system reliability by providing real-time temperature data. The increasing demand for automation and the push for more precise control over manufacturing processes are driving the growth of temperature sensors. Furthermore, advancements in sensor technology, such as wireless temperature sensors and integration with IoT, are contributing to the segment's dominance, offering better connectivity and ease of use in complex factory environments.
By Application
The manufacturing segment is the dominant application in the Factory Automation Sensor Market, accounting for approximately 20% of the market share in 2023. Sensors in manufacturing play a critical role in enhancing operational efficiency, product quality, and process automation. They are employed in various stages of production, from assembly lines to quality control, to monitor variables such as temperature, pressure, proximity, and vibration. These sensors help manufacturers optimize their operations by ensuring precision, reducing downtime, and improving safety. As industries continue to embrace Industry 4.0 and smart factories, the need for advanced sensors in manufacturing applications is expected to rise. The integration of IoT and AI-driven analytics is further boosting sensor usage in manufacturing, allowing real-time monitoring and predictive maintenance to improve overall productivity and reduce operational costs.
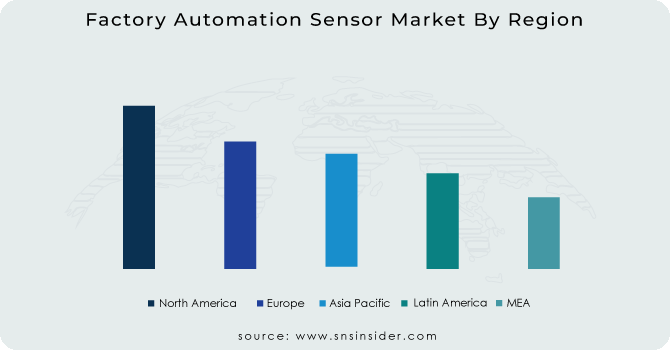
North America holds a dominant share of approximately 36% in the Factory Automation Sensor Market in 2023. The region’s leadership is driven by significant advancements in industrial automation, the widespread adoption of Industry 4.0, and the presence of leading sensor manufacturers. The United States, in particular, is at the forefront of automation adoption, with industries such as automotive, aerospace, and electronics heavily investing in automation technologies. Canada's industrial sector is also experiencing rapid growth, driven by its focus on smart manufacturing and sustainability. North America's robust technological infrastructure, high investments in R&D, and increasing demand for efficient production systems further contribute to the dominance of the region in the factory automation sensor market. Government initiatives and policies that encourage automation and technological innovation are fostering the growth of sensor markets in this region.
Asia-Pacific is the fastest-growing region in the Factory Automation Sensor Market from 2024 to 2032, driven by rapid industrialization and technological advancements in countries like China, Japan, South Korea, and India. China, as a global manufacturing hub, leads with heavy investments in smart factories and robotics. Japan and South Korea are at the forefront of automation, with innovations in robotics and industrial systems. India’s expanding manufacturing sector also accelerates sensor adoption for enhanced productivity and cost savings. Government initiatives, such as Industry 4.0 and smart manufacturing, are further supporting market growth. The region's demand for advanced automation solutions is spurred by increased IoT adoption, automation in industries like automotive and electronics, and the need for high-performance, reliable sensors. Asia-Pacific's growth is fueled by technological progress and strategic investments in automation.
Get Customized Report as per your Business Requirement - Request For Customized Report
Some of the major players in Factory Automation Sensor Market with their product:
SICK AG (LiDAR Sensors, Safety Sensors, Vision Sensors)
Siemens (Proximity Sensors, Temperature Sensors, Vision Sensors)
Omron (Inductive Sensors, Vision Sensors, Temperature Sensors)
Turck (Inductive Sensors, Pressure Sensors, RFID Sensors)
Rockwell Automation (Photoelectric Sensors, Proximity Sensors, Vibration Sensors)
Balluff (Inductive Sensors, Optical Sensors, Pressure Sensors)
Schneider Electric (Temperature Sensors, Pressure Sensors, Proximity Sensors)
ABB (Ultrasonic Sensors, Temperature Sensors, Proximity Sensors)
Keyence (Laser Displacement Sensors, Vision Sensors, Optical Sensors)
Bihl+Wilfing (Safety Sensors, RFID Sensors, Vision Sensors)
Teledyne Technologies (Environmental Sensors, Pressure Sensors, Vibration Sensors)
Phoenix Contact (Inductive Sensors, Pressure Sensors, Temperature Sensors)
IFM Electronic (Proximity Sensors, Temperature Sensors, Vibration Sensors)
Honeywell (Temperature Sensors, Pressure Sensors, Gas Sensors)
Eaton (Pressure Sensors, Proximity Sensors, Temperature Sensors)
Festo (Flow Sensors, Pressure Sensors, Vision Sensors)
Bosch Rexroth (Position Sensors, Proximity Sensors, Force Sensors)
Panasonic (Inductive Sensors, Optical Sensors, Pressure Sensors)
National Instruments (Temperature Sensors, Pressure Sensors, Vibration Sensors)
Pepperl+Fuchs (Inductive Sensors, Photoelectric Sensors, Vibration Sensors)
List of Suppliers who supplies raw material and component in Factory Automation Sensor Market:
3M
Dow Chemical Company
DuPont
Mitsubishi Materials
Saint-Gobain
Nippon Steel Corporation
LG Chem
Infineon Technologies
Samsung SDI
TE Connectivity
Dec 2024, Aeva and SICK Expand Collaboration for Advanced Sensor SolutionsAeva has deepened its partnership with SICK to integrate its frequency-modulated continuous wave (FMCW) technology into SICK’s portfolio of high-accuracy contactless sensors for industrial applications. This development enhances precision in factory automation through Aeva’s CoreVision module and advanced signal processing algorithms.
Oct 2024 , Siemens and Microsoft Transform Industrial Automation with AI-Powered CopilotSiemens, in collaboration with Microsoft, has advanced its Industrial Copilot by integrating Microsoft Azure OpenAI Service, enabling enhanced performance for manufacturing and automation environments. The Gen AI-powered assistant is set for a global rollout with thyssenkrupp Automation Engineering in early 2025.
Aug 2024, ABB to Strengthen Emission Monitoring with Födisch Group Acquisition, ABB announced its agreement to acquire the Födisch Group, enhancing its Continuous Emission Monitoring Systems (CEMS) portfolio with advanced measurement and analysis solutions tailored for the energy and industrial sectors.
Report Attributes | Details |
---|---|
Market Size in 2023 | USD 15.98 Billion |
Market Size by 2032 | USD 26.26 Billion |
CAGR | CAGR of 5.68% From 2024 to 2032 |
Base Year | 2023 |
Forecast Period | 2024-2032 |
Historical Data | 2020-2022 |
Report Scope & Coverage | Market Size, Segments Analysis, Competitive Landscape, Regional Analysis, DROC & SWOT Analysis, Forecast Outlook |
Key Segments | • By Sensor Type (Temperature Sensors, Vibration Sensors, Humidity Sensors, Proximity Sensors, Pressure Sensors, Vision Sensors, Others) • By Application (Manufacturing, Automotive, Chemicals, Energy & Power, Food & Beverages, Oil & Gas, Aerospace And Defense, Pharmaceuticals, Others) |
Regional Analysis/Coverage | North America (US, Canada, Mexico), Europe (Eastern Europe [Poland, Romania, Hungary, Turkey, Rest of Eastern Europe] Western Europe] Germany, France, UK, Italy, Spain, Netherlands, Switzerland, Austria, Rest of Western Europe]), Asia Pacific (China, India, Japan, South Korea, Vietnam, Singapore, Australia, Rest of Asia Pacific), Middle East & Africa (Middle East [UAE, Egypt, Saudi Arabia, Qatar, Rest of Middle East], Africa [Nigeria, South Africa, Rest of Africa], Latin America (Brazil, Argentina, Colombia, Rest of Latin America) |
Company Profiles | SICK AG, Siemens, Omron, Turck, Rockwell Automation, Balluff, Schneider Electric, ABB, Keyence, Bihl+Wilfing, Teledyne Technologies, Phoenix Contact, IFM Electronic, Honeywell, Eaton, Festo, Bosch Rexroth, Panasonic, National Instruments, and Pepperl+Fuchs. |
Key Drivers | • Advancements in Sensor Technology Driving Industrial Automation Market Growth |
Restraints | • Cybersecurity Risks and Challenges in the Evolution of Industrial Automation Systems. |
Ans: The Factory Automation Sensor Market size was valued at USD 15.98 billion in 2023 at a CAGR of 5.68%.
Ans: The market size is expected to reach USD 26.26 billion by 2032.
Ans: The rise in automation, and increasing demand for smart factories.
Ans: North America id dominating in Factory Automation Sensor Market
Ans: Temperature sensors is dominating in Factory Automation Sensor Market.
Table of Content
1. Introduction
1.1 Market Definition
1.2 Scope (Inclusion and Exclusions)
1.3 Research Assumptions
2. Executive Summary
2.1 Market Overview
2.2 Regional Synopsis
2.3 Competitive Summary
3. Research Methodology
3.1 Top-Down Approach
3.2 Bottom-up Approach
3.3. Data Validation
3.4 Primary Interviews
4. Market Dynamics Impact Analysis
4.1 Market Driving Factors Analysis
4.1.2 Drivers
4.1.2 Restraints
4.2 PESTLE Analysis
4.3 Porter’s Five Forces Model
5. Statistical Insights and Trends Reporting
5.1 Technological Adoption and Trends, by Region
5.2 Manufacturing and Deployment Data, by Region
5.3 Sensor Lifespan and Durability Data, by Region
5.4 Regulatory Impact Data, by Region
6. Competitive Landscape
6.1 List of Major Companies, By Region
6.2 Market Share Analysis, By Region
6.3 Product Benchmarking
6.3.1 Product specifications and features
6.3.2 Pricing
6.4 Strategic Initiatives
6.4.1 Marketing and promotional activities
6.4.2 Distribution and supply chain strategies
6.4.3 Expansion plans and new product launches
6.4.4 Strategic partnerships and collaborations
6.5 Technological Advancements
6.6 Market Positioning and Branding
7. Factory Automation Sensor Market Segmentation, by Sensor
7.1 Chapter Overview
7.2 Temperature sensors
7.2.1 Temperature sensors Market Trends Analysis (2020-2032)
7.2.2 Temperature sensors Market Size Estimates and Forecasts to 2032 (USD Billion)
7.3 Vibration sensors
7.3.1 Vibration sensors Market Trends Analysis (2020-2032)
7.3.2 Vibration sensors Market Size Estimates and Forecasts to 2032 (USD Billion)
7.4 Humidity sensors
7.4.1 Humidity sensors Market Trends Analysis (2020-2032)
7.4.2 Humidity sensors Market Size Estimates and Forecasts to 2032 (USD Billion)
7.5 Proximity sensors
7.5.1 Proximity sensors Market Trends Analysis (2020-2032)
7.5.2 Proximity sensors Market Size Estimates and Forecasts to 2032 (USD Billion)
7.6 Pressure sensors
7.6.1 Pressure sensors Market Trends Analysis (2020-2032)
7.6.2 Pressure sensors Market Size Estimates and Forecasts to 2032 (USD Billion)
7.7 Vision sensors
7.7.1 Vision sensors Market Trends Analysis (2020-2032)
7.7.2 Vision sensors Market Size Estimates and Forecasts to 2032 (USD Billion)
7.8 Others
7.8.1 Others Market Trends Analysis (2020-2032)
7.8.2 Others Market Size Estimates and Forecasts to 2032 (USD Billion)
8. Factory Automation Sensor Market Segmentation, by Application
8.1 Chapter Overview
8.2 Manufacturing
8.2.1 Manufacturing Market Trends Analysis (2020-2032)
8.2.2 Manufacturing Market Size Estimates and Forecasts to 2032 (USD Billion)
8.3 Automotive
8.3.1 Automotive Market Trends Analysis (2020-2032)
8.3.2 Automotive Market Size Estimates and Forecasts to 2032 (USD Billion)
8.4 Chemicals
8.4.1 Chemicals Market Trends Analysis (2020-2032)
8.4.2 Chemicals Market Size Estimates and Forecasts to 2032 (USD Billion)
8.5 Energy & power
8.5.1 Energy & power Market Trends Analysis (2020-2032)
8.5.2 Energy & power Market Size Estimates and Forecasts to 2032 (USD Billion)
8.6 Food & beverages
8.6.1 Food & beverages Market Trends Analysis (2020-2032)
8.6.2 Food & beverages Market Size Estimates and Forecasts to 2032 (USD Billion)
8.7 Oil & gas
8.7.1 Oil & gas Market Trends Analysis (2020-2032)
8.7.2 Oil & gas Market Size Estimates and Forecasts to 2032 (USD Billion)
8.8 Aerospace and defense
8.8.1 Aerospace and defense Market Trends Analysis (2020-2032)
8.8.2 Aerospace and defense Market Size Estimates and Forecasts to 2032 (USD Billion)
8.9 Pharmaceuticals
8.9.1 Pharmaceuticals Market Trends Analysis (2020-2032)
8.9.2 Pharmaceuticals Market Size Estimates and Forecasts to 2032 (USD Billion)
8.10 Others
8.10.1 Others Market Trends Analysis (2020-2032)
8.10.2 Others Market Size Estimates and Forecasts to 2032 (USD Billion)
9. Regional Analysis
9.1 Chapter Overview
9.2 North America
9.2.1 Trends Analysis
9.2.2 North America Factory Automation Sensor Market Estimates and Forecasts, by Country (2020-2032) (USD Billion)
9.2.3 North America Factory Automation Sensor Market Estimates and Forecasts, by Sensor (2020-2032) (USD Billion)
9.2.4 North America Factory Automation Sensor Market Estimates and Forecasts, by Application (2020-2032) (USD Billion)
9.2.5 USA
9.2.5.1 USA Factory Automation Sensor Market Estimates and Forecasts, by Sensor (2020-2032) (USD Billion)
9.2.5.2 USA Factory Automation Sensor Market Estimates and Forecasts, by Application (2020-2032) (USD Billion)
9.2.6 Canada
9.2.6.1 Canada Factory Automation Sensor Market Estimates and Forecasts, by Sensor (2020-2032) (USD Billion)
9.2.6.2 Canada Factory Automation Sensor Market Estimates and Forecasts, by Application (2020-2032) (USD Billion)
9.2.7 Mexico
9.2.7.1 Mexico Factory Automation Sensor Market Estimates and Forecasts, by Sensor (2020-2032) (USD Billion)
9.2.7.2 Mexico Factory Automation Sensor Market Estimates and Forecasts, by Application (2020-2032) (USD Billion)
9.3 Europe
9.3.1 Eastern Europe
9.3.1.1 Trends Analysis
9.3.1.2 Eastern Europe Factory Automation Sensor Market Estimates and Forecasts, by Country (2020-2032) (USD Billion)
9.3.1.3 Eastern Europe Factory Automation Sensor Market Estimates and Forecasts, by Sensor (2020-2032) (USD Billion)
9.3.1.4 Eastern Europe Factory Automation Sensor Market Estimates and Forecasts, by Application (2020-2032) (USD Billion)
9.3.1.5 Poland
9.3.1.5.1 Poland Factory Automation Sensor Market Estimates and Forecasts, by Sensor (2020-2032) (USD Billion)
9.3.1.5.2 Poland Factory Automation Sensor Market Estimates and Forecasts, by Application (2020-2032) (USD Billion)
9.3.1.6 Romania
9.3.1.6.1 Romania Factory Automation Sensor Market Estimates and Forecasts, by Sensor (2020-2032) (USD Billion)
9.3.1.6.2 Romania Factory Automation Sensor Market Estimates and Forecasts, by Application (2020-2032) (USD Billion)
9.3.1.7 Hungary
9.3.1.7.1 Hungary Factory Automation Sensor Market Estimates and Forecasts, by Sensor (2020-2032) (USD Billion)
9.3.1.7.2 Hungary Factory Automation Sensor Market Estimates and Forecasts, by Application (2020-2032) (USD Billion)
9.3.1.8 Turkey
9.3.1.8.1 Turkey Factory Automation Sensor Market Estimates and Forecasts, by Sensor (2020-2032) (USD Billion)
9.3.1.8.2 Turkey Factory Automation Sensor Market Estimates and Forecasts, by Application (2020-2032) (USD Billion)
9.3.1.9 Rest of Eastern Europe
9.3.1.9.1 Rest of Eastern Europe Factory Automation Sensor Market Estimates and Forecasts, by Sensor (2020-2032) (USD Billion)
9.3.1.9.2 Rest of Eastern Europe Factory Automation Sensor Market Estimates and Forecasts, by Application (2020-2032) (USD Billion)
9.3.2 Western Europe
9.3.2.1 Trends Analysis
9.3.2.2 Western Europe Factory Automation Sensor Market Estimates and Forecasts, by Country (2020-2032) (USD Billion)
9.3.2.3 Western Europe Factory Automation Sensor Market Estimates and Forecasts, by Sensor (2020-2032) (USD Billion)
9.3.2.4 Western Europe Factory Automation Sensor Market Estimates and Forecasts, by Application (2020-2032) (USD Billion)
9.3.2.5 Germany
9.3.2.5.1 Germany Factory Automation Sensor Market Estimates and Forecasts, by Sensor (2020-2032) (USD Billion)
9.3.2.5.2 Germany Factory Automation Sensor Market Estimates and Forecasts, by Application (2020-2032) (USD Billion)
9.3.2.6 France
9.3.2.6.1 France Factory Automation Sensor Market Estimates and Forecasts, by Sensor (2020-2032) (USD Billion)
9.3.2.6.2 France Factory Automation Sensor Market Estimates and Forecasts, by Application (2020-2032) (USD Billion)
9.3.2.7 UK
9.3.2.7.1 UK Factory Automation Sensor Market Estimates and Forecasts, by Sensor (2020-2032) (USD Billion)
9.3.2.7.2 UK Factory Automation Sensor Market Estimates and Forecasts, by Application (2020-2032) (USD Billion)
9.3.2.8 Italy
9.3.2.8.1 Italy Factory Automation Sensor Market Estimates and Forecasts, by Sensor (2020-2032) (USD Billion)
9.3.2.8.2 Italy Factory Automation Sensor Market Estimates and Forecasts, by Application (2020-2032) (USD Billion)
9.3.2.9 Spain
9.3.2.9.1 Spain Factory Automation Sensor Market Estimates and Forecasts, by Sensor (2020-2032) (USD Billion)
9.3.2.9.2 Spain Factory Automation Sensor Market Estimates and Forecasts, by Application (2020-2032) (USD Billion)
9.3.2.10 Netherlands
9.3.2.10.1 Netherlands Factory Automation Sensor Market Estimates and Forecasts, by Sensor (2020-2032) (USD Billion)
9.3.2.10.2 Netherlands Factory Automation Sensor Market Estimates and Forecasts, by Application (2020-2032) (USD Billion)
9.3.2.11 Switzerland
9.3.2.11.1 Switzerland Factory Automation Sensor Market Estimates and Forecasts, by Sensor (2020-2032) (USD Billion)
9.3.2.11.2 Switzerland Factory Automation Sensor Market Estimates and Forecasts, by Application (2020-2032) (USD Billion)
9.3.2.12 Austria
9.3.2.12.1 Austria Factory Automation Sensor Market Estimates and Forecasts, by Sensor (2020-2032) (USD Billion)
9.3.2.12.2 Austria Factory Automation Sensor Market Estimates and Forecasts, by Application (2020-2032) (USD Billion)
9.3.2.13 Rest of Western Europe
9.3.2.13.1 Rest of Western Europe Factory Automation Sensor Market Estimates and Forecasts, by Sensor (2020-2032) (USD Billion)
9.3.2.13.2 Rest of Western Europe Factory Automation Sensor Market Estimates and Forecasts, by Application (2020-2032) (USD Billion)
9.4 Asia-Pacific
9.4.1 Trends Analysis
9.4.2 Asia-Pacific Factory Automation Sensor Market Estimates and Forecasts, by Country (2020-2032) (USD Billion)
9.4.3 Asia-Pacific Factory Automation Sensor Market Estimates and Forecasts, by Sensor (2020-2032) (USD Billion)
9.4.4 Asia-Pacific Factory Automation Sensor Market Estimates and Forecasts, by Application (2020-2032) (USD Billion)
9.4.5 China
9.4.5.1 China Factory Automation Sensor Market Estimates and Forecasts, by Sensor (2020-2032) (USD Billion)
9.4.5.2 China Factory Automation Sensor Market Estimates and Forecasts, by Application (2020-2032) (USD Billion)
9.4.6 India
9.4.5.1 India Factory Automation Sensor Market Estimates and Forecasts, by Sensor (2020-2032) (USD Billion)
9.4.5.2 India Factory Automation Sensor Market Estimates and Forecasts, by Application (2020-2032) (USD Billion)
9.4.5 Japan
9.4.5.1 Japan Factory Automation Sensor Market Estimates and Forecasts, by Sensor (2020-2032) (USD Billion)
9.4.5.2 Japan Factory Automation Sensor Market Estimates and Forecasts, by Application (2020-2032) (USD Billion)
9.4.6 South Korea
9.4.6.1 South Korea Factory Automation Sensor Market Estimates and Forecasts, by Sensor (2020-2032) (USD Billion)
9.4.6.2 South Korea Factory Automation Sensor Market Estimates and Forecasts, by Application (2020-2032) (USD Billion)
9.4.7 Vietnam
9.4.7.1 Vietnam Factory Automation Sensor Market Estimates and Forecasts, by Sensor (2020-2032) (USD Billion)
9.2.7.2 Vietnam Factory Automation Sensor Market Estimates and Forecasts, by Application (2020-2032) (USD Billion)
9.4.8 Singapore
9.4.8.1 Singapore Factory Automation Sensor Market Estimates and Forecasts, by Sensor (2020-2032) (USD Billion)
9.4.8.2 Singapore Factory Automation Sensor Market Estimates and Forecasts, by Application (2020-2032) (USD Billion)
9.4.9 Australia
9.4.9.1 Australia Factory Automation Sensor Market Estimates and Forecasts, by Sensor (2020-2032) (USD Billion)
9.4.9.2 Australia Factory Automation Sensor Market Estimates and Forecasts, by Application (2020-2032) (USD Billion)
9.4.10 Rest of Asia-Pacific
9.4.10.1 Rest of Asia-Pacific Factory Automation Sensor Market Estimates and Forecasts, by Sensor (2020-2032) (USD Billion)
9.4.10.2 Rest of Asia-Pacific Factory Automation Sensor Market Estimates and Forecasts, by Application (2020-2032) (USD Billion)
9.5 Middle East and Africa
9.5.1 Middle East
9.5.1.1 Trends Analysis
9.5.1.2 Middle East Factory Automation Sensor Market Estimates and Forecasts, by Country (2020-2032) (USD Billion)
9.5.1.3 Middle East Factory Automation Sensor Market Estimates and Forecasts, by Sensor (2020-2032) (USD Billion)
9.5.1.4 Middle East Factory Automation Sensor Market Estimates and Forecasts, by Application (2020-2032) (USD Billion)
9.5.1.5 UAE
9.5.1.5.1 UAE Factory Automation Sensor Market Estimates and Forecasts, by Sensor (2020-2032) (USD Billion)
9.5.1.5.2 UAE Factory Automation Sensor Market Estimates and Forecasts, by Application (2020-2032) (USD Billion)
9.5.1.6 Egypt
9.5.1.6.1 Egypt Factory Automation Sensor Market Estimates and Forecasts, by Sensor (2020-2032) (USD Billion)
9.5.1.6.2 Egypt Factory Automation Sensor Market Estimates and Forecasts, by Application (2020-2032) (USD Billion)
9.5.1.7 Saudi Arabia
9.5.1.7.1 Saudi Arabia Factory Automation Sensor Market Estimates and Forecasts, by Sensor (2020-2032) (USD Billion)
9.5.1.7.2 Saudi Arabia Factory Automation Sensor Market Estimates and Forecasts, by Application (2020-2032) (USD Billion)
9.5.1.8 Qatar
9.5.1.8.1 Qatar Factory Automation Sensor Market Estimates and Forecasts, by Sensor (2020-2032) (USD Billion)
9.5.1.8.2 Qatar Factory Automation Sensor Market Estimates and Forecasts, by Application (2020-2032) (USD Billion)
9.5.1.9 Rest of Middle East
9.5.1.9.1 Rest of Middle East Factory Automation Sensor Market Estimates and Forecasts, by Sensor (2020-2032) (USD Billion)
9.5.1.9.2 Rest of Middle East Factory Automation Sensor Market Estimates and Forecasts, by Application (2020-2032) (USD Billion)
9.5.2 Africa
9.5.2.1 Trends Analysis
9.5.2.2 Africa Factory Automation Sensor Market Estimates and Forecasts, by Country (2020-2032) (USD Billion)
9.5.2.3 Africa Factory Automation Sensor Market Estimates and Forecasts, by Sensor (2020-2032) (USD Billion)
9.5.2.4 Africa Factory Automation Sensor Market Estimates and Forecasts, by Application (2020-2032) (USD Billion)
9.5.2.5 South Africa
9.5.2.5.1 South Africa Factory Automation Sensor Market Estimates and Forecasts, by Sensor (2020-2032) (USD Billion)
9.5.2.5.2 South Africa Factory Automation Sensor Market Estimates and Forecasts, by Application (2020-2032) (USD Billion)
9.5.2.6 Nigeria
9.5.2.6.1 Nigeria Factory Automation Sensor Market Estimates and Forecasts, by Sensor (2020-2032) (USD Billion)
9.5.2.6.2 Nigeria Factory Automation Sensor Market Estimates and Forecasts, by Application (2020-2032) (USD Billion)
9.5.2.7 Rest of Africa
9.5.2.7.1 Rest of Africa Factory Automation Sensor Market Estimates and Forecasts, by Sensor (2020-2032) (USD Billion)
9.5.2.7.2 Rest of Africa Factory Automation Sensor Market Estimates and Forecasts, by Application (2020-2032) (USD Billion)
9.6 Latin America
9.6.1 Trends Analysis
9.6.2 Latin America Factory Automation Sensor Market Estimates and Forecasts, by Country (2020-2032) (USD Billion)
9.6.3 Latin America Factory Automation Sensor Market Estimates and Forecasts, by Sensor (2020-2032) (USD Billion)
9.6.4 Latin America Factory Automation Sensor Market Estimates and Forecasts, by Application (2020-2032) (USD Billion)
9.6.5 Brazil
9.6.5.1 Brazil Factory Automation Sensor Market Estimates and Forecasts, by Sensor (2020-2032) (USD Billion)
9.6.5.2 Brazil Factory Automation Sensor Market Estimates and Forecasts, by Application (2020-2032) (USD Billion)
9.6.6 Argentina
9.6.6.1 Argentina Factory Automation Sensor Market Estimates and Forecasts, by Sensor (2020-2032) (USD Billion)
9.6.6.2 Argentina Factory Automation Sensor Market Estimates and Forecasts, by Application (2020-2032) (USD Billion)
9.6.7 Colombia
9.6.7.1 Colombia Factory Automation Sensor Market Estimates and Forecasts, by Sensor (2020-2032) (USD Billion)
9.6.7.2 Colombia Factory Automation Sensor Market Estimates and Forecasts, by Application (2020-2032) (USD Billion)
9.6.8 Rest of Latin America
9.6.8.1 Rest of Latin America Factory Automation Sensor Market Estimates and Forecasts, by Sensor (2020-2032) (USD Billion)
9.6.8.2 Rest of Latin America Factory Automation Sensor Market Estimates and Forecasts, by Application (2020-2032) (USD Billion)
10. Company Profiles
10.1 SICK AG
10.1.1 Company Overview
10.1.2 Financial
10.1.3 Products/ Services Offered
10.1.4 SWOT Analysis
10.2 Siemens
10.2.1 Company Overview
10.2.2 Financial
10.2.3 Products/ Services Offered
10.2.4 SWOT Analysis
10.3 Omron
10.3.1 Company Overview
10.3.2 Financial
10.3.3 Products/ Services Offered
10.3.4 SWOT Analysis
10.4 Turck
10.4.1 Company Overview
10.4.2 Financial
10.4.3 Products/ Services Offered
10.4.4 SWOT Analysis
10.5 Rockwell Automation
10.5.1 Company Overview
10.5.2 Financial
10.5.3 Products/ Services Offered
10.5.4 SWOT Analysis
10.6 Balluff
10.6.1 Company Overview
10.6.2 Financial
10.6.3 Products/ Services Offered
10.6.4 SWOT Analysis
10.7 Schneider Electric
10.7.1 Company Overview
10.7.2 Financial
10.7.3 Products/ Services Offered
10.7.4 SWOT Analysis
10.8 Zenith Carburetors
10.8.1 Company Overview
10.8.2 Financial
10.8.3 Products/ Services Offered
10.8.4 SWOT Analysis
10.9 ABB
10.9.1 Company Overview
10.9.2 Financial
10.9.3 Products/ Services Offered
10.9.4 SWOT Analysis
10.10 Keyence
10.10.1 Company Overview
10.10.2 Financial
10.10.3 Products/ Services Offered
10.10.4 SWOT Analysis
11. Use Cases and Best Practices
12. Conclusion
An accurate research report requires proper strategizing as well as implementation. There are multiple factors involved in the completion of good and accurate research report and selecting the best methodology to compete the research is the toughest part. Since the research reports we provide play a crucial role in any company’s decision-making process, therefore we at SNS Insider always believe that we should choose the best method which gives us results closer to reality. This allows us to reach at a stage wherein we can provide our clients best and accurate investment to output ratio.
Each report that we prepare takes a timeframe of 350-400 business hours for production. Starting from the selection of titles through a couple of in-depth brain storming session to the final QC process before uploading our titles on our website we dedicate around 350 working hours. The titles are selected based on their current market cap and the foreseen CAGR and growth.
The 5 steps process:
Step 1: Secondary Research:
Secondary Research or Desk Research is as the name suggests is a research process wherein, we collect data through the readily available information. In this process we use various paid and unpaid databases which our team has access to and gather data through the same. This includes examining of listed companies’ annual reports, Journals, SEC filling etc. Apart from this our team has access to various associations across the globe across different industries. Lastly, we have exchange relationships with various university as well as individual libraries.
Step 2: Primary Research
When we talk about primary research, it is a type of study in which the researchers collect relevant data samples directly, rather than relying on previously collected data. This type of research is focused on gaining content specific facts that can be sued to solve specific problems. Since the collected data is fresh and first hand therefore it makes the study more accurate and genuine.
We at SNS Insider have divided Primary Research into 2 parts.
Part 1 wherein we interview the KOLs of major players as well as the upcoming ones across various geographic regions. This allows us to have their view over the market scenario and acts as an important tool to come closer to the accurate market numbers. As many as 45 paid and unpaid primary interviews are taken from both the demand and supply side of the industry to make sure we land at an accurate judgement and analysis of the market.
This step involves the triangulation of data wherein our team analyses the interview transcripts, online survey responses and observation of on filed participants. The below mentioned chart should give a better understanding of the part 1 of the primary interview.
Part 2: In this part of primary research the data collected via secondary research and the part 1 of the primary research is validated with the interviews from individual consultants and subject matter experts.
Consultants are those set of people who have at least 12 years of experience and expertise within the industry whereas Subject Matter Experts are those with at least 15 years of experience behind their back within the same space. The data with the help of two main processes i.e., FGDs (Focused Group Discussions) and IDs (Individual Discussions). This gives us a 3rd party nonbiased primary view of the market scenario making it a more dependable one while collation of the data pointers.
Step 3: Data Bank Validation
Once all the information is collected via primary and secondary sources, we run that information for data validation. At our intelligence centre our research heads track a lot of information related to the market which includes the quarterly reports, the daily stock prices, and other relevant information. Our data bank server gets updated every fortnight and that is how the information which we collected using our primary and secondary information is revalidated in real time.
Step 4: QA/QC Process
After all the data collection and validation our team does a final level of quality check and quality assurance to get rid of any unwanted or undesired mistakes. This might include but not limited to getting rid of the any typos, duplication of numbers or missing of any important information. The people involved in this process include technical content writers, research heads and graphics people. Once this process is completed the title gets uploader on our platform for our clients to read it.
Step 5: Final QC/QA Process:
This is the last process and comes when the client has ordered the study. In this process a final QA/QC is done before the study is emailed to the client. Since we believe in giving our clients a good experience of our research studies, therefore, to make sure that we do not lack at our end in any way humanly possible we do a final round of quality check and then dispatch the study to the client.
Key Segments:
By Sensor Type
Temperature sensors
Vibration sensors
Humidity sensors
Proximity sensors
Pressure sensors
Vision sensors
Others
By Application
Manufacturing
Automotive
Chemicals
Energy & power
Food & beverages
Oil & gas
Aerospace and defense
Pharmaceuticals
Automotive
Others
Request for Segment Customization as per your Business Requirement: Segment Customization Request
REGIONAL COVERAGE:
North America
US
Canada
Mexico
Europe
Eastern Europe
Poland
Romania
Hungary
Turkey
Rest of Eastern Europe
Western Europe
Germany
France
UK
Italy
Spain
Netherlands
Switzerland
Austria
Rest of Western Europe
Asia-Pacific
China
India
Japan
South Korea
Vietnam
Singapore
Australia
Rest of Asia Pacific
Middle East & Africa
Middle East
UAE
Egypt
Saudi Arabia
Qatar
Rest of the Middle East
Africa
Nigeria
South Africa
Rest of Africa
Latin America
Brazil
Argentina
Colombia
Rest of Latin America
Request for Country Level Research Report: Country Level Customization Request
Available Customization
With the given market data, SNS Insider offers customization as per the company’s specific needs. The following customization options are available for the report:
Product Analysis
Criss-Cross segment analysis (e.g. Product X Application)
Product Matrix which gives a detailed comparison of the product portfolio of each company
Geographic Analysis
Additional countries in any of the regions
Company Information
Detailed analysis and profiling of additional market players (Up to five)
The Fiber Optical Cable Market size was valued at USD 14.64 billion in 2023. It is expected to reach USD 43.99 billion by 2032 and grow at a CAGR of 13.00% over the forecast period 2024-2032.
The Grow Lights Market Size was valued at USD 4.30 billion in 2023 and is expecting to grow at a CAGR of 16.37% to reach USD 16.38 billion by 2032.
The Electronic Toll Collection Market Size was valued at USD 9.33 billion in 2023, is expected to grow at 8.34% CAGR to reach USD 19.17 billion by 2032.
The Wafer Process Control Equipment Market Size was valued at USD 7.93 billion in 2023 and is estimated to reach USD 14.06 billion by 2032 and grow at a CAGR of 6.52% over the forecast period 2024-2032.
The Photonics Market size was USD 910.70 billion in 2023 to USD 1642.58 billion by 2032 and grow at a CAGR of 6.83% over the forecast period of 2024-2032.
The Construction Robotics Market Size was valued at USD 183.5 billion in 2023 and is expected to grow at 16.99% CAGR to reach USD 749.85 billion by 2032.
Hi! Click one of our member below to chat on Phone