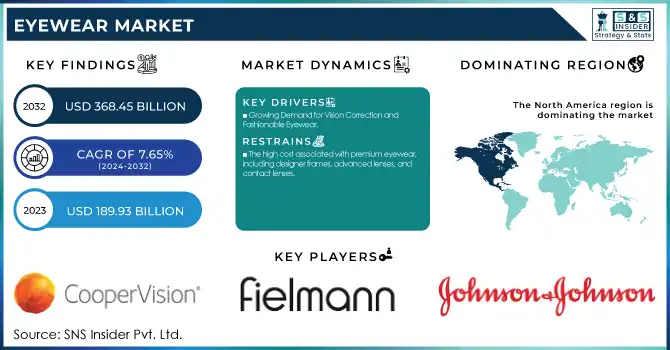
The Eyewear Market size was valued at USD 189.93 billion in 2023 and is projected to reach USD 368.45 billion by 2032 with a growing CAGR of 7.65% over the forecast period of 2024-2032.
To Get More Information on Eyewear Market - Request Sample Report
This report analyzes the increasing prevalence and occurrence of vision-related problems, underpinning the increased demand for eyewear products in different parts of the world. The research looks into trends in prescriptions, citing the movement towards customized and high-tech eyewear solutions, including prescription sunglasses and blue light-filtering lenses. It also examines regional eyewear trends, observing different consumer needs influenced by cultural variations, lifestyle, and economic status. The report also examines healthcare expenditure on eye care services and the rising consumer trend of frequent eye check-ups, which affects the eyewear industry. Consumer behavior patterns indicate a significant trend toward online shopping, with e-commerce websites affecting buying behavior. In addition, it examines consumer expenditure on eye care services, showing an increased emphasis on preventive eye care and corrective measures.
Drivers
Growing Demand for Vision Correction and Fashionable Eyewear
The eyewear market is being substantially fueled by the growing worldwide incidence of vision disorders, including myopia, hyperopia, and presbyopia. The World Health Organization (WHO) states that more than 2.7 billion people globally have uncorrected poor eyesight, and this is driving demand for corrective eyewear, particularly prescription glasses and contact lenses. Apart from vision correction, eyewear has evolved as a fashion accessory, and consumers seek stylish frames and lenses. The transition towards digitalization, with increased screen time, also results in a greater prevalence of digital eye strain, which creates an additional demand for specialty eyewear like blue light-blocking glasses. Advances in lens technology, including photochromic lenses and high-performance coatings, also drive the growing popularity of eyewear. In addition, the emerging online eyewear retailers Warby Parker and Zenni Optical are also making eyewear more affordable and accessible, further fueling market growth. The growing use of smart eyewear like augmented reality glasses is also generating increased demand as technology-oriented consumers increasingly demand multifunctional products.
Restraints
The high cost associated with premium eyewear, including designer frames, advanced lenses, and contact lenses.
Luxury sunglasses can be unbearably high-priced for most consumers, especially in poor areas. For instance, designer sunglasses may run into several hundred dollars, and prescription lenses with sophisticated features can hike the overall price. In most developing countries, low access to vision care products and sunglasses continues to be a major problem. WHO statistics indicate that most of the world's population lacks access to proper eye care, with millions of individuals in developing nations lacking access to corrective eyewear as a result of economic or geographical constraints. On top of this, low awareness of the need for periodic eye exams and vision correction among populations in these regions further aggravates the situation. These elements constrain the potential of the market, particularly in poverty-stricken areas and poor healthcare systems.
Opportunities
The expansion of e-commerce and the integration of cutting-edge technologies.
Online eyeglasses shopping platforms, like Warby Parker and Eyebuydirect, have seen huge success, taking advantage of customer preference for convenience and value. The convenience of trying on eyeglasses virtually with the use of augmented reality (AR) technology is making the online shopping process more appealing and increasing sales. The worldwide market for online glasses is predicted to develop at a high growth rate, presenting brands with a massive opportunity to appeal to more customers. A promising prospect is the area of tech innovation like intelligent eyewear and wearable technology, where brands such as the Apple Glasses and Bose Frames bring novel features such as augmented reality and audio into their offerings. This increasing trend for multifunctional glasses is likely to appeal to technology-aware consumers and provide opportunities for companies to expand their product offerings. Further, the increasing focus on sustainable glasses, with the use of environmentally friendly materials like biodegradable frames and recycled lenses, offers an opportunity for companies to target the eco-friendly consumer base.
Challenges
The rise of counterfeit products, which undermines brand integrity and consumer trust.
Counterfeit spectacles, particularly high-end brands, are easily found in the market, and the OECD states that international trade in counterfeit products is valued at USD 509 billion yearly, with industries such as spectacles being vulnerable. Not only are these counterfeit products a danger to the safety of consumers, but they also deprive original brands of revenues. The spectacles industry is also greatly threatened by supply chain disruptions. The world eyewear industry is highly reliant on materials such as high-quality lenses and high-end frames, which are imported from all over the world. The COVID-19 pandemic laid bare weaknesses in global supply chains, leading to delays, higher production costs, and shortages of raw materials. Shipping bottlenecks, tariffs, and transport issues add to the complexity, particularly for firms that depend on foreign suppliers. These interruptions will cause delays in the launch of new products and affect the availability of glasses, thus harming customer satisfaction and growth in the marketplace in the short run.
By Product
In 2023, Prescription (RX) Glasses dominated the eyewear market, capturing more than 70.4% of the revenue share. The major dominance stems from the overall rise in worldwide cases of vision problems like myopia, hyperopia, and presbyopia, notably among aging populations and young people who spend more time on screens. Prescription glasses are also part of everyday use, hence a first selection for those looking for vision correction. Their popularity among every segment of workers and students helps them maintain market leadership. The strong demand for individualized and trendy RX glasses coupled with technological enhancements in lenses powers the growth in this segment even further.
Though Sunglasses had a relatively smaller market size in 2023, the fastest growth rate is expected from it in the future years. With rising consciousness about UV protection and eye health, people tend to invest more in premium quality sunglasses offering fashion as well as protection from evil UV rays. In addition, the growing demand for sports and outdoor activity sunglasses, traveling, and other sporting activities is boosting demand for trendy and practical sunglasses. Environmentally friendly and sustainable sunglasses are also growing the segment's increasing market size.
By Distribution Channel
In 2023, the Brick & Mortar segment maintained the largest revenue share due to established opticians, retail chains, and physical stores of eyewear brands. Even with the growth of e-commerce, brick-and-mortar stores continue to play a crucial role in the eyewear market, providing in-person fitting and personalized consultations. Consumers appreciate the ability to try frames, get instant help, and browse a wide selection in-store. Also, optical clinics and eye care professionals still have their presence in physical offices, thus making physical stores important for prescription eyewear sales.
The E-Commerce channel is well-positioned to experience tremendous growth and will be the fastest-growing segment between 2024 and 2032. The trend towards online shopping, particularly after the COVID-19 pandemic, has had a profound influence on the eyewear industry. Eyewear is increasingly being bought online as consumers take advantage of the convenience, virtual try-on features, and competitive prices provided by online stores. Direct-to-consumer (D2C) brands and online prescription eyewear services are gaining more customers, especially among younger age groups who feel more at ease shopping online. Better customer service, hassle-free returns, and doorstep delivery are adding further momentum to e-commerce in the eyewear segment.
By End-Use
In 2023, the Female segment accounted for the largest revenue share in the eyewear market due to the strong demand for both fashion and functional eyewear. Women tend to buy more than one pair of eyewear, ranging from prescription glasses to fashionable sunglasses. The increasing value of eyewear as a fashion statement, as well as the increasing emphasis on eye care, has resulted in greater variety and more fashionable designs in the market, driving the demand for women-specific eyewear. Women also give more importance to aesthetics, comfort, and quality while choosing eyewear, which further propels their market share.
The Kids segment will see the highest growth between 2024 and 2032. The rising awareness of the health of children's eyes and the growing incidence of myopia in younger age groups are fueling the demand for prescription eyewear for children. With the innovations in lens technology, including lighter and more resilient materials, children's eyewear has become more convenient and practical. In addition, increased demand for trendy children's eyewear, as well as efforts to treat vision issues early, is driving the swift expansion of this segment. As parents are increasingly taking preventive measures regarding children's eyes, the demand for trendy and low-cost kids' eyewear will grow.
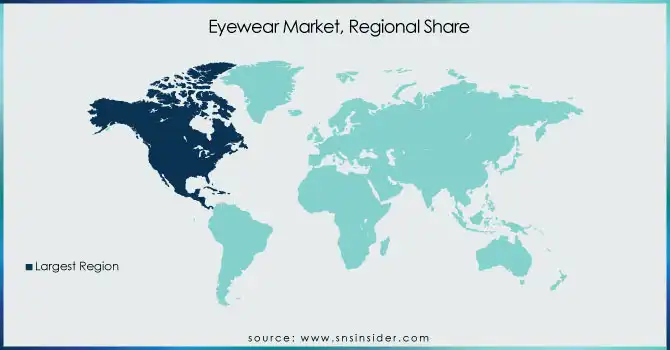
North America was the largest segment of the global eyewear market, with the U.S. contributing a major portion of the regional revenue. The region is fueled by a very high incidence of vision correction requirements, an aging population, and a strong demand for both functional and stylish spectacles. The rising use of technological advancements like smart spectacles and digital lenses also drives the market forward. Moreover, the increased popularity of internet-based eyewear stores and the convenience of using virtual try-on technologies are transforming the eyewear retail environment. The focus of the region on innovation, with companies consistently providing personalized and technology-integrated eyewear, is an important factor in maintaining market growth. In addition, the strong healthcare infrastructure and consciousness regarding eye care ensure a consistent demand for prescription eyewear and contact lenses.
Asia-Pacific, however, is projected to experience the highest growth in the eyewear market during the forecast period. This is because the growing middle-class population, disposable incomes, and improving living standards in major countries like China and India are increasing at a fast rate. Furthermore, the prevalence of myopia is very high in nations in the region, further adding to the increasing demand for correcting eyewear. The use of online shopping for eyewear is also on the rise, with various e-commerce websites providing cost-effective eyewear options. Additionally, the young, technologically advanced population of the region is adopting trendy eyewear styles, thus fueling demand for prescription glasses as well as sunglasses. With urbanization still on the rise, the Asia-Pacific eyewear market is poised to grow exponentially, with more emphasis on innovation as well as affordability.
Do You Need any Customization Research on Eyewear Market - Enquire Now
Key Players
Bausch + Lomb Corporation – Contact Lenses, Prescription Glasses
Zeiss Group – Eyeglass Lenses, Prescription Glasses
CHARMANT INC. – Eyeglass Frames, Sunglasses
CHEMIGLAS CORPORATION – Contact Lenses
CIBA Vision (Alcon) – Contact Lenses, Lens Care Products
CooperVision Limited – Contact Lenses
De Rigo Vision S.p.A. – Eyeglass Frames, Sunglasses
ESSILORLUXOTTICA – Eyeglass Lenses, Prescription Glasses, Sunglasses, Contact Lenses
Fielmann AG – Eyeglass Frames, Prescription Glasses
HOYA Corporation – Eyeglass Lenses
JINS Inc. – Eyeglass Frames, Prescription Glasses
Johnson & Johnson Vision Care Inc. – Contact Lenses
Marchon Eyewear Inc. – Eyeglass Frames, Sunglasses
Marcolin S.p.A. – Eyeglass Frames, Sunglasses
Prada S.p.A – Eyeglass Frames, Sunglasses
Rodenstock GmbH – Eyeglass Frames, Eyeglass Lenses
Safilo Group S.p.A – Eyeglass Frames, Sunglasses
Seiko Optical Products Co. Ltd. – Eyeglass Lenses
Shamir Optical Industry Ltd. – Eyeglass Lenses
Silhouette International Schmied AG – Eyeglass Frames
Warby Parker – Eyeglass Frames, Prescription Glasses, Sunglasses
Zenni Optical Inc. – Eyeglass Frames, Prescription Glasses
Recent Developments
In Feb 2025, Lapo Srl, a prominent eyewear lens manufacturer, collaborated with Trinseo, a leader in sustainable materials, to create high-quality demonstration lenses made from recycled polymethyl methacrylate (PMMA). These lenses feature at least 86% recycled content, marking a major advancement in sustainability within the eyewear sector.
In Feb 2025, Trinseo partnered to create chemically recycled PMMA eyewear lenses, which will be showcased for demonstration purposes. This initiative aims to help buyers visualize how the recycled lenses appear when worn.
In Jan 2025, Lenskart launched its Phonic audio eyewear, designed to be compatible with both Android and iOS devices. The smart eyewear features a convenient button navigation system that allows users to easily switch between various functions.
Report Attributes | Details |
Market Size in 2023 | USD 189.93 billion |
Market Size by 2032 | USD 368.45 billion |
CAGR | CAGR of 7.65% From 2024 to 2032 |
Base Year | 2023 |
Forecast Period | 2024-2032 |
Historical Data | 2020-2022 |
Report Scope & Coverage | Market Size, Segments Analysis, Competitive Landscape, Regional Analysis, DROC & SWOT Analysis, Forecast Outlook |
Key Segments | • By Product [Contact Lenses (Premium Contact Lenses, Mass Contact Lenses), Prescription (RX) Glasses (Prescription Glasses, by Frame, Prescription Glasses, by Lens), Sunglasses (Sunglasses, by Frame, Sunglasses, by Lens)] • By Distribution Channel [E-Commerce, Brick & Mortar] • By End-Use [Male, Female, Unisex, Kids] |
Regional Analysis/Coverage | North America (US, Canada, Mexico), Europe (Eastern Europe [Poland, Romania, Hungary, Turkey, Rest of Eastern Europe] Western Europe] Germany, France, UK, Italy, Spain, Netherlands, Switzerland, Austria, Rest of Western Europe]), Asia Pacific (China, India, Japan, South Korea, Vietnam, Singapore, Australia, Rest of Asia Pacific), Middle East & Africa (Middle East [UAE, Egypt, Saudi Arabia, Qatar, Rest of Middle East], Africa [Nigeria, South Africa, Rest of Africa], Latin America (Brazil, Argentina, Colombia, Rest of Latin America) |
Company Profiles | Bausch + Lomb Corporation, Zeiss Group, CHARMANT INC., CHEMIGLAS CORPORATION, CIBA Vision (Alcon), CooperVision Limited, De Rigo Vision S.p.A., ESSILORLUXOTTICA, Fielmann AG, HOYA Corporation, JINS Inc., Johnson & Johnson Vision Care Inc., Marchon Eyewear Inc., Marcolin S.p.A., Prada S.p.A, Rodenstock GmbH, Safilo Group S.p.A, Seiko Optical Products Co. Ltd., Shamir Optical Industry Ltd., Silhouette International Schmied AG, Warby Parker, Zenni Optical Inc. |
Ans: The Eyewear Market is expected to grow at a CAGR of 7.65%.
Ans: The Eyewear Market size was USD 189.93 billion in 2023.
Ans: The rise in the demand of eyewear in sports
Ans: The availability of the refurbished and low-quality products which might affect the customers eyesight.
Ans: North American region is dominating the market
1. Introduction
1.1 Market Definition
1.2 Scope (Inclusion and Exclusions)
1.3 Research & Academic Institutes Assumptions
2. Executive Summary
2.1 Market Overview
2.2 Regional Synopsis
2.3 Competitive Summary
3. Research & Academic Institutes Methodology
3.1 Top-Down Approach
3.2 Bottom-up Approach
3.3. Data Validation
3.4 Primary Interviews
4. Market Dynamics Impact Analysis
4.1 Market Driving Factors Analysis
4.1.1 Drivers
4.1.2 Restraints
4.1.3 Opportunities
4.1.4 Challenges
4.2 PESTLE Analysis
4.3 Porter’s Five Forces Model
5. Statistical Insights and Trends Reporting
5.1 Incidence and Prevalence (2023)
5.2 Prescription Trends (2023)
5.3 Eyewear Trends by Region (2023)
5.4 Consumer Behavior Trends
5.5 Consumer Spending on Eye Care Services
6. Competitive Landscape
6.1 List of Major Companies, By Region
6.2 Market Share Analysis, By Region
6.3 Product Benchmarking
6.3.1 Product specifications and features
6.3.2 Pricing
6.4 Strategic Initiatives
6.4.1 Marketing and Promotional Activities
6.4.2 Distribution and Supply Chain Strategies
6.4.3 Expansion plans and new Product launches
6.4.4 Strategic partnerships and collaborations
6.5 Technological Advancements
6.6 Market Positioning and Branding
7. Eyewear Market Segmentation, by Product
7.1 Chapter Overview
7.2 Contact Lenses
7.2.1 Contact Lenses Market Trends Analysis (2020-2032)
7.2.2 Contact Lenses Market Size Estimates and Forecasts to 2032 (USD Billion)
7.2.3 Premium Contact Lenses
7.2.3.1 Premium Contact Lenses Market Trends Analysis (2020-2032)
7.2.3.2 Premium Contact Lenses Market Size Estimates and Forecasts to 2032 (USD Billion)
7.2.4 Mass Contact Lenses
7.2.4.1 Mass Contact Lenses Market Trends Analysis (2020-2032)
7.2.4.2 Mass Contact Lenses Market Size Estimates and Forecasts to 2032 (USD Billion)
7.3 Prescription (RX) Glasses
7.3.1 Prescription (RX) Glasses Market Trends Analysis (2020-2032)
7.3.2 Prescription (RX) Glasses Market Size Estimates and Forecasts to 2032 (USD Billion)
7.3.3 Prescription Glasses, by Frame
7.3.3.1 Prescription Glasses, by Frame Market Trends Analysis (2020-2032)
7.3.3.2 Prescription Glasses, by Frame Market Size Estimates and Forecasts to 2032 (USD Billion)
7.3.4 Prescription Glasses, by Lens
7.3.4.1 Prescription Glasses, by Lens Market Trends Analysis (2020-2032)
7.3.4.2 Prescription Glasses, by Lens Market Size Estimates and Forecasts to 2032 (USD Billion)
7.4 Sunglasses
7.4.1 Sunglasses Market Trends Analysis (2020-2032)
7.4.2 Sunglasses Market Size Estimates and Forecasts to 2032 (USD Billion)
7.4.3 Sunglasses, by Frame
7.4.3.1 Sunglasses, by Frame Market Trends Analysis (2020-2032)
7.4.3.2 Sunglasses, by Frame Market Size Estimates and Forecasts to 2032 (USD Billion)
7.4.4 Sunglasses, by Lens
7.4.4.1 Sunglasses, by Lens Market Trends Analysis (2020-2032)
7.4.4.2 Sunglasses, by Lens Market Size Estimates and Forecasts to 2032 (USD Billion)
8. Eyewear Market Segmentation, by Distribution Channel
8.1 Chapter Overview
8.2 E-Commerce
8.2.1 E-Commerce Market Trends Analysis (2020-2032)
8.2.2 E-Commerce Market Size Estimates and Forecasts to 2032 (USD Billion)
8.3 Brick & Mortar
8.3.1 Brick & Mortar Market Trends Analysis (2020-2032)
8.3.2 Brick & Mortar Market Size Estimates and Forecasts to 2032 (USD Billion)
9. Eyewear Market Segmentation, by End-Use
9.1 Chapter Overview
9.2 Male
9.2.1 Male Market Trends Analysis (2020-2032)
9.2.2 Male Market Size Estimates and Forecasts to 2032 (USD Billion)
9.3 Female
9.3.1 Female Market Trends Analysis (2020-2032)
9.3.2 Female Market Size Estimates and Forecasts to 2032 (USD Billion)
9.4 Unisex
9.4.1 Unisex Market Trends Analysis (2020-2032)
9.4.2 Unisex Market Size Estimates and Forecasts to 2032 (USD Billion)
9.5 Kids
9.5.1 Kids Market Trends Analysis (2020-2032)
9.5.2 Kids Market Size Estimates and Forecasts to 2032 (USD Billion)
10. Regional Analysis
10.1 Chapter Overview
10.2 North America
10.2.1 Trends Analysis
10.2.2 North America Eyewear Market Estimates and Forecasts, by Country (2020-2032) (USD Billion)
10.2.3 North America Eyewear Market Estimates and Forecasts, by Product (2020-2032) (USD Billion)
10.2.4 North America Eyewear Market Estimates and Forecasts, by Distribution Channel (2020-2032) (USD Billion)
10.2.5 North America Eyewear Market Estimates and Forecasts, by End-Use (2020-2032) (USD Billion)
10.2.6 USA
10.2.6.1 USA Eyewear Market Estimates and Forecasts, by Product (2020-2032) (USD Billion)
10.2.6.2 USA Eyewear Market Estimates and Forecasts, by Distribution Channel (2020-2032) (USD Billion)
10.2.6.3 USA Eyewear Market Estimates and Forecasts, by End-Use (2020-2032) (USD Billion)
10.2.7 Canada
10.2.7.1 Canada Eyewear Market Estimates and Forecasts, by Product (2020-2032) (USD Billion)
10.2.7.2 Canada Eyewear Market Estimates and Forecasts, by Distribution Channel (2020-2032) (USD Billion)
10.2.7.3 Canada Eyewear Market Estimates and Forecasts, by End-Use (2020-2032) (USD Billion)
10.2.8 Mexico
10.2.8.1 Mexico Eyewear Market Estimates and Forecasts, by Product (2020-2032) (USD Billion)
10.2.8.2 Mexico Eyewear Market Estimates and Forecasts, by Distribution Channel (2020-2032) (USD Billion)
10.2.8.3 Mexico Eyewear Market Estimates and Forecasts, by End-Use (2020-2032) (USD Billion)
10.3 Europe
10.3.1 Eastern Europe
10.3.1.1 Trends Analysis
10.3.1.2 Eastern Europe Eyewear Market Estimates and Forecasts, by Country (2020-2032) (USD Billion)
10.3.1.3 Eastern Europe Eyewear Market Estimates and Forecasts, by Product (2020-2032) (USD Billion)
10.3.1.4 Eastern Europe Eyewear Market Estimates and Forecasts, by Distribution Channel (2020-2032) (USD Billion)
10.3.1.5 Eastern Europe Eyewear Market Estimates and Forecasts, by End-Use (2020-2032) (USD Billion)
10.3.1.6 Poland
10.3.1.6.1 Poland Eyewear Market Estimates and Forecasts, by Product (2020-2032) (USD Billion)
10.3.1.6.2 Poland Eyewear Market Estimates and Forecasts, by Distribution Channel (2020-2032) (USD Billion)
10.3.1.6.3 Poland Eyewear Market Estimates and Forecasts, by End-Use (2020-2032) (USD Billion)
10.3.1.7 Romania
10.3.1.7.1 Romania Eyewear Market Estimates and Forecasts, by Product (2020-2032) (USD Billion)
10.3.1.7.2 Romania Eyewear Market Estimates and Forecasts, by Distribution Channel (2020-2032) (USD Billion)
10.3.1.7.3 Romania Eyewear Market Estimates and Forecasts, by End-Use (2020-2032) (USD Billion)
10.3.1.8 Hungary
10.3.1.8.1 Hungary Eyewear Market Estimates and Forecasts, by Product (2020-2032) (USD Billion)
10.3.1.8.2 Hungary Eyewear Market Estimates and Forecasts, by Distribution Channel (2020-2032) (USD Billion)
10.3.1.8.3 Hungary Eyewear Market Estimates and Forecasts, by End-Use (2020-2032) (USD Billion)
10.3.1.9 turkey
10.3.1.9.1 Turkey Eyewear Market Estimates and Forecasts, by Product (2020-2032) (USD Billion)
10.3.1.9.2 Turkey Eyewear Market Estimates and Forecasts, by Distribution Channel (2020-2032) (USD Billion)
10.3.1.9.3 Turkey Eyewear Market Estimates and Forecasts, by End-Use (2020-2032) (USD Billion)
10.3.1.10 Rest of Eastern Europe
10.3.1.10.1 Rest of Eastern Europe Eyewear Market Estimates and Forecasts, by Product (2020-2032) (USD Billion)
10.3.1.10.2 Rest of Eastern Europe Eyewear Market Estimates and Forecasts, by Distribution Channel (2020-2032) (USD Billion)
10.3.1.10.3 Rest of Eastern Europe Eyewear Market Estimates and Forecasts, by End-Use (2020-2032) (USD Billion)
10.3.2 Western Europe
10.3.2.1 Trends Analysis
10.3.2.2 Western Europe Eyewear Market Estimates and Forecasts, by Country (2020-2032) (USD Billion)
10.3.2.3 Western Europe Eyewear Market Estimates and Forecasts, by Product (2020-2032) (USD Billion)
10.3.2.4 Western Europe Eyewear Market Estimates and Forecasts, by Distribution Channel (2020-2032) (USD Billion)
10.3.2.5 Western Europe Eyewear Market Estimates and Forecasts, by End-Use (2020-2032) (USD Billion)
10.3.2.6 Germany
10.3.2.6.1 Germany Eyewear Market Estimates and Forecasts, by Product (2020-2032) (USD Billion)
10.3.2.6.2 Germany Eyewear Market Estimates and Forecasts, by Distribution Channel (2020-2032) (USD Billion)
10.3.2.6.3 Germany Eyewear Market Estimates and Forecasts, by End-Use (2020-2032) (USD Billion)
10.3.2.7 France
10.3.2.7.1 France Eyewear Market Estimates and Forecasts, by Product (2020-2032) (USD Billion)
10.3.2.7.2 France Eyewear Market Estimates and Forecasts, by Distribution Channel (2020-2032) (USD Billion)
10.3.2.7.3 France Eyewear Market Estimates and Forecasts, by End-Use (2020-2032) (USD Billion)
10.3.2.8 UK
10.3.2.8.1 UK Eyewear Market Estimates and Forecasts, by Product (2020-2032) (USD Billion)
10.3.2.8.2 UK Eyewear Market Estimates and Forecasts, by Distribution Channel (2020-2032) (USD Billion)
10.3.2.8.3 UK Eyewear Market Estimates and Forecasts, by End-Use (2020-2032) (USD Billion)
10.3.2.9 Italy
10.3.2.9.1 Italy Eyewear Market Estimates and Forecasts, by Product (2020-2032) (USD Billion)
10.3.2.9.2 Italy Eyewear Market Estimates and Forecasts, by Distribution Channel (2020-2032) (USD Billion)
10.3.2.9.3 Italy Eyewear Market Estimates and Forecasts, by End-Use (2020-2032) (USD Billion)
10.3.2.10 Spain
10.3.2.10.1 Spain Eyewear Market Estimates and Forecasts, by Product (2020-2032) (USD Billion)
10.3.2.10.2 Spain Eyewear Market Estimates and Forecasts, by Distribution Channel (2020-2032) (USD Billion)
10.3.2.10.3 Spain Eyewear Market Estimates and Forecasts, by End-Use (2020-2032) (USD Billion)
10.3.2.11 Netherlands
10.3.2.11.1 Netherlands Eyewear Market Estimates and Forecasts, by Product (2020-2032) (USD Billion)
10.3.2.11.2 Netherlands Eyewear Market Estimates and Forecasts, by Distribution Channel (2020-2032) (USD Billion)
10.3.2.11.3 Netherlands Eyewear Market Estimates and Forecasts, by End-Use (2020-2032) (USD Billion)
10.3.2.12 Switzerland
10.3.2.12.1 Switzerland Eyewear Market Estimates and Forecasts, by Product (2020-2032) (USD Billion)
10.3.2.12.2 Switzerland Eyewear Market Estimates and Forecasts, by Distribution Channel (2020-2032) (USD Billion)
10.3.2.12.3 Switzerland Eyewear Market Estimates and Forecasts, by End-Use (2020-2032) (USD Billion)
10.3.2.13 Austria
10.3.2.13.1 Austria Eyewear Market Estimates and Forecasts, by Product (2020-2032) (USD Billion)
10.3.2.13.2 Austria Eyewear Market Estimates and Forecasts, by Distribution Channel (2020-2032) (USD Billion)
10.3.2.13.3 Austria Eyewear Market Estimates and Forecasts, by End-Use (2020-2032) (USD Billion)
10.3.2.14 Rest of Western Europe
10.3.2.14.1 Rest of Western Europe Eyewear Market Estimates and Forecasts, by Product (2020-2032) (USD Billion)
10.3.2.14.2 Rest of Western Europe Eyewear Market Estimates and Forecasts, by Distribution Channel (2020-2032) (USD Billion)
10.3.2.14.3 Rest of Western Europe Eyewear Market Estimates and Forecasts, by End-Use (2020-2032) (USD Billion)
10.4 Asia Pacific
10.4.1 Trends Analysis
10.4.2 Asia Pacific Eyewear Market Estimates and Forecasts, by Country (2020-2032) (USD Billion)
10.4.3 Asia Pacific Eyewear Market Estimates and Forecasts, by Product (2020-2032) (USD Billion)
10.4.4 Asia Pacific Eyewear Market Estimates and Forecasts, by Distribution Channel (2020-2032) (USD Billion)
10.4.5 Asia Pacific Eyewear Market Estimates and Forecasts, by End-Use (2020-2032) (USD Billion)
10.4.6 China
10.4.6.1 China Eyewear Market Estimates and Forecasts, by Product (2020-2032) (USD Billion)
10.4.6.2 China Eyewear Market Estimates and Forecasts, by Distribution Channel (2020-2032) (USD Billion)
10.4.6.3 China Eyewear Market Estimates and Forecasts, by End-Use (2020-2032) (USD Billion)
10.4.7 India
10.4.7.1 India Eyewear Market Estimates and Forecasts, by Product (2020-2032) (USD Billion)
10.4.7.2 India Eyewear Market Estimates and Forecasts, by Distribution Channel (2020-2032) (USD Billion)
10.4.7.3 India Eyewear Market Estimates and Forecasts, by End-Use (2020-2032) (USD Billion)
10.4.8 Japan
10.4.8.1 Japan Eyewear Market Estimates and Forecasts, by Product (2020-2032) (USD Billion)
10.4.8.2 Japan Eyewear Market Estimates and Forecasts, by Distribution Channel (2020-2032) (USD Billion)
10.4.8.3 Japan Eyewear Market Estimates and Forecasts, by End-Use (2020-2032) (USD Billion)
10.4.9 South Korea
10.4.9.1 South Korea Eyewear Market Estimates and Forecasts, by Product (2020-2032) (USD Billion)
10.4.9.2 South Korea Eyewear Market Estimates and Forecasts, by Distribution Channel (2020-2032) (USD Billion)
10.4.9.3 South Korea Eyewear Market Estimates and Forecasts, by End-Use (2020-2032) (USD Billion)
10.4.10 Vietnam
10.4.10.1 Vietnam Eyewear Market Estimates and Forecasts, by Product (2020-2032) (USD Billion)
10.4.10.2 Vietnam Eyewear Market Estimates and Forecasts, by Distribution Channel (2020-2032) (USD Billion)
10.4.10.3 Vietnam Eyewear Market Estimates and Forecasts, by End-Use (2020-2032) (USD Billion)
10.4.11 Singapore
10.4.11.1 Singapore Eyewear Market Estimates and Forecasts, by Product (2020-2032) (USD Billion)
10.4.11.2 Singapore Eyewear Market Estimates and Forecasts, by Distribution Channel (2020-2032) (USD Billion)
10.4.11.3 Singapore Eyewear Market Estimates and Forecasts, by End-Use (2020-2032) (USD Billion)
10.4.12 Australia
10.4.12.1 Australia Eyewear Market Estimates and Forecasts, by Product (2020-2032) (USD Billion)
10.4.12.2 Australia Eyewear Market Estimates and Forecasts, by Distribution Channel (2020-2032) (USD Billion)
10.4.12.3 Australia Eyewear Market Estimates and Forecasts, by End-Use (2020-2032) (USD Billion)
10.4.13 Rest of Asia Pacific
10.4.13.1 Rest of Asia Pacific Eyewear Market Estimates and Forecasts, by Product (2020-2032) (USD Billion)
10.4.13.2 Rest of Asia Pacific Eyewear Market Estimates and Forecasts, by Distribution Channel (2020-2032) (USD Billion)
10.4.13.3 Rest of Asia Pacific Eyewear Market Estimates and Forecasts, by End-Use (2020-2032) (USD Billion)
10.5 Middle East and Africa
10.5.1 Middle East
10.5.1.1 Trends Analysis
10.5.1.2 Middle East Eyewear Market Estimates and Forecasts, by Country (2020-2032) (USD Billion)
10.5.1.3 Middle East Eyewear Market Estimates and Forecasts, by Product (2020-2032) (USD Billion)
10.5.1.4 Middle East Eyewear Market Estimates and Forecasts, by Distribution Channel (2020-2032) (USD Billion)
10.5.1.5 Middle East Eyewear Market Estimates and Forecasts, by End-Use (2020-2032) (USD Billion)
10.5.1.6 UAE
10.5.1.6.1 UAE Eyewear Market Estimates and Forecasts, by Product (2020-2032) (USD Billion)
10.5.1.6.2 UAE Eyewear Market Estimates and Forecasts, by Distribution Channel (2020-2032) (USD Billion)
10.5.1.6.3 UAE Eyewear Market Estimates and Forecasts, by End-Use (2020-2032) (USD Billion)
10.5.1.7 Egypt
10.5.1.7.1 Egypt Eyewear Market Estimates and Forecasts, by Product (2020-2032) (USD Billion)
10.5.1.7.2 Egypt Eyewear Market Estimates and Forecasts, by Distribution Channel (2020-2032) (USD Billion)
10.5.1.7.3 Egypt Eyewear Market Estimates and Forecasts, by End-Use (2020-2032) (USD Billion)
10.5.1.8 Saudi Arabia
10.5.1.8.1 Saudi Arabia Eyewear Market Estimates and Forecasts, by Product (2020-2032) (USD Billion)
10.5.1.8.2 Saudi Arabia Eyewear Market Estimates and Forecasts, by Distribution Channel (2020-2032) (USD Billion)
10.5.1.8.3 Saudi Arabia Eyewear Market Estimates and Forecasts, by End-Use (2020-2032) (USD Billion)
10.5.1.9 Qatar
10.5.1.9.1 Qatar Eyewear Market Estimates and Forecasts, by Product (2020-2032) (USD Billion)
10.5.1.9.2 Qatar Eyewear Market Estimates and Forecasts, by Distribution Channel (2020-2032) (USD Billion)
10.5.1.9.3 Qatar Eyewear Market Estimates and Forecasts, by End-Use (2020-2032) (USD Billion)
10.5.1.10 Rest of Middle East
10.5.1.10.1 Rest of Middle East Eyewear Market Estimates and Forecasts, by Product (2020-2032) (USD Billion)
10.5.1.10.2 Rest of Middle East Eyewear Market Estimates and Forecasts, by Distribution Channel (2020-2032) (USD Billion)
10.5.1.10.3 Rest of Middle East Eyewear Market Estimates and Forecasts, by End-Use (2020-2032) (USD Billion)
10.5.2 Africa
10.5.2.1 Trends Analysis
10.5.2.2 Africa Eyewear Market Estimates and Forecasts, by Country (2020-2032) (USD Billion)
10.5.2.3 Africa Eyewear Market Estimates and Forecasts, by Product (2020-2032) (USD Billion)
10.5.2.4 Africa Eyewear Market Estimates and Forecasts, by Distribution Channel (2020-2032) (USD Billion)
10.5.2.5 Africa Eyewear Market Estimates and Forecasts, by End-Use (2020-2032) (USD Billion)
10.5.2.6 South Africa
10.5.2.6.1 South Africa Eyewear Market Estimates and Forecasts, by Product (2020-2032) (USD Billion)
10.5.2.6.2 South Africa Eyewear Market Estimates and Forecasts, by Distribution Channel (2020-2032) (USD Billion)
10.5.2.6.3 South Africa Eyewear Market Estimates and Forecasts, by End-Use (2020-2032) (USD Billion)
10.5.2.7 Nigeria
10.5.2.7.1 Nigeria Eyewear Market Estimates and Forecasts, by Product (2020-2032) (USD Billion)
10.5.2.7.2 Nigeria Eyewear Market Estimates and Forecasts, by Distribution Channel (2020-2032) (USD Billion)
10.5.2.7.3 Nigeria Eyewear Market Estimates and Forecasts, by End-Use (2020-2032) (USD Billion)
10.5.2.8 Rest of Africa
10.5.2.8.1 Rest of Africa Eyewear Market Estimates and Forecasts, by Product (2020-2032) (USD Billion)
10.5.2.8.2 Rest of Africa Eyewear Market Estimates and Forecasts, by Distribution Channel (2020-2032) (USD Billion)
10.5.2.8.3 Rest of Africa Eyewear Market Estimates and Forecasts, by End-Use (2020-2032) (USD Billion)
10.6 Latin America
10.6.1 Trends Analysis
10.6.2 Latin America Eyewear Market Estimates and Forecasts, by Country (2020-2032) (USD Billion)
10.6.3 Latin America Eyewear Market Estimates and Forecasts, by Product (2020-2032) (USD Billion)
10.6.4 Latin America Eyewear Market Estimates and Forecasts, by Distribution Channel (2020-2032) (USD Billion)
10.6.5 Latin America Eyewear Market Estimates and Forecasts, by End-Use (2020-2032) (USD Billion)
10.6.6 Brazil
10.6.6.1 Brazil Eyewear Market Estimates and Forecasts, by Product (2020-2032) (USD Billion)
10.6.6.2 Brazil Eyewear Market Estimates and Forecasts, by Distribution Channel (2020-2032) (USD Billion)
10.6.6.3 Brazil Eyewear Market Estimates and Forecasts, by End-Use (2020-2032) (USD Billion)
10.6.7 Argentina
10.6.7.1 Argentina Eyewear Market Estimates and Forecasts, by Product (2020-2032) (USD Billion)
10.6.7.2 Argentina Eyewear Market Estimates and Forecasts, by Distribution Channel (2020-2032) (USD Billion)
10.6.7.3 Argentina Eyewear Market Estimates and Forecasts, by End-Use (2020-2032) (USD Billion)
10.6.8 Colombia
10.6.8.1 Colombia Eyewear Market Estimates and Forecasts, by Product (2020-2032) (USD Billion)
10.6.8.2 Colombia Eyewear Market Estimates and Forecasts, by Distribution Channel (2020-2032) (USD Billion)
10.6.8.3 Colombia Eyewear Market Estimates and Forecasts, by End-Use (2020-2032) (USD Billion)
10.6.9 Rest of Latin America
10.6.9.1 Rest of Latin America Eyewear Market Estimates and Forecasts, by Product (2020-2032) (USD Billion)
10.6.9.2 Rest of Latin America Eyewear Market Estimates and Forecasts, by Distribution Channel (2020-2032) (USD Billion)
10.6.9.3 Rest of Latin America Eyewear Market Estimates and Forecasts, by End-Use (2020-2032) (USD Billion)
11. Company Profiles
11.1 Bausch + Lomb Corporation
11.1.1 Company Overview
11.1.2 Financial
11.1.3 Product / Services Offered
11.1.4 SWOT Analysis
11.2 Zeiss Group
11.2.1 Company Overview
11.2.2 Financial
11.2.3 Product / Services Offered
11.2.4 SWOT Analysis
11.3 CHEMIGLAS CORPORATION
11.3.1 Company Overview
11.3.2 Financial
11.3.3 Product / Services Offered
11.3.4 SWOT Analysis
11.4 CIBA Vision (Alcon)
11.4.1 Company Overview
11.4.2 Financial
11.4.3 Product / Services Offered
11.4.4 SWOT Analysis
11.5 CooperVision Limited
11.5.1 Company Overview
11.5.2 Financial
11.5.3 Product / Services Offered
11.5.4 SWOT Analysis
11.6 De Rigo Vision S.p.A.
11.6.1 Company Overview
11.6.2 Financial
11.6.3 Product / Services Offered
11.6.4 SWOT Analysis
11.7 ESSILORLUXOTTICA
11.7.1 Company Overview
11.7.2 Financial
11.7.3 Product / Services Offered
11.7.4 SWOT Analysis
11.8 HOYA Corporation
11.8.1 Company Overview
11.8.2 Financial
11.8.3 Product / Services Offered
11.8.4 SWOT Analysis
11.9 Johnson & Johnson Vision Care Inc.
11.9.1 Company Overview
11.9.2 Financial
11.9.3 Product / Services Offered
11.9.4 SWOT Analysis
11.10 Marchon Eyewear Inc.
11.10.1 Company Overview
11.10.2 Financial
11.10.3 Product / Services Offered
11.10.4 SWOT Analysis
12. Use Cases and Best Practices
13. Conclusion
An accurate research report requires proper strategizing as well as implementation. There are multiple factors involved in the completion of good and accurate research report and selecting the best methodology to compete the research is the toughest part. Since the research reports we provide play a crucial role in any company’s decision-making process, therefore we at SNS Insider always believe that we should choose the best method which gives us results closer to reality. This allows us to reach at a stage wherein we can provide our clients best and accurate investment to output ratio.
Each report that we prepare takes a timeframe of 350-400 business hours for production. Starting from the selection of titles through a couple of in-depth brain storming session to the final QC process before uploading our titles on our website we dedicate around 350 working hours. The titles are selected based on their current market cap and the foreseen CAGR and growth.
The 5 steps process:
Step 1: Secondary Research:
Secondary Research or Desk Research is as the name suggests is a research process wherein, we collect data through the readily available information. In this process we use various paid and unpaid databases which our team has access to and gather data through the same. This includes examining of listed companies’ annual reports, Journals, SEC filling etc. Apart from this our team has access to various associations across the globe across different industries. Lastly, we have exchange relationships with various university as well as individual libraries.
Step 2: Primary Research
When we talk about primary research, it is a type of study in which the researchers collect relevant data samples directly, rather than relying on previously collected data. This type of research is focused on gaining content specific facts that can be sued to solve specific problems. Since the collected data is fresh and first hand therefore it makes the study more accurate and genuine.
We at SNS Insider have divided Primary Research into 2 parts.
Part 1 wherein we interview the KOLs of major players as well as the upcoming ones across various geographic regions. This allows us to have their view over the market scenario and acts as an important tool to come closer to the accurate market numbers. As many as 45 paid and unpaid primary interviews are taken from both the demand and supply side of the industry to make sure we land at an accurate judgement and analysis of the market.
This step involves the triangulation of data wherein our team analyses the interview transcripts, online survey responses and observation of on filed participants. The below mentioned chart should give a better understanding of the part 1 of the primary interview.
Part 2: In this part of primary research the data collected via secondary research and the part 1 of the primary research is validated with the interviews from individual consultants and subject matter experts.
Consultants are those set of people who have at least 12 years of experience and expertise within the industry whereas Subject Matter Experts are those with at least 15 years of experience behind their back within the same space. The data with the help of two main processes i.e., FGDs (Focused Group Discussions) and IDs (Individual Discussions). This gives us a 3rd party nonbiased primary view of the market scenario making it a more dependable one while collation of the data pointers.
Step 3: Data Bank Validation
Once all the information is collected via primary and secondary sources, we run that information for data validation. At our intelligence centre our research heads track a lot of information related to the market which includes the quarterly reports, the daily stock prices, and other relevant information. Our data bank server gets updated every fortnight and that is how the information which we collected using our primary and secondary information is revalidated in real time.
Step 4: QA/QC Process
After all the data collection and validation our team does a final level of quality check and quality assurance to get rid of any unwanted or undesired mistakes. This might include but not limited to getting rid of the any typos, duplication of numbers or missing of any important information. The people involved in this process include technical content writers, research heads and graphics people. Once this process is completed the title gets uploader on our platform for our clients to read it.
Step 5: Final QC/QA Process:
This is the last process and comes when the client has ordered the study. In this process a final QA/QC is done before the study is emailed to the client. Since we believe in giving our clients a good experience of our research studies, therefore, to make sure that we do not lack at our end in any way humanly possible we do a final round of quality check and then dispatch the study to the client.
By Product
Contact Lenses
Premium Contact Lenses
Mass Contact Lenses
Prescription (RX) Glasses
Prescription Glasses, by Frame
Prescription Glasses, by Lens
Sunglasses
Sunglasses, by Frame
Sunglasses, by Lens
By Distribution Channel
E-Commerce
Brick & Mortar
By End-Use
Male
Female
Unisex
Kids
Request for Segment Customization as per your Business Requirement: Segment Customization Request
Regional Coverage:
North America
US
Canada
Mexico
Europe
Eastern Europe
Poland
Romania
Hungary
Turkey
Rest of Eastern Europe
Western Europe
Germany
France
UK
Italy
Spain
Netherlands
Switzerland
Austria
Rest of Western Europe
Asia Pacific
China
India
Japan
South Korea
Vietnam
Singapore
Australia
Rest of Asia Pacific
Middle East & Africa
Middle East
UAE
Egypt
Saudi Arabia
Qatar
Rest of Middle East
Africa
Nigeria
South Africa
Rest of Africa
Latin America
Brazil
Argentina
Colombia
Rest of Latin America
Request for Country Level Research Report: Country Level Customization Request
Available Customization
With the given market data, SNS Insider offers customization as per the company’s specific needs. The following customization options are available for the report:
Detailed Volume Analysis
Criss-Cross segment analysis (e.g. Product X Application)
Competitive Product Benchmarking
Geographic Analysis
Additional countries in any of the regions
Customized Data Representation
Detailed analysis and profiling of additional market players
The Liver Biopsy Market was valued at USD 0.90 billion in 2023 and is estimated to reach USD 1.65 billion by 2032, growing at a CAGR of 6.99% from 2024 to 2032.
The Subcutaneous Drug Delivery Devices Market was worth USD 30.92 billion in 2023 and is predicted to be worth USD 56.95 billion by 2032, growing at a CAGR of 7.07% between 2024 and 2032.
Tele-Epilepsy Market was valued at USD 387.43 million in 2023 and is expected to reach USD 1468.32 million by 2032, growing at a CAGR of 15.98% from 2024-2032.
The Blood Transfusion Diagnostics Market was estimated at USD 4.70 billion in 2022 and is poised to reach 8.38 billion in 2030 anticipated to expand at a compound annual growth rate approx. CAGR of 7.2% for the forecast period of 2023-2030.
The Nuclear Medicine Market Size was valued at USD 11.1 billion in 2023 and is expected to reach USD 38.8 billion by 2032 and grow at a CAGR of 15%.
The Antiperspirants and Deodorants Market Size was valued at USD 62,889 million in 2023 and is expected to reach USD 81,920.89 million by 2031, and grow at a CAGR of 3.36% over the forecast period 2024-2031.
Hi! Click one of our member below to chat on Phone