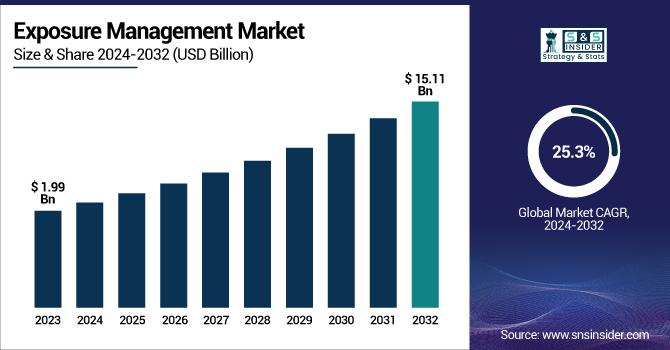
The Exposure Management Market Size was valued at USD 1.99 billion in 2023 and is expected to reach USD 15.11 billion by 2032 and grow at a CAGR of 25.3% over the forecast period 2024-2032.
The Exposure Management Market is experiencing significant growth, driven by the rising adoption of advanced security solutions to combat cyber threats. Organizations worldwide are focusing on risk mitigation strategies to identify and address security vulnerabilities proactively. With the increasing sophistication of cyber-attacks, exposure management solutions are gaining traction across multiple industries, including BFSI, IT & ITES, healthcare, and manufacturing. Companies are leveraging AI, machine learning, and automation to enhance threat detection and response mechanisms.
The U.S. Exposure Management Market size was USD 0.46 billion in 2023 and is expected to reach USD 3.08 billion by 2032, growing at a CAGR of 23.7% over the forecast period of 2024-2032.
The U.S. Exposure Management Market is experiencing significant growth, driven by the increasing adoption of cyber risk management solutions across industries such as finance, healthcare, and government. Organizations are prioritizing proactive threat detection and vulnerability assessment to mitigate cyber risks amid rising security breaches. The market is also benefiting from strict regulatory frameworks and advancements in AI-driven cybersecurity technologies, enabling businesses to strengthen their security posture against evolving threats.
Key Drivers:
Growing Integration of AI and Automation Enhances Exposure Management Market Growth
The incorporation of AI and automation in exposure management solutions is revolutionizing cybersecurity. Organizations are increasingly leveraging AI-driven analytics to identify potential threats and vulnerabilities in real time. Automated solutions provide continuous monitoring, proactive risk assessment, and rapid incident response, reducing human intervention and enhancing efficiency. The rise in sophisticated cyber-attacks, including ransomware and zero-day exploits, is pushing enterprises to adopt AI-powered exposure management tools. Market leaders such as Palo Alto Networks, IBM, and Microsoft are continuously innovating in AI-driven security solutions, enabling enterprises to enhance risk mitigation strategies. The demand for intelligent security solutions that offer predictive analytics and automated remediation is propelling market growth.
Restrain:
High Implementation Costs Hinder the Widespread Adoption of Exposure Management Solutions
Despite its growing demand, the exposure management market faces significant restraints due to the high costs of implementation. Enterprises, especially small and medium-sized businesses (SMBs), struggle with the financial burden of adopting advanced security solutions. The deployment of AI-driven exposure management systems requires substantial investment in infrastructure, skilled workforce, and integration with existing security frameworks.
Additionally, frequent updates and maintenance costs add to the overall expenditure, making it difficult for budget-constrained organizations to adopt these solutions. Companies must strategize cost-effective models, such as cloud-based exposure management services, to enhance market penetration and cater to cost-sensitive businesses.
Opportunities:
Expansion of Cloud-Based Security Solutions Creates New Growth Opportunities in the Market
The rapid adoption of cloud computing and hybrid work environments has led to an increasing demand for cloud-based exposure management solutions. Enterprises are shifting towards cloud-driven security frameworks that offer scalable, real-time, and automated threat detection capabilities. Cloud-based exposure management solutions provide businesses with flexibility, lower operational costs, and seamless integration with existing security infrastructure. Cybersecurity firms, including AWS, Microsoft Azure, and Google Cloud, are investing in cloud-native security solutions to enhance their offerings. The growing inclination toward remote work and digital transformation presents lucrative opportunities for market players to develop innovative cloud security solutions tailored to the evolving threat landscape.
Challenge:
Evolving Cyber Threats and Sophisticated Attack Tactics Pose a Major Market Challenge
The exposure management market faces a major challenge due to the constant evolution of cyber threats. Hackers are deploying advanced attack techniques, including AI-powered malware, deepfake phishing, and supply chain attacks, making it difficult for enterprises to stay ahead of cyber risks. Traditional security approaches are becoming obsolete, necessitating the adoption of dynamic and adaptive exposure management frameworks. Organizations must invest in advanced threat intelligence, behavioral analytics, and real-time monitoring solutions to combat emerging cyber threats. Continuous innovation and strategic collaborations between cybersecurity firms and enterprises are critical to addressing this growing challenge in the exposure management market.
By Component
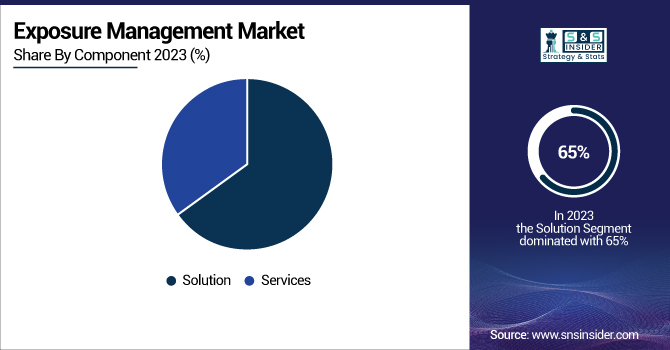
The solution segment holds the largest revenue share, accounting for 65% of the exposure management market in 2023. The surge in demand for AI-driven risk assessment and vulnerability management tools has significantly propelled this segment. Leading cybersecurity firms such as Tenable, Qualys, and Palo Alto Networks have introduced innovative solutions to enhance exposure management. For instance, Tenable launched its advanced risk-based vulnerability management solution, providing real-time insights to minimize cyber threats. The growing reliance on automated exposure detection tools to mitigate risks in complex IT environments is fueling the dominance of this segment.
The services segment is witnessing the fastest growth, with a CAGR of 26.4% during the forecasted period. Enterprises are increasingly relying on managed security services, consulting, and risk assessment solutions to strengthen their cybersecurity posture. Companies like IBM and Accenture are investing in professional services to help organizations enhance their exposure management strategies. The rising adoption of third-party security services due to the lack of in-house cybersecurity expertise is driving market expansion. Additionally, the increasing demand for customized security services tailored to industry-specific threats is propelling the growth of this segment.
By Application
The vulnerability management segment is dominating the exposure management market due to the growing emphasis on proactive threat identification and risk prioritization. Organizations are leveraging advanced vulnerability assessment tools to detect security weaknesses before exploitation. Companies like Rapid7 and Qualys have introduced AI-powered vulnerability management solutions to automate threat detection and remediation. The increasing frequency of cyber-attacks targeting enterprise infrastructure is driving market demand for robust vulnerability management frameworks.
Attack surface management is experiencing the highest CAGR, driven by organizations' expanding digital footprints. Businesses are implementing exposure management solutions to monitor and secure cloud environments, IoT devices, and third-party integrations. Companies like Palo Alto Networks and Microsoft have launched AI-driven attack surface management tools to provide real-time insights into security gaps. The rapid proliferation of remote work and digital transformation initiatives is boosting the adoption of attack surface management solutions.
By End-Use
The BFSI sector dominates the exposure management market, holding a 32% revenue share. Financial institutions are prioritizing exposure management solutions to protect sensitive data from cyber threats. Regulatory compliance requirements, including PCI-DSS and GDPR, are further driving the adoption of risk assessment frameworks. Leading firms like JPMorgan Chase and Citibank are investing in AI-driven exposure management solutions to fortify their security infrastructure.
The IT and ITES segment is growing at the highest CAGR of 26.6%, fueled by the rising cyber risks associated with cloud-based operations. The increasing number of cyber incidents targeting IT service providers is accelerating the adoption of exposure management solutions. Companies like Google, Microsoft, and Amazon are launching cloud-native security solutions to enhance exposure management capabilities.
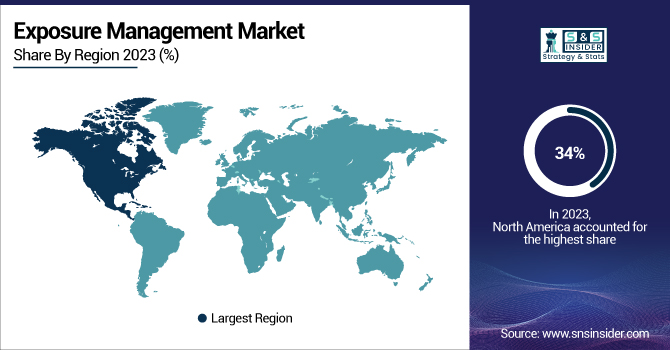
North America dominated the Exposure Management Market in 2023, holding an estimated market share of around 34%. This dominance is primarily driven by the region’s advanced cybersecurity infrastructure, stringent regulatory frameworks, and increasing cyber threats across industries such as finance, healthcare, and government. Organizations in North America are actively investing in proactive risk assessment and exposure management solutions to mitigate vulnerabilities before cyberattacks occur. Leading companies like CrowdStrike and Palo Alto Networks are playing a significant role in shaping the market by offering AI-driven threat exposure solutions. Additionally, the rising number of ransomware attacks and data breaches has compelled businesses to prioritize risk-based vulnerability management, further fueling market growth.
Asia Pacific is the fastest-growing region in the Exposure Management Market, with an estimated CAGR of around 26.2% from 2023 to 2032. The rapid adoption of cloud computing, IoT, and digital transformation across key economies such as China, India, Japan, and Australia have significantly increased the demand for cyber risk exposure management solutions. Governments in the region are tightening cybersecurity regulations, prompting enterprises to enhance their security posture. For instance, India’s Digital Personal Data Protection Act (DPDPA) 2023 and China’s cybersecurity compliance requirements have accelerated investments in exposure management technologies. Additionally, as cyber threats continue to rise in Asia Pacific, businesses are increasingly focusing on real-time risk assessment and proactive security measures, making it the fastest-growing region in this market.
CrowdStrike (CrowdStrike Falcon Exposure Management, Falcon X Threat Intelligence)
Ernst & Young Global Limited (EY) (EY Cyber Threat Management, EY Attack Surface Management)
eSentire, Inc. (eSentire Exposure Management, eSentire MDR for Threat Intelligence)
Forescout Technologies, Inc. (Forescout Continuum Exposure Management, Forescout Risk & Exposure Management)
International Business Machines Corporation (IBM) (IBM Security Randori Recon, IBM X-Force Threat Intelligence)
Mandiant (Mandiant Attack Surface Management, Mandiant Threat Intelligence Platform)
Palo Alto Networks (Prisma Cloud Attack Surface Management, Cortex Xpanse)
Tenable, Inc. (Tenable One Exposure Management Platform, Tenable.asm)
Verisk Analytics, Inc. (Verisk Cyber Risk Solutions, Verisk SecurityScorecard)
VIAVI Solutions Inc. (VIAVI Observer Exposure Management, VIAVI Network Threat Intelligence)
November 2023: CrowdStrike was recognized as a Leader in the IDC MarketScape: Worldwide Risk-Based Vulnerability Management Platforms 2023 Vendor Assessment. The company's Falcon Exposure Management platform was highlighted for its comprehensive visibility into potential attack paths, enabling proactive risk mitigation.
October 2023: EY launched a new tagline, "Shape the future with confidence," accompanied by an international advertising campaign and a refreshed brand image. This initiative aimed to unify its workforce and enhance client engagement following the previous year's unsuccessful attempt to split its auditing and consulting businesses.
Report Attributes | Details |
---|---|
Market Size in 2023 | US$ 1.99 Billion |
Market Size by 2032 | US$ 15.11 Billion |
CAGR | CAGR of 25.3 % From 2024 to 2032 |
Base Year | 2023 |
Forecast Period | 2024-2032 |
Historical Data | 2020-2022 |
Report Scope & Coverage | Market Size, Segments Analysis, Competitive Landscape, Regional Analysis, DROC & SWOT Analysis, Forecast Outlook |
Key Segments | • By Component (Solution, Services) • By Deployment (Cloud, On-Premises) • By Application (Vulnerability Management, Threat Intelligence, Attack Surface Management, Assets Management, Others) • By End-Use (BFSI, Healthcare & Life Sciences, Retail & E-Commerce, Government & Defense, Energy and Utilities, IT and ITes, Others) |
Regional Analysis/Coverage | North America (US, Canada, Mexico), Europe (Eastern Europe [Poland, Romania, Hungary, Turkey, Rest of Eastern Europe] Western Europe] Germany, France, UK, Italy, Spain, Netherlands, Switzerland, Austria, Rest of Western Europe]), Asia Pacific (China, India, Japan, South Korea, Vietnam, Singapore, Australia, Rest of Asia Pacific), Middle East & Africa (Middle East [UAE, Egypt, Saudi Arabia, Qatar, Rest of Middle East], Africa [Nigeria, South Africa, Rest of Africa], Latin America (Brazil, Argentina, Colombia, Rest of Latin America) |
Company Profiles | CrowdStrike, Ernst & Young Global Limited, eSentire, Inc., Forescout Technologies, Inc., International Business Machines Corporation, Mandiant, Palo Alto Networks, Tenable, Inc., Verisk Analytics, Inc., VIAVI Solutions Inc. |
Ans: The Exposure Management Market is expected to grow at a CAGR of 25.3% during 2024-2032.
Ans: The Exposure Management Market size was USD 1.99 billion in 2023 and is expected to reach USD 15.11 billion by 2032.
Ans: The major growth factor of the Exposure Management Market is the rising frequency of cyber threats and data breaches, driving organizations to adopt proactive risk-based vulnerability management solutions.
Ans: The Cloud segment dominated the Exposure Management Market.
Ans: North America dominated the Exposure Management Market in 2023.
Table Of Content
1. Introduction
1.1 Market Definition
1.2 Scope (Inclusion and Exclusions)
1.3 Research Assumptions
2. Executive Summary
2.1 Market Overview
2.2 Regional Synopsis
2.3 Competitive Summary
3. Research Methodology
3.1 Top-Down Approach
3.2 Bottom-up Approach
3.3. Data Validation
3.4 Primary Interviews
4. Market Dynamics Impact Analysis
4.1 Market Driving Factors Analysis
4.1.1 Drivers
4.1.2 Restraints
4.1.3 Opportunities
4.1.4 Challenges
4.2 PESTLE Analysis
4.3 Porter’s Five Forces Model
5. Statistical Insights and Trends Reporting
5.1 Investment & Funding Statistics, 2023
5.2 Technology & Innovation Statistics, 2023
5.3 Regulatory & Compliance Data, 2023
5.4 Cybersecurity Incident Metrics
6. Competitive Landscape
6.1 List of Major Companies By Region
6.2 Market Share Analysis By Region
6.3 Product Benchmarking
6.3.1 Product specifications and features
6.3.2 Pricing
6.4 Strategic Initiatives
6.4.1 Marketing and promotional activities
6.4.2 Distribution and Supply Chain Strategies
6.4.3 Expansion plans and new product launches
6.4.4 Strategic partnerships and collaborations
6.5 Technological Advancements
6.6 Market Positioning and Branding
7. Exposure Management Market Segmentation By Application
7.1 Chapter Overview
7.2 Vulnerability Management
7.2.1 Vulnerability Management Marketing Market Trends Analysis (2020-2032)
7.2.2 Vulnerability Management Market Size Estimates and Forecasts to 2032 (USD Billion)
7.3 Threat Intelligence
7.3.1 Threat Intelligence Market Trends Analysis (2020-2032)
7.3.2 Threat Intelligence Market Size Estimates and Forecasts to 2032 (USD Billion)
7.4 Attack Surface Management
7.4.1 Attack Surface Management Market Trends Analysis (2020-2032)
7.4.2 Attack Surface Management Market Size Estimates and Forecasts to 2032 (USD Billion)
7.5 Assets Management
7.5.1 Assets Management Market Trends Analysis (2020-2032)
7.5.2 Assets Management Market Size Estimates and Forecasts to 2032 (USD Billion)
7.6 Others
7.6.1 Others Market Trends Analysis (2020-2032)
7.6.2 Others Market Size Estimates and Forecasts to 2032 (USD Billion)
8. Exposure Management Market Segmentation By Deployment
8.1 Chapter Overview
8.2 On-premises
8.2.1 On-Premises Market Trends Analysis (2020-2032)
8.2.2 On-Premises Market Size Estimates and Forecasts to 2032 (USD Billion)
8.3 Cloud
8.3.1 Cloud Market Trends Analysis (2020-2032)
8.3.2 Cloud Market Size Estimates and Forecasts to 2032 (USD Billion)
9. Exposure Management Market Segmentation By Component
9.1 Chapter Overview
9.2 Solution
9.2.1 Solution Market Trends Analysis (2020-2032)
9.2.2 Solution Market Size Estimates and Forecasts to 2032 (USD Billion)
9.3 Services
9.3.1 Services Market Trends Analysis (2020-2032)
9.3.2 Services Market Size Estimates and Forecasts to 2032 (USD Billion)
10. Exposure Management Market Segmentation By End-Use
10.1 Chapter Overview
10.2 Healthcare & Life Sciences
10.2.1 Healthcare & Life Sciences Market Trends Analysis (2020-2032)
10.2.2 Healthcare & Life Sciences Market Size Estimates and Forecasts to 2032 (USD Billion)
10.3 Retail & E-Commerce
10.3.1 Retail & E-Commerce Market Trends Analysis (2020-2032)
10.3.2 Retail & E-Commerce Market Size Estimates and Forecasts to 2032 (USD Billion)
10.4 BFSI
10.4.1 BFSI Market Trends Analysis (2020-2032)
10.4.2 BFSI Market Size Estimates and Forecasts to 2032 (USD Billion)
10.5 Government & Defense
10.5.1 Government & Defense Market Trends Analysis (2020-2032)
10.5.2 Government & Defense Market Size Estimates and Forecasts to 2032 (USD Billion)
10.6 Energy and Utilities
10.6.1 Energy and Utilities Market Trends Analysis (2020-2032)
10.6.2 Energy and Utilities Market Size Estimates and Forecasts to 2032 (USD Billion)
10.7 IT and ITes
10.7.1 IT and ITes Market Trends Analysis (2020-2032)
10.7.2 IT and ITes Market Size Estimates and Forecasts to 2032 (USD Billion)
10.8 Others
10.8.1 Others Market Trends Analysis (2020-2032)
10.8.2 Others Market Size Estimates and Forecasts to 2032 (USD Billion)
11. Regional Analysis
11.1 Chapter Overview
11.2 North America
11.2.1 Trend Analysis
11.2.2 North America Exposure Management Market Estimates and Forecasts by Country (2020-2032) (USD Billion)
11.2.3 North America Exposure Management Market Estimates and Forecasts By Application (2020-2032) (USD Billion)
11.2.4 North America Exposure Management Market Estimates and Forecasts By Deployment (2020-2032) (USD Billion)
11.2.5 North America Exposure Management Market Estimates and Forecasts, By Component (2020-2032) (USD Billion)
11.2.6 North America Exposure Management Market Estimates and Forecasts, By End-Use(2020-2032) (USD Billion)
11.2.7 USA
11.2.7.1 USA Exposure Management Market Estimates and Forecasts, By Application (2020-2032) (USD Billion)
11.2.7.2 USA Exposure Management Market Estimates and Forecasts, By Deployment (2020-2032) (USD Billion)
11.2.7.3 USA Exposure Management Market Estimates and Forecasts, By Component (2020-2032) (USD Billion)
11.2.7.4 USA Exposure Management Market Estimates and Forecasts, By End-Use(2020-2032) (USD Billion)
11.2.8 Canada
11.2.8.1 Canada Exposure Management Market Estimates and Forecasts, By Application (2020-2032) (USD Billion)
11.2.8.2 Canada Exposure Management Market Estimates and Forecasts, By Deployment (2020-2032) (USD Billion)
11.2.8.3 Canada Exposure Management Market Estimates and Forecasts, By Component (2020-2032) (USD Billion)
11.2.8.4 Canada Exposure Management Market Estimates and Forecasts, By End-Use (2020-2032) (USD Billion)
11.2.9 Mexico
11.2.9.1 Mexico Exposure Management Market Estimates and Forecasts, By Application (2020-2032) (USD Billion)
11.2.9.2 Mexico Exposure Management Market Estimates and Forecasts, By Deployment (2020-2032) (USD Billion)
11.2.9.3 Mexico Exposure Management Market Estimates and Forecasts, By Component (2020-2032) (USD Billion)
11.2.9.4 Mexico Exposure Management Market Estimates and Forecasts, By End-Use (2020-2032) (USD Billion)
11.3 Europe
11.3.1 Eastern Europe
11.3.1.1 Trends Analysis
11.3.1.2 Eastern Europe Exposure Management Market Estimates and Forecasts, by Country (2020-2032) (USD Billion)
11.3.1.3 Eastern Europe Exposure Management Market Estimates and Forecasts, By Application (2020-2032) (USD Billion)
11.3.1.4 Eastern Europe Exposure Management Market Estimates and Forecasts, By Deployment (2020-2032) (USD Billion)
11.3.1.5 Eastern Europe Exposure Management Market Estimates and Forecasts, By Component (2020-2032) (USD Billion)
11.3.1.6 Eastern Europe Exposure Management Market Estimates and Forecasts, By End-Use(2020-2032) (USD Billion)
11.3.1.7 Poland
11.3.1.7.1 Poland Exposure Management Market Estimates and Forecasts, By Application (2020-2032) (USD Billion)
11.3.1.7.2 Poland Exposure Management Market Estimates and Forecasts, By Deployment (2020-2032) (USD Billion)
11.3.1.7.3 Poland Exposure Management Market Estimates and Forecasts, By Component (2020-2032) (USD Billion)
11.3.1.7.4 Poland Exposure Management Market Estimates and Forecasts, By End-Use(2020-2032) (USD Billion)
11.3.1.8 Romania
11.3.1.8.1 Romania Exposure Management Market Estimates and Forecasts, By Application (2020-2032) (USD Billion)
11.3.1.8.2 Romania Exposure Management Market Estimates and Forecasts, By Deployment (2020-2032) (USD Billion)
11.3.1.8.3 Romania Exposure Management Market Estimates and Forecasts, By Component (2020-2032) (USD Billion)
11.3.1.8.4 Romania Exposure Management Market Estimates and Forecasts, By End-Use (2020-2032) (USD Billion)
11.3.1.9 Hungary
11.3.1.9.1 Hungary Exposure Management Market Estimates and Forecasts, By Application (2020-2032) (USD Billion)
11.3.1.9.2 Hungary Exposure Management Market Estimates and Forecasts, By Deployment (2020-2032) (USD Billion)
11.3.1.9.3 Hungary Exposure Management Market Estimates and Forecasts, By Component (2020-2032) (USD Billion)
11.3.1.9.4 Hungary Exposure Management Market Estimates and Forecasts, By End-Use (2020-2032) (USD Billion)
11.3.1.10 Turkey
11.3.1.10.1 Turkey Exposure Management Market Estimates and Forecasts, By Application (2020-2032) (USD Billion)
11.3.1.10.2 Turkey Exposure Management Market Estimates and Forecasts, By Deployment (2020-2032) (USD Billion)
11.3.1.10.3 Turkey Exposure Management Market Estimates and Forecasts, By Component (2020-2032) (USD Billion)
11.3.1.10.4 Turkey Exposure Management Market Estimates and Forecasts, By End-Use (2020-2032) (USD Billion)
11.3.1.11 Rest of Eastern Europe
11.3.1.11.1 Rest of Eastern Europe Exposure Management Market Estimates and Forecasts, By Application (2020-2032) (USD Billion)
11.3.1.11.2 Rest of Eastern Europe Exposure Management Market Estimates and Forecasts, By Deployment (2020-2032) (USD Billion)
11.3.1.11.3 Rest of Eastern Europe Exposure Management Market Estimates and Forecasts, By Component (2020-2032) (USD Billion)
11.3.1.11.4 Rest of Eastern Europe Exposure Management Market Estimates and Forecasts, By End-Use (2020-2032) (USD Billion)
11.3.2 Western Europe
11.3.2.1 Trends Analysis
11.3.2.2 Western Europe Exposure Management Market Estimates and Forecasts, by Country (2020-2032) (USD Billion)
11.3.2.3 Western Europe Exposure Management Market Estimates and Forecasts, By Application (2020-2032) (USD Billion)
11.3.2.4 Western Europe Exposure Management Market Estimates and Forecasts, By Deployment (2020-2032) (USD Billion)
11.3.2.5 Western Europe Exposure Management Market Estimates and Forecasts, By Component (2020-2032) (USD Billion)
11.3.2.6 Western Europe Exposure Management Market Estimates and Forecasts, By End-Use (2020-2032) (USD Billion)
11.3.2.7 Germany
11.3.2.7.1 Germany Exposure Management Market Estimates and Forecasts, By Application (2020-2032) (USD Billion)
11.3.2.7.2 Germany Exposure Management Market Estimates and Forecasts, By Deployment (2020-2032) (USD Billion)
11.3.2.7.3 Germany Exposure Management Market Estimates and Forecasts, By Component (2020-2032) (USD Billion)
11.3.2.7.4 Germany Exposure Management Market Estimates and Forecasts, By End-Use (2020-2032) (USD Billion)
11.3.2.8 France
11.3.2.8.1 France Exposure Management Market Estimates and Forecasts, By Application (2020-2032) (USD Billion)
11.3.2.8.2 France Exposure Management Market Estimates and Forecasts, By Deployment (2020-2032) (USD Billion)
11.3.2.8.3 France Exposure Management Market Estimates and Forecasts, By Component (2020-2032) (USD Billion)
11.3.2.8.4 France Exposure Management Market Estimates and Forecasts, By End-Use (2020-2032) (USD Billion)
11.3.2.9 UK
11.3.2.9.1 UK Exposure Management Market Estimates and Forecasts, By Application (2020-2032) (USD Billion)
11.3.2.9.2 UK Exposure Management Market Estimates and Forecasts, By Deployment (2020-2032) (USD Billion)
11.3.2.9.3 UK Exposure Management Market Estimates and Forecasts, By Component (2020-2032) (USD Billion)
11.3.2.9.4 UK Exposure Management Market Estimates and Forecasts, By End-Use (2020-2032) (USD Billion)
11.3.2.10 Italy
11.3.2.10.1 Italy Exposure Management Market Estimates and Forecasts, By Application (2020-2032) (USD Billion)
11.3.2.10.2 Italy Exposure Management Market Estimates and Forecasts, By Deployment (2020-2032) (USD Billion)
11.3.2.10.3 Italy Exposure Management Market Estimates and Forecasts, By Component (2020-2032) (USD Billion)
11.3.2.10.4 Italy Exposure Management Market Estimates and Forecasts, By End-Use (2020-2032) (USD Billion)
11.3.2.11 Spain
11.3.2.11.1 Spain Exposure Management Market Estimates and Forecasts, By Application (2020-2032) (USD Billion)
11.3.2.11.2 Spain Exposure Management Market Estimates and Forecasts, By Deployment (2020-2032) (USD Billion)
11.3.2.11.3 Spain Exposure Management Market Estimates and Forecasts, By Component (2020-2032) (USD Billion)
11.3.2.11.4 Spain Exposure Management Market Estimates and Forecasts, By End-Use (2020-2032) (USD Billion)
11.3.2.12 Netherlands
11.3.2.12.1 Netherlands Exposure Management Market Estimates and Forecasts, By Application (2020-2032) (USD Billion)
11.3.2.12.2 Netherlands Exposure Management Market Estimates and Forecasts, By Deployment (2020-2032) (USD Billion)
11.3.2.12.3 Netherlands Exposure Management Market Estimates and Forecasts, By Component (2020-2032) (USD Billion)
11.3.2.12.4 Netherlands Exposure Management Market Estimates and Forecasts, By End-Use (2020-2032) (USD Billion)
11.3.2.13 Switzerland
11.3.2.13.1 Switzerland Exposure Management Market Estimates and Forecasts, By Application (2020-2032) (USD Billion)
11.3.2.13.2 Switzerland Exposure Management Market Estimates and Forecasts, By Deployment (2020-2032) (USD Billion)
11.3.2.13.3 Switzerland Exposure Management Market Estimates and Forecasts, By Component (2020-2032) (USD Billion)
11.3.2.13.4 Switzerland Exposure Management Market Estimates and Forecasts, By End-Use (2020-2032) (USD Billion)
11.3.2.14 Austria
11.3.2.14.1 Austria Exposure Management Market Estimates and Forecasts, By Application (2020-2032) (USD Billion)
11.3.2.14.2 Austria Exposure Management Market Estimates and Forecasts, By Deployment (2020-2032) (USD Billion)
11.3.2.14.3 Austria Exposure Management Market Estimates and Forecasts, By Component (2020-2032) (USD Billion)
11.3.2.14.4 Austria Exposure Management Market Estimates and Forecasts, By End-Use (2020-2032) (USD Billion)
11.3.2.15 Rest of Western Europe
11.3.2.15.1 Rest of Western Europe Exposure Management Market Estimates and Forecasts, By Application (2020-2032) (USD Billion)
11.3.2.15.2 Rest of Western Europe Exposure Management Market Estimates and Forecasts, By Deployment (2020-2032) (USD Billion)
11.3.2.15.3 Rest of Western Europe Exposure Management Market Estimates and Forecasts, By Component (2020-2032) (USD Billion)
11.3.2.15.4 Rest of Western Europe Exposure Management Market Estimates and Forecasts, By End-Use (2020-2032) (USD Billion)
11.4 Asia Pacific
11.4.1 Trends Analysis
11.4.2 Asia Pacific Exposure Management Market Estimates and Forecasts, by Country (2020-2032) (USD Billion)
11.4.3 Asia Pacific Exposure Management Market Estimates and Forecasts, By Application (2020-2032) (USD Billion)
11.4.4 Asia Pacific Exposure Management Market Estimates and Forecasts, By Deployment (2020-2032) (USD Billion)
11.4.5 Asia Pacific Exposure Management Market Estimates and Forecasts, By Component (2020-2032) (USD Billion)
11.4.6 Asia Pacific Exposure Management Market Estimates and Forecasts, By End-Use (2020-2032) (USD Billion)
11.4.7 China
11.4.7.1 China Exposure Management Market Estimates and Forecasts, By Application (2020-2032) (USD Billion)
11.4.7.2 China Exposure Management Market Estimates and Forecasts, By Deployment (2020-2032) (USD Billion)
11.4.7.3 China Exposure Management Market Estimates and Forecasts, By Component (2020-2032) (USD Billion)
11.4.7.4 China Exposure Management Market Estimates and Forecasts, By End-Use (2020-2032) (USD Billion)
11.4.8 India
11.4.8.1 India Exposure Management Market Estimates and Forecasts, By Application (2020-2032) (USD Billion)
11.4.8.2 India Exposure Management Market Estimates and Forecasts, By Deployment (2020-2032) (USD Billion)
11.4.8.3 India Exposure Management Market Estimates and Forecasts, By Component (2020-2032) (USD Billion)
11.4.8.4 India Exposure Management Market Estimates and Forecasts, By End-Use (2020-2032) (USD Billion)
11.4.9 Japan
11.4.9.1 Japan Exposure Management Market Estimates and Forecasts, By Application (2020-2032) (USD Billion)
11.4.9.2 Japan Exposure Management Market Estimates and Forecasts, By Deployment (2020-2032) (USD Billion)
11.4.9.3 Japan Exposure Management Market Estimates and Forecasts, By Component (2020-2032) (USD Billion)
11.4.9.4 Japan Exposure Management Market Estimates and Forecasts, By End-Use (2020-2032) (USD Billion)
11.4.10 South Korea
11.4.10.1 South Korea Exposure Management Market Estimates and Forecasts, By Application (2020-2032) (USD Billion)
11.4.10.2 South Korea Exposure Management Market Estimates and Forecasts, By Deployment (2020-2032) (USD Billion)
11.4.10.3 South Korea Exposure Management Market Estimates and Forecasts, By Component (2020-2032) (USD Billion)
11.4.10.4 South Korea Exposure Management Market Estimates and Forecasts, By End-Use (2020-2032) (USD Billion)
11.4.11 Vietnam
11.4.11.1 Vietnam Exposure Management Market Estimates and Forecasts, By Application (2020-2032) (USD Billion)
11.4.11.2 Vietnam Exposure Management Market Estimates and Forecasts, By Deployment (2020-2032) (USD Billion)
11.4.11.3 Vietnam Exposure Management Market Estimates and Forecasts, By Component (2020-2032) (USD Billion)
11.4.11.4 Vietnam Exposure Management Market Estimates and Forecasts, By End-Use (2020-2032) (USD Billion)
11.4.12 Singapore
11.4.12.1 Singapore Exposure Management Market Estimates and Forecasts, By Application (2020-2032) (USD Billion)
11.4.12.2 Singapore Exposure Management Market Estimates and Forecasts, By Deployment (2020-2032) (USD Billion)
11.4.12.3 Singapore Exposure Management Market Estimates and Forecasts, By Component (2020-2032) (USD Billion)
11.4.12.4 Singapore Exposure Management Market Estimates and Forecasts, By End-Use (2020-2032) (USD Billion)
11.4.13 Australia
11.4.13.1 Australia Exposure Management Market Estimates and Forecasts, By Application (2020-2032) (USD Billion)
11.4.13.2 Australia Exposure Management Market Estimates and Forecasts, By Deployment (2020-2032) (USD Billion)
11.4.13.3 Australia Exposure Management Market Estimates and Forecasts, By Component (2020-2032) (USD Billion)
11.4.13.4 Australia Exposure Management Market Estimates and Forecasts, By End-Use (2020-2032) (USD Billion)
11.4.14 Rest of Asia Pacific
11.4.14.1 Rest of Asia Pacific Exposure Management Market Estimates and Forecasts, By Application (2020-2032) (USD Billion)
11.4.14.2 Rest of Asia Pacific Exposure Management Market Estimates and Forecasts, By Deployment (2020-2032) (USD Billion)
11.4.14.3 Rest of Asia Pacific Exposure Management Market Estimates and Forecasts, By Component (2020-2032) (USD Billion)
11.4.14.4 Rest of Asia Pacific Exposure Management Market Estimates and Forecasts, By End-Use (2020-2032) (USD Billion)
11.5 Middle East and Africa
11.5.1 Middle East
11.5.1.1 Trends Analysis
11.5.1.2 Middle East Exposure Management Market Estimates and Forecasts, by Country (2020-2032) (USD Billion)
11.5.1.3 Middle East Exposure Management Market Estimates and Forecasts, By Application (2020-2032) (USD Billion)
11.5.1.4 Middle East Exposure Management Market Estimates and Forecasts, By Deployment (2020-2032) (USD Billion)
11.5.1.5 Middle East Exposure Management Market Estimates and Forecasts, By Component (2020-2032) (USD Billion)
11.5.1.6 Middle East Exposure Management Market Estimates and Forecasts, By End-Use (2020-2032) (USD Billion)
11.5.1.7 UAE
11.5.1.7.1 UAE Exposure Management Market Estimates and Forecasts, By Application (2020-2032) (USD Billion)
11.5.1.7.2 UAE Exposure Management Market Estimates and Forecasts, By Deployment (2020-2032) (USD Billion)
11.5.1.7.3 UAE Exposure Management Market Estimates and Forecasts, By Component (2020-2032) (USD Billion)
11.5.1.7.4 UAE Exposure Management Market Estimates and Forecasts, By End-Use (2020-2032) (USD Billion)
11.5.1.8 Egypt
11.5.1.8.1 Egypt Exposure Management Market Estimates and Forecasts, By Application (2020-2032) (USD Billion)
11.5.1.8.2 Egypt Exposure Management Market Estimates and Forecasts, By Deployment (2020-2032) (USD Billion)
11.5.1.8.3 Egypt Exposure Management Market Estimates and Forecasts, By Component (2020-2032) (USD Billion)
11.5.1.8.4 Egypt Exposure Management Market Estimates and Forecasts, By End-Use (2020-2032) (USD Billion)
11.5.1.9 Saudi Arabia
11.5.1.9.1 Saudi Arabia Exposure Management Market Estimates and Forecasts, By Application (2020-2032) (USD Billion)
11.5.1.9.2 Saudi Arabia Exposure Management Market Estimates and Forecasts, By Deployment (2020-2032) (USD Billion)
11.5.1.9.3 Saudi Arabia Exposure Management Market Estimates and Forecasts, By Component (2020-2032) (USD Billion)
11.5.1.9.4 Saudi Arabia Exposure Management Market Estimates and Forecasts, By End-Use (2020-2032) (USD Billion)
11.5.1.10 Qatar
11.5.1.10.1 Qatar Exposure Management Market Estimates and Forecasts, By Application (2020-2032) (USD Billion)
11.5.1.10.2 Qatar Exposure Management Market Estimates and Forecasts, By Deployment (2020-2032) (USD Billion)
11.5.1.10.3 Qatar Exposure Management Market Estimates and Forecasts, By Component (2020-2032) (USD Billion)
11.5.1.10.4 Qatar Exposure Management Market Estimates and Forecasts, By End-Use (2020-2032) (USD Billion)
11.5.1.11 Rest of Middle East
11.5.1.11.1 Rest of Middle East Exposure Management Market Estimates and Forecasts, By Application (2020-2032) (USD Billion)
11.5.1.11.2 Rest of Middle East Exposure Management Market Estimates and Forecasts, By Deployment (2020-2032) (USD Billion)
11.5.1.11.3 Rest of Middle East Exposure Management Market Estimates and Forecasts, By Component (2020-2032) (USD Billion)
11.5.1.11.4 Rest of Middle East Exposure Management Market Estimates and Forecasts, By End-Use (2020-2032) (USD Billion)
11.5.2 Africa
11.5.2.1 Trends Analysis
11.5.2.2 Africa Exposure Management Market Estimates and Forecasts, by Country (2020-2032) (USD Billion)
11.5.2.3 Africa Exposure Management Market Estimates and Forecasts, By Application (2020-2032) (USD Billion)
11.5.2.4 Africa Exposure Management Market Estimates and Forecasts, By Deployment (2020-2032) (USD Billion)
11.5.2.5 Africa Exposure Management Market Estimates and Forecasts, By Component (2020-2032) (USD Billion)
11.5.2.6 Africa Exposure Management Market Estimates and Forecasts, By End-Use (2020-2032) (USD Billion)
11.5.2.7 South Africa
11.5.2.7.1 South Africa Exposure Management Market Estimates and Forecasts, By Application (2020-2032) (USD Billion)
11.5.2.7.2 South Africa Exposure Management Market Estimates and Forecasts, By Deployment (2020-2032) (USD Billion)
11.5.2.7.3 South Africa Exposure Management Market Estimates and Forecasts, By Component (2020-2032) (USD Billion)
11.5.2.7.4 South Africa Exposure Management Market Estimates and Forecasts, By End-Use (2020-2032) (USD Billion)
11.5.2.8 Nigeria
11.5.2.8.1 Nigeria Exposure Management Market Estimates and Forecasts, By Application (2020-2032) (USD Billion)
11.5.2.8.2 Nigeria Exposure Management Market Estimates and Forecasts, By Deployment (2020-2032) (USD Billion)
11.5.2.8.3 Nigeria Exposure Management Market Estimates and Forecasts, By Component (2020-2032) (USD Billion)
11.5.2.8.4 Nigeria Exposure Management Market Estimates and Forecasts, By End-Use (2020-2032) (USD Billion)
11.5.2.9 Rest of Africa
11.5.2.9.1 Rest of Africa Exposure Management Market Estimates and Forecasts, By Application (2020-2032) (USD Billion)
11.5.2.9.2 Rest of Africa Exposure Management Market Estimates and Forecasts, By Deployment (2020-2032) (USD Billion)
11.5.2.9.3 Rest of Africa Exposure Management Market Estimates and Forecasts, By Component (2020-2032) (USD Billion)
11.5.2.9.4 Rest of Africa Exposure Management Market Estimates and Forecasts, By End-Use (2020-2032) (USD Billion)
11.6 Latin America
11.6.1 Trends Analysis
11.6.2 Latin America Exposure Management Market Estimates and Forecasts, by Country (2020-2032) (USD Billion)
11.6.3 Latin America Exposure Management Market Estimates and Forecasts, By Application (2020-2032) (USD Billion)
11.6.4 Latin America Exposure Management Market Estimates and Forecasts, By Deployment (2020-2032) (USD Billion)
11.6.5 Latin America Exposure Management Market Estimates and Forecasts, By Component (2020-2032) (USD Billion)
11.6.6 Latin America Exposure Management Market Estimates and Forecasts, By End-Use (2020-2032) (USD Billion)
11.6.7 Brazil
11.6.7.1 Brazil Exposure Management Market Estimates and Forecasts, By Application (2020-2032) (USD Billion)
11.6.7.2 Brazil Exposure Management Market Estimates and Forecasts, By Deployment (2020-2032) (USD Billion)
11.6.7.3 Brazil Exposure Management Market Estimates and Forecasts, By Component (2020-2032) (USD Billion)
11.6.7.4 Brazil Exposure Management Market Estimates and Forecasts, By End-Use (2020-2032) (USD Billion)
11.6.8 Argentina
11.6.8.1 Argentina Exposure Management Market Estimates and Forecasts, By Application (2020-2032) (USD Billion)
11.6.8.2 Argentina Exposure Management Market Estimates and Forecasts, By Deployment (2020-2032) (USD Billion)
11.6.8.3 Argentina Exposure Management Market Estimates and Forecasts, By Component (2020-2032) (USD Billion)
11.6.8.4 Argentina Exposure Management Market Estimates and Forecasts, By End-Use (2020-2032) (USD Billion)
11.6.9 Colombia
11.6.9.1 Colombia Exposure Management Market Estimates and Forecasts, By Application (2020-2032) (USD Billion)
11.6.9.2 Colombia Exposure Management Market Estimates and Forecasts, By Deployment (2020-2032) (USD Billion)
11.6.9.3 Colombia Exposure Management Market Estimates and Forecasts, By Component (2020-2032) (USD Billion)
11.6.9.4 Colombia Exposure Management Market Estimates and Forecasts, By End-Use (2020-2032) (USD Billion)
11.6.10 Rest of Latin America
11.6.10.1 Rest of Latin America Exposure Management Market Estimates and Forecasts, By Application (2020-2032) (USD Billion)
11.6.10.2 Rest of Latin America Exposure Management Market Estimates and Forecasts, By Deployment (2020-2032) (USD Billion)
11.6.10.3 Rest of Latin America Exposure Management Market Estimates and Forecasts, By Component (2020-2032) (USD Billion)
11.6.10.4 Rest of Latin America Exposure Management Market Estimates and Forecasts, By End-Use (2020-2032) (USD Billion)
12. Company Profiles
12.1 CrowdStrike
12.1.1 Company Overview
12.1.2 Financial
12.1.3 Products/ Services Offered
12.1.4 SWOT Analysis
12.2 Ernst & Young Global Limited
12.2.1 Company Overview
12.2.2 Financial
12.2.3 Products/ Services Offered
12.2.4 SWOT Analysis
12.3 eSentire, Inc.
12.3.1 Company Overview
12.3.2 Financial
12.3.3 Products/ Services Offered
12.3.4 SWOT Analysis
12.4 Forescout Technologies, Inc.
12.4.1 Company Overview
12.4.2 Financial
12.4.3 Products/ Services Offered
12.4.4 SWOT Analysis
12.5 International Business Machines Corporation
12.5.1 Company Overview
12.5.2 Financial
12.5.3 Products/ Services Offered
12.5.4 SWOT Analysis
12.6 Mandiant
12.6.1 Company Overview
12.6.2 Financial
12.6.3 Products/ Services Offered
12.6.4 SWOT Analysis
12.7 Palo Alto Networks
12.7.1 Company Overview
12.7.2 Financial
12.7.3 Products/ Services Offered
12.7.4 SWOT Analysis
12.8 Tenable, Inc.
12.8.1 Company Overview
12.8.2 Financial
12.8.3 Products/ Services Offered
12.8.4 SWOT Analysis
12.9 Verisk Analytics, Inc
12.9.1 Company Overview
12.9.2 Financial
12.9.3 Products/ Services Offered
12.9.4 SWOT Analysis
12.10 VIAVI Solutions Inc.
12.10.1 Company Overview
12.10.2 Financial
12.10.3 Products/ Services Offered
12.10.4 SWOT Analysis
13. Use Cases and Best Practices
14. Conclusion
An accurate research report requires proper strategizing as well as implementation. There are multiple factors involved in the completion of good and accurate research report and selecting the best methodology to compete the research is the toughest part. Since the research reports we provide play a crucial role in any company’s decision-making process, therefore we at SNS Insider always believe that we should choose the best method which gives us results closer to reality. This allows us to reach at a stage wherein we can provide our clients best and accurate investment to output ratio.
Each report that we prepare takes a timeframe of 350-400 business hours for production. Starting from the selection of titles through a couple of in-depth brain storming session to the final QC process before uploading our titles on our website we dedicate around 350 working hours. The titles are selected based on their current market cap and the foreseen CAGR and growth.
The 5 steps process:
Step 1: Secondary Research:
Secondary Research or Desk Research is as the name suggests is a research process wherein, we collect data through the readily available information. In this process we use various paid and unpaid databases which our team has access to and gather data through the same. This includes examining of listed companies’ annual reports, Journals, SEC filling etc. Apart from this our team has access to various associations across the globe across different industries. Lastly, we have exchange relationships with various university as well as individual libraries.
Step 2: Primary Research
When we talk about primary research, it is a type of study in which the researchers collect relevant data samples directly, rather than relying on previously collected data. This type of research is focused on gaining content specific facts that can be sued to solve specific problems. Since the collected data is fresh and first hand therefore it makes the study more accurate and genuine.
We at SNS Insider have divided Primary Research into 2 parts.
Part 1 wherein we interview the KOLs of major players as well as the upcoming ones across various geographic regions. This allows us to have their view over the market scenario and acts as an important tool to come closer to the accurate market numbers. As many as 45 paid and unpaid primary interviews are taken from both the demand and supply side of the industry to make sure we land at an accurate judgement and analysis of the market.
This step involves the triangulation of data wherein our team analyses the interview transcripts, online survey responses and observation of on filed participants. The below mentioned chart should give a better understanding of the part 1 of the primary interview.
Part 2: In this part of primary research the data collected via secondary research and the part 1 of the primary research is validated with the interviews from individual consultants and subject matter experts.
Consultants are those set of people who have at least 12 years of experience and expertise within the industry whereas Subject Matter Experts are those with at least 15 years of experience behind their back within the same space. The data with the help of two main processes i.e., FGDs (Focused Group Discussions) and IDs (Individual Discussions). This gives us a 3rd party nonbiased primary view of the market scenario making it a more dependable one while collation of the data pointers.
Step 3: Data Bank Validation
Once all the information is collected via primary and secondary sources, we run that information for data validation. At our intelligence centre our research heads track a lot of information related to the market which includes the quarterly reports, the daily stock prices, and other relevant information. Our data bank server gets updated every fortnight and that is how the information which we collected using our primary and secondary information is revalidated in real time.
Step 4: QA/QC Process
After all the data collection and validation our team does a final level of quality check and quality assurance to get rid of any unwanted or undesired mistakes. This might include but not limited to getting rid of the any typos, duplication of numbers or missing of any important information. The people involved in this process include technical content writers, research heads and graphics people. Once this process is completed the title gets uploader on our platform for our clients to read it.
Step 5: Final QC/QA Process:
This is the last process and comes when the client has ordered the study. In this process a final QA/QC is done before the study is emailed to the client. Since we believe in giving our clients a good experience of our research studies, therefore, to make sure that we do not lack at our end in any way humanly possible we do a final round of quality check and then dispatch the study to the client.
Key Segments:
By Component
Solution
Services
By Deployment
Cloud
On-Premises
By Application
Vulnerability Management
Threat Intelligence
Attack Surface Management
Assets Management
Others
By End-Use
BFSI
Healthcare & Life Sciences
Retail & E-Commerce
Government & Defense
Energy and Utilities
IT and ITes
Others
Request for Segment Customization as per your Business Requirement: Segment Customization Request
Regional Coverage:
North America
US
Canada
Mexico
Europe
Eastern Europe
Poland
Romania
Hungary
Turkey
Rest of Eastern Europe
Western Europe
Germany
France
UK
Italy
Spain
Netherlands
Switzerland
Austria
Rest of Western Europe
Asia Pacific
China
India
Japan
South Korea
Vietnam
Singapore
Australia
Rest of Asia Pacific
Middle East & Africa
Middle East
UAE
Egypt
Saudi Arabia
Qatar
Rest of Middle East
Africa
Nigeria
South Africa
Rest of Africa
Latin America
Brazil
Argentina
Colombia
Rest of Latin America
Request for Country Level Research Report: Country Level Customization Request
Available Customization
With the given market data, SNS Insider offers customization as per the company’s specific needs. The following customization options are available for the report:
Detailed Volume Analysis
Criss-Cross segment analysis (e.g. Product X Application)
Competitive Product Benchmarking
Geographic Analysis
Additional countries in any of the regions
Customized Data Representation
Detailed analysis and profiling of additional market players
The Contactless Payment Market was valued at USD 45.33 billion in 2023 and will reach USD 194.51 Billion by 2032, growing at a CAGR of 17.59 % by 2032.
The Smart Learning Market was valued at USD 61.29 billion in 2023 and is expected to reach USD 320.45 billion by 2032, growing at a CAGR of 20.21% by 2032.
The Satellite Antenna Market was valued at USD 4.7 billion in 2023 and is expected to reach USD 42.2 billion by 2032, growing at a CAGR of 27.49% by 2032.
The Digital Signature Market size was valued at USD 5.6 Billion in 2023 and will grow to USD 107.1 Billion by 2032 and grow at a CAGR of 38.9 % by 2032.
The Fiber To The Home Market was valued at USD 51.9 Billion in 2023 and is expected to reach USD 147.8 Billion by 2032, growing at a CAGR of 12.34% from 2024-2032.
The Asset Integrity Management Market size was valued at USD 22.37 billion in 2023 and is expected to grow to USD 34.11 billion by 2032 and grow at a CAGR of 4.8% over the forecast period of 2024-2032.
Hi! Click one of our member below to chat on Phone