Get more information on Expense Management Market - Request Sample Report
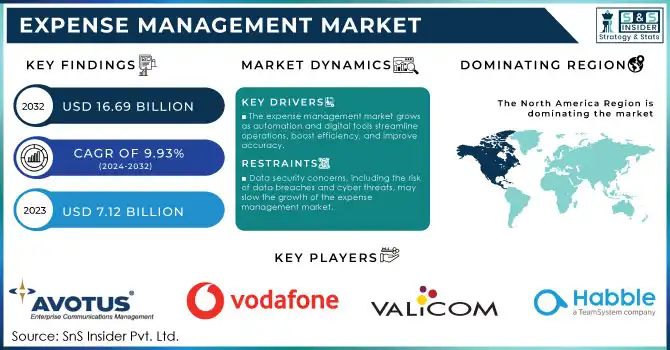
The Expense Management Market size was valued at USD 7.12 billion in 2023 and is expected to grow to USD 16.69 billion by 2032 and grow at a CAGR of 9.93% over the forecast period of 2024-2032.
The Expense Management Market is gaining significant momentum as businesses and individuals strive for more effective control over their financial operations. This market involves the use of software and platforms designed to streamline and automate the process of tracking, reporting, and managing expenses. Organizations, especially those in finance, retail, and corporate sectors, are increasingly adopting expense management solutions to enhance accuracy, improve efficiency, and ensure compliance with financial regulations.
One of the key growth drivers in this market is the increasing demand for automation and digitalization in financial operations. Traditional methods of managing expenses, such as spreadsheets and manual reports, are being replaced by cloud-based and AI-powered software that offer real-time expense tracking, data analytics, and integration with other financial systems. This shift helps reduce administrative workload and mitigates human errors, leading to better financial insights and faster decision-making. In terms of trends, mobile and cloud-based expense management solutions are becoming increasingly popular. Mobile apps enable employees to easily capture receipts and submit claims, providing convenience and improving efficiency. Additionally, cloud technology allows for seamless integration with other business systems, providing businesses with a unified view of their finances. Another trend is the growing use of artificial intelligence (AI) and machine learning (ML) to predict spending patterns, detect anomalies, and offer recommendations for cost-saving measures.
DRIVERS
The growth of the expense management market is driven by the increasing adoption of automation and digital tools, which streamline operations, improve efficiency, and enhance accuracy.
The growth of the Expense Management Market is significantly driven by the ongoing trends of automation and digital transformation. As businesses increasingly embrace automation and digital tools to optimize operations, the demand for expense management solutions has surged. Automation plays a crucial role in eliminating time-consuming manual processes, reducing human error, and improving overall efficiency. By automating tasks such as data entry, approval workflows, and report generation, businesses can streamline their expense management processes, enabling faster and more accurate financial decision-making. Furthermore, digital tools provide real-time insights into spending patterns, allowing organizations to track expenses more effectively and identify cost-saving opportunities. This enhanced visibility into financial operations also empowers businesses to enforce compliance, monitor budgets, and manage reimbursements efficiently. The growing adoption of cloud-based solutions further accelerates this shift, as companies can now access expense management platforms remotely, enhancing flexibility and scalability. Cloud solutions reduce the need for on-premise infrastructure and enable seamless integration with other enterprise systems, such as ERP and HR platforms. These factors collectively contribute to the growth of the expense management market, as organizations recognize the value of automation in reducing operational costs, improving employee productivity, and ensuring better financial control.
RESTRAIN
Data security concerns, including the risk of data breaches and cyber threats, may slow the growth of the expense management market.
Data security concerns are a significant challenge to the growth of the expense management market, especially as businesses increasingly rely on digital and cloud-based solutions. Expense management systems handle sensitive financial information such as employee reimbursements, travel expenses, and corporate spending data, making them prime targets for cyberattacks and data breaches. The potential for unauthorized access to financial records, identity theft, or fraud creates a pressing need for robust security measures in these systems. As companies adopt cloud-based or third-party expense management platforms, the risks associated with sharing sensitive data over the internet or storing it off-site become more pronounced.
The fear of data breaches and the regulatory repercussions tied to non-compliance with data protection laws, such as GDPR or CCPA, make businesses hesitant to embrace these systems fully. Additionally, smaller organizations may lack the resources to implement the necessary cybersecurity protocols, making them more vulnerable to potential threats. This hesitation can slow the adoption of expense management solutions, particularly in industries where security is a top priority, such as finance, healthcare, and government. Despite these concerns, the expense management market continues to grow as vendors enhance the security features of their platforms. Advanced encryption, multi-factor authentication, and compliance with industry standards are becoming more common, helping to mitigate the risks associated with data security.
By Type
The Telecom/Mobile Expense Management segment dominated with the market share over 42% in 2023, primarily due to the widespread adoption of mobile and telecom services across various industries. Businesses are increasingly relying on telecom services for communication, data transfer, and operational needs, making it crucial to manage these expenses effectively. Telecom/Mobile Expense Management solutions provide organizations with the tools to track usage, optimize plans, and control costs associated with mobile communications. This helps prevent wastage, identify inefficiencies, and ensure that businesses are only paying for what they need. For organizations managing large-scale telecom operations, such as global enterprises with numerous mobile devices and telecom contracts, these solutions are essential in reducing unnecessary expenditures.
By Enterprise Size
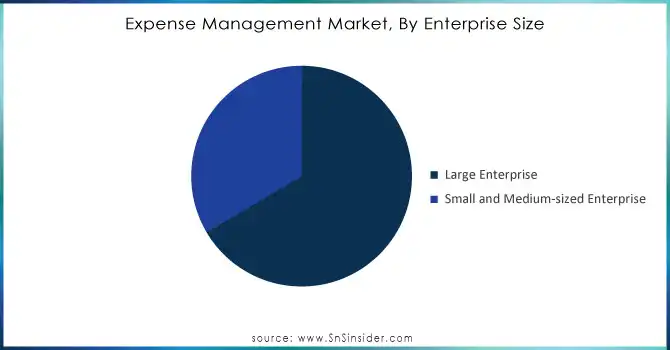
The Large Enterprises segment dominated with the market share over 62% in 2023, due to the complexity and scale of their financial operations. These organizations often have vast teams, multiple departments, and a high volume of transactions, all of which require advanced and scalable solutions to efficiently manage expenses. The intricate financial workflows, such as managing various budgets, approving expenditures, and generating detailed financial reports, necessitate sophisticated tools that can automate and streamline these processes. Furthermore, large enterprises often operate across multiple regions or countries, requiring expense management systems that can handle diverse currency, tax, and compliance requirements.
Need any customization research on Expense Management Market - Enquiry Now
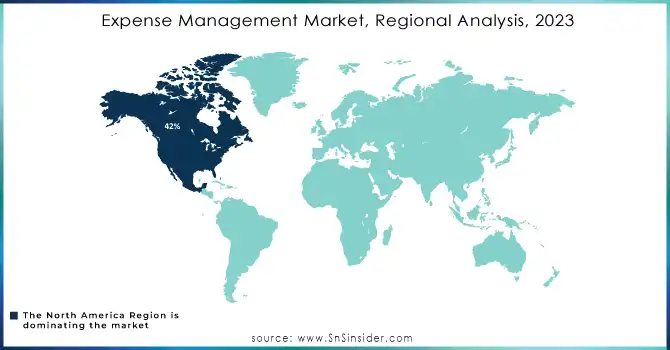
North America region dominated with the market share over 42% in 2023, due to its advanced technological infrastructure, high digital adoption, and a robust economy. The region is home to several key players in the expense management software industry, such as SAP Concur, Expensify, and Zoho, which provide cutting-edge solutions for businesses across various sectors. The healthcare, retail, and manufacturing industries in North America have seen a rising need for streamlined financial processes, driving demand for automated expense management systems that reduce human error, improve accuracy, and enhance operational efficiency. Furthermore, companies in the region prioritize financial transparency and compliance, which expense management solutions can effectively support.
Asia-Pacific is the fastest-growing region in the expense management market, driven by rapid digital transformation across countries like India, China, and Japan. Significant investments in automation and cloud-based solutions are accelerating the adoption of advanced technologies. Additionally, the increasing number of small and medium enterprises (SMEs) in the region is fueling demand for expense management systems, as these businesses seek to streamline their financial processes, reduce costs, and enhance efficiency.
Avotus (Expense management software, Telecom expense management)
Vodafone Group Plc (Business expense management solutions, Telecom services)
Valicom (Telecom expense management, Voice and data billing solutions)
Habble Srl (Telecom expense management, Cost optimization tools)
VoicePlus (Telecom expense management, Automated expense tracking solutions)
Tangoe (Enterprise expense management software, Telecom expense management)
Calero-MDSL (Expense management software, Telecom and technology expense management)
Cass Information Systems, Inc. (Enterprise expense management, Telecom billing services)
Tellennium (Telecom expense management, Bill auditing and optimization services)
Brightfin (Expense management software, Telecom and cloud cost management)
SAP Concur (Travel and expense management solutions)
Coupa Software (Expense management, Spend management software)
Expensify (Expense reporting and management software)
Xpenditure (Expense management, Mobile expense tracking solutions)
Rydoo (Expense management, Corporate travel and expense solution)
Zoho Expense (Expense tracking, Budgeting and reporting software)
Certify (Expense management, Corporate travel and expenses automation)
Chrome River Technologies (Expense management, Invoice automation solutions)
Abacus (Real-time expense reporting, Corporate expense management software)
Emburse (Expense management, Corporate card and travel management solutions)
Suppliers for primarily known for personal finance management, Mint offers budgeting and tracking tools that can also be used for small business expenses of Expense Management Market
SAP Concur
Expensify
Certify (WEX)
Zoho Expense
Rydoo
Chrome River (Emburse)
SutiExpense
Divvy
Abacus (Bill.com)
Mint (Intuit)
In January 2024: Tangoe launched the Tangoe One Cloud solution, a hybrid cloud expense management platform that integrates Tangoe's public cloud control and visibility capabilities with VMware's private cloud services. This innovative platform allows businesses to monitor and allocate costs for both their public and private cloud infrastructures simultaneously.
| Report Attributes | Details |
|---|---|
| Market Size in 2023 | USD 7.12 billion |
| Market Size by 2032 | USD 16.69 billion |
| CAGR | CAGR of 9.96% From 2024 to 2032 |
| Base Year | 2023 |
| Forecast Period | 2024-2032 |
| Historical Data | 2020-2022 |
| Report Scope & Coverage | Market Size, Segments Analysis, Competitive Landscape, Regional Analysis, DROC & SWOT Analysis, Forecast Outlook |
| Key Segments | • By Type (Telecom/Mobile Expense Management, Cloud Expense Management (SaaS/UCaaS, IaaS, PaaS) • By Function (Dispute Management, Invoice and Contract Management, Ordering and Provisioning Management, Sourcing Management, Inventory Management, Usage Management, Others (Reporting) • By Enterprise Size (Large Enterprise, Small and Medium-sized Enterprise) • By End-use Industry (BFSI, Consumer Goods & Retail, Manufacturing, IT & Telecom, Healthcare, Media and Entertainment, Others (Transportation and Logistics) |
| Regional Analysis/Coverage | North America (US, Canada, Mexico), Europe (Eastern Europe [Poland, Romania, Hungary, Turkey, Rest of Eastern Europe] Western Europe] Germany, France, UK, Italy, Spain, Netherlands, Switzerland, Austria, Rest of Western Europe]), Asia Pacific (China, India, Japan, South Korea, Vietnam, Singapore, Australia, Rest of Asia Pacific), Middle East & Africa (Middle East [UAE, Egypt, Saudi Arabia, Qatar, Rest of Middle East], Africa [Nigeria, South Africa, Rest of Africa], Latin America (Brazil, Argentina, Colombia, Rest of Latin America) |
| Company Profiles | Avotus, Vodafone Group Plc, Valicom, Habble Srl, VoicePlus, Tangoe, Calero-MDSL, Cass Information Systems, Inc., Tellennium, Brightfin, SAP Concur, Coupa Software, Expensify, Xpenditure, Rydoo, Zoho Expense, Certify, Chrome River Technologies, Abacus, Emburse. |
| Key Drivers | • The growth of the expense management market is driven by the increasing adoption of automation and digital tools, which streamline operations, improve efficiency, and enhance accuracy. |
| RESTRAINTS | • Data security concerns, including the risk of data breaches and cyber threats, may slow the growth of the expense management market as companies hesitate to adopt cloud-based or third-party systems due to vulnerabilities. |
Ans: The market is expected to grow to USD 14.70 billion by the forecast period of 2031.
Ans. The CAGR of the Expense Management Market for the forecast period 2024-2031 is 9.4%.
Ans. The major worldwide key players in the Expense Management Market are Avotus, Vodafone Group Plc, Valicom, Habble Srl, VoicePlus, Tangoe, Calero-MDSL, Cass Information Systems, Inc., Tellennium, Brightfin and others in final report.
Ans: USD 7.16 billion in 2023 is the market share of the Expense Management Market.
Ans. The forecast period for the Expense Management Market is 2024-2031.
Table of Contents
1. Introduction
1.1 Market Definition
1.2 Scope (Inclusion and Exclusions)
1.3 Research Assumptions
2. Executive Summary
2.1 Market Overview
2.2 Regional Synopsis
2.3 Competitive Summary
3. Research Methodology
3.1 Top-Down Approach
3.2 Bottom-up Approach
3.3. Data Validation
3.4 Primary Interviews
4. Market Dynamics Impact Analysis
4.1 Market Driving Factors Analysis
4.1.1 Drivers
4.1.2 Restraints
4.1.3 Opportunities
4.1.4 Challenges
4.2 PESTLE Analysis
4.3 Porter’s Five Forces Model
5. Statistical Insights and Trends Reporting
5.1 Feature Analysis, 2023
5.2 User Demographics, 2023
5.3 Integration Capabilities, by Software, 2023
5.4 Impact on Decision-making
6. Competitive Landscape
6.1 List of Major Companies, By Region
6.2 Market Share Analysis, By Region
6.3 Product Benchmarking
6.3.1 Product specifications and features
6.3.2 Pricing
6.4 Strategic Initiatives
6.4.1 Marketing and promotional activities
6.4.2 Distribution and supply chain strategies
6.4.3 Expansion plans and new product launches
6.4.4 Strategic partnerships and collaborations
6.5 Technological Advancements
6.6 Market Positioning and Branding
7. Expense Management Software Market Segmentation, By Type
7.1 Chapter Overview
7.2 Telecom/Mobile Expense Management
7.2.1 Telecom/Mobile Expense Management Market Trends Analysis (2020-2032)
7.2.2 Telecom/Mobile Expense Management Market Size Estimates and Forecasts to 2032 (USD Billion)
7.3 Cloud Expense Management
7.3.1 Cloud Expense Management Market Trends Analysis (2020-2032)
7.3.2 Cloud Expense Management Market Size Estimates and Forecasts to 2032 (USD Billion)
7.3.3 SaaS/UCaaS
7.3.3.1 SaaS/UCaaS Market Trends Analysis (2020-2032)
7.3.3.2 SaaS/UCaaS Market Size Estimates and Forecasts to 2032 (USD Billion)
7.3.4 IaaS
7.3.4.1 IaaS Market Trends Analysis (2020-2032)
7.3.4.2 IaaS Market Size Estimates and Forecasts to 2032 (USD Billion)
7.3.5 PaaS
7.3.5.1 PaaS Market Trends Analysis (2020-2032)
7.3.5.2 PaaS Market Size Estimates and Forecasts to 2032 (USD Billion)
8. Expense Management Software Market Segmentation, By Function
8.1 Chapter Overview
8.2 Dispute Management
8.2.1 Dispute Management Market Trends Analysis (2020-2032)
8.2.2 Dispute Management Market Size Estimates and Forecasts to 2032 (USD Billion)
8.3 Invoice and Contract Management
8.3.1 Invoice and Contract Management Market Trends Analysis (2020-2032)
8.3.2 Invoice and Contract Management Market Size Estimates and Forecasts to 2032 (USD Billion)
8.4 Ordering and Provisioning Management
8.4.1 Ordering and Provisioning Management Market Trends Analysis (2020-2032)
8.4.2 Ordering and Provisioning Management Market Size Estimates and Forecasts to 2032 (USD Billion)
8.5 Sourcing Management
8.5.1 Sourcing Management Market Trends Analysis (2020-2032)
8.5.2 Sourcing Management Market Size Estimates and Forecasts to 2032 (USD Billion)
8.6 Inventory Management
8.6.1 Inventory Management Market Trends Analysis (2020-2032)
8.6.2 Inventory Management Market Size Estimates and Forecasts to 2032 (USD Billion)
8.7 Usage Management
8.7.1 Usage Management Market Trends Analysis (2020-2032)
8.7.2 Usage Management Market Size Estimates and Forecasts to 2032 (USD Billion)
8.8 Others (Reporting)
8.8.1 Others (Reporting) Market Trends Analysis (2020-2032)
8.8.2 Others (Reporting) Market Size Estimates and Forecasts to 2032 (USD Billion)
9. Expense Management Software Market Segmentation, By Enterprise Size
9.1 Chapter Overview
9.2 Large Enterprise
9.2.1 Large Enterprise Market Trends Analysis (2020-2032)
9.2.2 Large Enterprise Market Size Estimates and Forecasts to 2032 (USD Billion)
9.3 Small and Medium-sized Enterprise
9.3.1 Small and Medium-sized Enterprise Market Trends Analysis (2020-2032)
9.3.2 Small and Medium-sized Enterprise Market Size Estimates and Forecasts to 2032 (USD Billion)
10. Expense Management Software Market Segmentation, By End-use Industry
10.1 Chapter Overview
10.2 BFSI
10.2.1 OEMs Market Trends Analysis (2020-2032)
10.2.2 OEMs Market Size Estimates and Forecasts to 2032 (USD Billion)
10.3 Consumer Goods & Retail
10.3.1 Dealerships Market Trends Analysis (2020-2032)
10.3.2 Dealerships Size Estimates and Forecasts to 2032 (USD Billion)
10.4 Manufacturing
10.4.1 Others Market Trends Analysis (2020-2032)
10.4.2 Others Market Size Estimates and Forecasts to 2032 (USD Billion)
10.5 IT & Telecom
10.5.1 Others Market Trends Analysis (2020-2032)
10.5.2 Others Market Size Estimates and Forecasts to 2032 (USD Billion)
10.6 Healthcare
10.6.1 Others Market Trends Analysis (2020-2032)
10.6.2 Others Market Size Estimates and Forecasts to 2032 (USD Billion)
10.7 Media and Entertainment
10.7.1 Others Market Trends Analysis (2020-2032)
10.7.2 Others Market Size Estimates and Forecasts to 2032 (USD Billion)
10.8 Others (Transportation and Logistics)
10.8.1 Others Market Trends Analysis (2020-2032)
10.8.2 Others Market Size Estimates and Forecasts to 2032 (USD Billion)
11. Regional Analysis
11.1 Chapter Overview
11.2 North America
11.2.1 Trends Analysis
11.2.2 North America Expense Management Software Market Estimates and Forecasts, by Country (2020-2032) (USD Billion)
11.2.3 North America Expense Management Software Market Estimates and Forecasts, By Type (2020-2032) (USD Billion)
11.2.4 North America Expense Management Software Market Estimates and Forecasts, By Function (2020-2032) (USD Billion)
11.2.5 North America Expense Management Software Market Estimates and Forecasts, By Enterprise Size (2020-2032) (USD Billion)
11.2.6 North America Expense Management Software Market Estimates and Forecasts, By End-use Industry (2020-2032) (USD Billion)
11.2.7 USA
11.2.7.1 USA Expense Management Software Market Estimates and Forecasts, By Type (2020-2032) (USD Billion)
11.2.7.2 USA Expense Management Software Market Estimates and Forecasts, By Function (2020-2032) (USD Billion)
11.2.7.3 USA Expense Management Software Market Estimates and Forecasts, By Enterprise Size (2020-2032) (USD Billion)
11.2.7.4 USA Expense Management Software Market Estimates and Forecasts, By End-use Industry (2020-2032) (USD Billion)
11.2.8 Canada
11.2.8.1 Canada Expense Management Software Market Estimates and Forecasts, By Type (2020-2032) (USD Billion)
11.2.8.2 Canada Expense Management Software Market Estimates and Forecasts, By Function (2020-2032) (USD Billion)
11.2.8.3 Canada Expense Management Software Market Estimates and Forecasts, By Enterprise Size (2020-2032) (USD Billion)
11.2.8.4 Canada Expense Management Software Market Estimates and Forecasts, By End-use Industry (2020-2032) (USD Billion)
11.2.9 Mexico
11.2.9.1 Mexico Expense Management Software Market Estimates and Forecasts, By Type (2020-2032) (USD Billion)
11.2.9.2 Mexico Expense Management Software Market Estimates and Forecasts, By Function (2020-2032) (USD Billion)
11.2.9.3 Mexico Expense Management Software Market Estimates and Forecasts, By Enterprise Size (2020-2032) (USD Billion)
11.2.9.4 Mexico Expense Management Software Market Estimates and Forecasts, By End-use Industry (2020-2032) (USD Billion)
11.3 Europe
11.3.1 Eastern Europe
11.3.1.1 Trends Analysis
11.3.1.2 Eastern Europe Expense Management Software Market Estimates and Forecasts, by Country (2020-2032) (USD Billion)
11.3.1.3 Eastern Europe Expense Management Software Market Estimates and Forecasts, By Type (2020-2032) (USD Billion)
11.3.1.4 Eastern Europe Expense Management Software Market Estimates and Forecasts, By Function (2020-2032) (USD Billion)
11.3.1.5 Eastern Europe Expense Management Software Market Estimates and Forecasts, By Enterprise Size (2020-2032) (USD Billion)
11.3.1.6 Eastern Europe Expense Management Software Market Estimates and Forecasts, By End-use Industry (2020-2032) (USD Billion)
11.3.1.7 Poland
11.3.1.7.1 Poland Expense Management Software Market Estimates and Forecasts, By Type (2020-2032) (USD Billion)
11.3.1.7.2 Poland Expense Management Software Market Estimates and Forecasts, By Function (2020-2032) (USD Billion)
11.3.1.7.3 Poland Expense Management Software Market Estimates and Forecasts, By Enterprise Size (2020-2032) (USD Billion)
11.3.1.7.4 Poland Expense Management Software Market Estimates and Forecasts, By End-use Industry (2020-2032) (USD Billion)
11.3.1.8 Romania
11.3.1.8.1 Romania Expense Management Software Market Estimates and Forecasts, By Type (2020-2032) (USD Billion)
11.3.1.8.2 Romania Expense Management Software Market Estimates and Forecasts, By Function (2020-2032) (USD Billion)
11.3.1.8.3 Romania Expense Management Software Market Estimates and Forecasts, By Enterprise Size (2020-2032) (USD Billion)
11.3.1.8.4 Romania Expense Management Software Market Estimates and Forecasts, By End-use Industry (2020-2032) (USD Billion)
11.3.1.9 Hungary
11.3.1.9.1 Hungary Expense Management Software Market Estimates and Forecasts, By Type (2020-2032) (USD Billion)
11.3.1.9.2 Hungary Expense Management Software Market Estimates and Forecasts, By Function (2020-2032) (USD Billion)
11.3.1.9.3 Hungary Expense Management Software Market Estimates and Forecasts, By Enterprise Size (2020-2032) (USD Billion)
11.3.1.9.4 Hungary Expense Management Software Market Estimates and Forecasts, By End-use Industry (2020-2032) (USD Billion)
11.3.1.10 Turkey
11.3.1.10.1 Turkey Expense Management Software Market Estimates and Forecasts, By Type (2020-2032) (USD Billion)
11.3.1.10.2 Turkey Expense Management Software Market Estimates and Forecasts, By Function (2020-2032) (USD Billion)
11.3.1.10.3 Turkey Expense Management Software Market Estimates and Forecasts, By Enterprise Size (2020-2032) (USD Billion)
11.3.1.10.4 Turkey Expense Management Software Market Estimates and Forecasts, By End-use Industry (2020-2032) (USD Billion)
11.3.1.11 Rest of Eastern Europe
11.3.1.11.1 Rest of Eastern Europe Expense Management Software Market Estimates and Forecasts, By Type (2020-2032) (USD Billion)
11.3.1.11.2 Rest of Eastern Europe Expense Management Software Market Estimates and Forecasts, By Function (2020-2032) (USD Billion)
11.3.1.11.3 Rest of Eastern Europe Expense Management Software Market Estimates and Forecasts, By Enterprise Size (2020-2032) (USD Billion)
11.3.1.11.4 Rest of Eastern Europe Expense Management Software Market Estimates and Forecasts, By End-use Industry (2020-2032) (USD Billion)
11.3.2 Western Europe
11.3.2.1 Trends Analysis
11.3.2.2 Western Europe Expense Management Software Market Estimates and Forecasts, by Country (2020-2032) (USD Billion)
11.3.2.3 Western Europe Expense Management Software Market Estimates and Forecasts, By Type (2020-2032) (USD Billion)
11.3.2.4 Western Europe Expense Management Software Market Estimates and Forecasts, By Function (2020-2032) (USD Billion)
11.3.2.5 Western Europe Expense Management Software Market Estimates and Forecasts, By Enterprise Size (2020-2032) (USD Billion)
11.3.2.6 Western Europe Expense Management Software Market Estimates and Forecasts, By End-use Industry (2020-2032) (USD Billion)
11.3.2.7 Germany
11.3.2.7.1 Germany Expense Management Software Market Estimates and Forecasts, By Type (2020-2032) (USD Billion)
11.3.2.7.2 Germany Expense Management Software Market Estimates and Forecasts, By Function (2020-2032) (USD Billion)
11.3.2.7.3 Germany Expense Management Software Market Estimates and Forecasts, By Enterprise Size (2020-2032) (USD Billion)
11.3.2.7.4 Germany Expense Management Software Market Estimates and Forecasts, By End-use Industry (2020-2032) (USD Billion)
11.3.2.8 France
11.3.2.8.1 France Expense Management Software Market Estimates and Forecasts, By Type (2020-2032) (USD Billion)
11.3.2.8.2 France Expense Management Software Market Estimates and Forecasts, By Function (2020-2032) (USD Billion)
11.3.2.8.3 France Expense Management Software Market Estimates and Forecasts, By Enterprise Size (2020-2032) (USD Billion)
11.3.2.8.4 France Expense Management Software Market Estimates and Forecasts, By End-use Industry (2020-2032) (USD Billion)
11.3.2.9 UK
11.3.2.9.1 UK Expense Management Software Market Estimates and Forecasts, By Type (2020-2032) (USD Billion)
11.3.2.9.2 UK Expense Management Software Market Estimates and Forecasts, By Function (2020-2032) (USD Billion)
11.3.2.9.3 UK Expense Management Software Market Estimates and Forecasts, By Enterprise Size (2020-2032) (USD Billion)
11.3.2.9.4 UK Expense Management Software Market Estimates and Forecasts, By End-use Industry (2020-2032) (USD Billion)
11.3.2.10 Italy
11.3.2.10.1 Italy Expense Management Software Market Estimates and Forecasts, By Type (2020-2032) (USD Billion)
11.3.2.10.2 Italy Expense Management Software Market Estimates and Forecasts, By Function (2020-2032) (USD Billion)
11.3.2.10.3 Italy Expense Management Software Market Estimates and Forecasts, By Enterprise Size (2020-2032) (USD Billion)
11.3.2.10.4 Italy Expense Management Software Market Estimates and Forecasts, By End-use Industry (2020-2032) (USD Billion)
11.3.2.11 Spain
11.3.2.11.1 Spain Expense Management Software Market Estimates and Forecasts, By Type (2020-2032) (USD Billion)
11.3.2.11.2 Spain Expense Management Software Market Estimates and Forecasts, By Function (2020-2032) (USD Billion)
11.3.2.11.3 Spain Expense Management Software Market Estimates and Forecasts, By Enterprise Size (2020-2032) (USD Billion)
11.3.2.11.4 Spain Expense Management Software Market Estimates and Forecasts, By End-use Industry (2020-2032) (USD Billion)
11.3.2.12 Netherlands
11.3.2.12.1 Netherlands Expense Management Software Market Estimates and Forecasts, By Type (2020-2032) (USD Billion)
11.3.2.12.2 Netherlands Expense Management Software Market Estimates and Forecasts, By Function (2020-2032) (USD Billion)
11.3.2.12.3 Netherlands Expense Management Software Market Estimates and Forecasts, By Enterprise Size (2020-2032) (USD Billion)
11.3.2.12.4 Netherlands Expense Management Software Market Estimates and Forecasts, By End-use Industry (2020-2032) (USD Billion)
11.3.2.13 Switzerland
11.3.2.13.1 Switzerland Expense Management Software Market Estimates and Forecasts, By Type (2020-2032) (USD Billion)
11.3.2.13.2 Switzerland Expense Management Software Market Estimates and Forecasts, By Function (2020-2032) (USD Billion)
11.3.2.13.3 Switzerland Expense Management Software Market Estimates and Forecasts, By Enterprise Size (2020-2032) (USD Billion)
11.3.2.13.4 Switzerland Expense Management Software Market Estimates and Forecasts, By End-use Industry (2020-2032) (USD Billion)
11.3.2.14 Austria
11.3.2.14.1 Austria Expense Management Software Market Estimates and Forecasts, By Type (2020-2032) (USD Billion)
11.3.2.14.2 Austria Expense Management Software Market Estimates and Forecasts, By Function (2020-2032) (USD Billion)
11.3.2.14.3 Austria Expense Management Software Market Estimates and Forecasts, By Enterprise Size (2020-2032) (USD Billion)
11.3.2.14.4 Austria Expense Management Software Market Estimates and Forecasts, By End-use Industry (2020-2032) (USD Billion)
11.3.2.15 Rest of Western Europe
11.3.2.15.1 Rest of Western Europe Expense Management Software Market Estimates and Forecasts, By Type (2020-2032) (USD Billion)
11.3.2.15.2 Rest of Western Europe Expense Management Software Market Estimates and Forecasts, By Function (2020-2032) (USD Billion)
11.3.2.15.3 Rest of Western Europe Expense Management Software Market Estimates and Forecasts, By Enterprise Size (2020-2032) (USD Billion)
11.3.2.15.4 Rest of Western Europe Expense Management Software Market Estimates and Forecasts, By End-use Industry (2020-2032) (USD Billion)
11.4 Asia Pacific
11.4.1 Trends Analysis
11.4.2 Asia Pacific Expense Management Software Market Estimates and Forecasts, by Country (2020-2032) (USD Billion)
11.4.3 Asia Pacific Expense Management Software Market Estimates and Forecasts, By Type (2020-2032) (USD Billion)
11.4.4 Asia Pacific Expense Management Software Market Estimates and Forecasts, By Function (2020-2032) (USD Billion)
11.4.5 Asia Pacific Expense Management Software Market Estimates and Forecasts, By Enterprise Size (2020-2032) (USD Billion)
11.4.6 Asia Pacific Expense Management Software Market Estimates and Forecasts, By End-use Industry (2020-2032) (USD Billion)
11.4.7 China
11.4.7.1 China Expense Management Software Market Estimates and Forecasts, By Type (2020-2032) (USD Billion)
11.4.7.2 China Expense Management Software Market Estimates and Forecasts, By Function (2020-2032) (USD Billion)
11.4.7.3 China Expense Management Software Market Estimates and Forecasts, By Enterprise Size (2020-2032) (USD Billion)
11.4.7.4 China Expense Management Software Market Estimates and Forecasts, By End-use Industry (2020-2032) (USD Billion)
11.4.8 India
11.4.8.1 India Expense Management Software Market Estimates and Forecasts, By Type (2020-2032) (USD Billion)
11.4.8.2 India Expense Management Software Market Estimates and Forecasts, By Function (2020-2032) (USD Billion)
11.4.8.3 India Expense Management Software Market Estimates and Forecasts, By Enterprise Size (2020-2032) (USD Billion)
11.4.8.4 India Expense Management Software Market Estimates and Forecasts, By End-use Industry (2020-2032) (USD Billion)
11.4.9 Japan
11.4.9.1 Japan Expense Management Software Market Estimates and Forecasts, By Type (2020-2032) (USD Billion)
11.4.9.2 Japan Expense Management Software Market Estimates and Forecasts, By Function (2020-2032) (USD Billion)
11.4.9.3 Japan Expense Management Software Market Estimates and Forecasts, By Enterprise Size (2020-2032) (USD Billion)
11.4.9.4 Japan Expense Management Software Market Estimates and Forecasts, By End-use Industry (2020-2032) (USD Billion)
11.4.10 South Korea
11.4.10.1 South Korea Expense Management Software Market Estimates and Forecasts, By Type (2020-2032) (USD Billion)
11.4.10.2 South Korea Expense Management Software Market Estimates and Forecasts, By Function (2020-2032) (USD Billion)
11.4.10.3 South Korea Expense Management Software Market Estimates and Forecasts, By Enterprise Size (2020-2032) (USD Billion)
11.4.10.4 South Korea Expense Management Software Market Estimates and Forecasts, By End-use Industry (2020-2032) (USD Billion)
11.4.11 Vietnam
11.4.11.1 Vietnam Expense Management Software Market Estimates and Forecasts, By Type (2020-2032) (USD Billion)
11.4.11.2 Vietnam Expense Management Software Market Estimates and Forecasts, By Function (2020-2032) (USD Billion)
11.4.11.3 Vietnam Expense Management Software Market Estimates and Forecasts, By Enterprise Size (2020-2032) (USD Billion)
11.4.11.4 Vietnam Expense Management Software Market Estimates and Forecasts, By End-use Industry (2020-2032) (USD Billion)
11.4.12 Singapore
11.4.12.1 Singapore Expense Management Software Market Estimates and Forecasts, By Type (2020-2032) (USD Billion)
11.4.12.2 Singapore Expense Management Software Market Estimates and Forecasts, By Function (2020-2032) (USD Billion)
11.4.12.3 Singapore Expense Management Software Market Estimates and Forecasts, By Enterprise Size (2020-2032) (USD Billion)
11.4.12.4 Singapore Expense Management Software Market Estimates and Forecasts, By End-use Industry (2020-2032) (USD Billion)
11.4.13 Australia
11.4.13.1 Australia Expense Management Software Market Estimates and Forecasts, By Type (2020-2032) (USD Billion)
11.4.13.2 Australia Expense Management Software Market Estimates and Forecasts, By Function (2020-2032) (USD Billion)
11.4.13.3 Australia Expense Management Software Market Estimates and Forecasts, By Enterprise Size (2020-2032) (USD Billion)
11.4.13.4 Australia Expense Management Software Market Estimates and Forecasts, By End-use Industry (2020-2032) (USD Billion)
11.4.14 Rest of Asia Pacific
11.4.14.1 Rest of Asia Pacific Expense Management Software Market Estimates and Forecasts, By Type (2020-2032) (USD Billion)
11.4.14.2 Rest of Asia Pacific Expense Management Software Market Estimates and Forecasts, By Function (2020-2032) (USD Billion)
11.4.14.3 Rest of Asia Pacific Expense Management Software Market Estimates and Forecasts, By Enterprise Size (2020-2032) (USD Billion)
11.4.14.4 Rest of Asia Pacific Expense Management Software Market Estimates and Forecasts, By End-use Industry (2020-2032) (USD Billion)
11.5 Middle East and Africa
11.5.1 Middle East
11.5.1.1 Trends Analysis
11.5.1.2 Middle East Expense Management Software Market Estimates and Forecasts, by Country (2020-2032) (USD Billion)
11.5.1.3 Middle East Expense Management Software Market Estimates and Forecasts, By Type (2020-2032) (USD Billion)
11.5.1.4 Middle East Expense Management Software Market Estimates and Forecasts, By Function (2020-2032) (USD Billion)
11.5.1.5 Middle East Expense Management Software Market Estimates and Forecasts, By Enterprise Size (2020-2032) (USD Billion)
11.5.1.6 Middle East Expense Management Software Market Estimates and Forecasts, By End-use Industry (2020-2032) (USD Billion)
11.5.1.7 UAE
11.5.1.7.1 UAE Expense Management Software Market Estimates and Forecasts, By Type (2020-2032) (USD Billion)
11.5.1.7.2 UAE Expense Management Software Market Estimates and Forecasts, By Function (2020-2032) (USD Billion)
11.5.1.7.3 UAE Expense Management Software Market Estimates and Forecasts, By Enterprise Size (2020-2032) (USD Billion)
11.5.1.7.4 UAE Expense Management Software Market Estimates and Forecasts, By End-use Industry (2020-2032) (USD Billion)
11.5.1.8 Egypt
11.5.1.8.1 Egypt Expense Management Software Market Estimates and Forecasts, By Type (2020-2032) (USD Billion)
11.5.1.8.2 Egypt Expense Management Software Market Estimates and Forecasts, By Function (2020-2032) (USD Billion)
11.5.1.8.3 Egypt Expense Management Software Market Estimates and Forecasts, By Enterprise Size (2020-2032) (USD Billion)
11.5.1.8.4 Egypt Expense Management Software Market Estimates and Forecasts, By End-use Industry (2020-2032) (USD Billion)
11.5.1.9 Saudi Arabia
11.5.1.9.1 Saudi Arabia Expense Management Software Market Estimates and Forecasts, By Type (2020-2032) (USD Billion)
11.5.1.9.2 Saudi Arabia Expense Management Software Market Estimates and Forecasts, By Function (2020-2032) (USD Billion)
11.5.1.9.3 Saudi Arabia Expense Management Software Market Estimates and Forecasts, By Enterprise Size (2020-2032) (USD Billion)
11.5.1.9.4 Saudi Arabia Expense Management Software Market Estimates and Forecasts, By End-use Industry (2020-2032) (USD Billion)
11.5.1.10 Qatar
11.5.1.10.1 Qatar Expense Management Software Market Estimates and Forecasts, By Type (2020-2032) (USD Billion)
11.5.1.10.2 Qatar Expense Management Software Market Estimates and Forecasts, By Function (2020-2032) (USD Billion)
11.5.1.10.3 Qatar Expense Management Software Market Estimates and Forecasts, By Enterprise Size (2020-2032) (USD Billion)
11.5.1.10.4 Qatar Expense Management Software Market Estimates and Forecasts, By End-use Industry (2020-2032) (USD Billion)
11.5.1.11 Rest of Middle East
11.5.1.11.1 Rest of Middle East Expense Management Software Market Estimates and Forecasts, By Type (2020-2032) (USD Billion)
11.5.1.11.2 Rest of Middle East Expense Management Software Market Estimates and Forecasts, By Function (2020-2032) (USD Billion)
11.5.1.11.3 Rest of Middle East Expense Management Software Market Estimates and Forecasts, By Enterprise Size (2020-2032) (USD Billion)
11.5.1.11.4 Rest of Middle East Expense Management Software Market Estimates and Forecasts, By End-use Industry (2020-2032) (USD Billion)
11.5.2 Africa
11.5.2.1 Trends Analysis
11.5.2.2 Africa Expense Management Software Market Estimates and Forecasts, by Country (2020-2032) (USD Billion)
11.5.2.3 Africa Expense Management Software Market Estimates and Forecasts, By Type (2020-2032) (USD Billion)
11.5.2.4 Africa Expense Management Software Market Estimates and Forecasts, By Function (2020-2032) (USD Billion)
11.5.2.5 Africa Expense Management Software Market Estimates and Forecasts, By Enterprise Size (2020-2032) (USD Billion)
11.5.2.6 Africa Expense Management Software Market Estimates and Forecasts, By End-use Industry (2020-2032) (USD Billion)
11.5.2.7 South Africa
11.5.2.7.1 South Africa Expense Management Software Market Estimates and Forecasts, By Type (2020-2032) (USD Billion)
11.5.2.7.2 South Africa Expense Management Software Market Estimates and Forecasts, By Function (2020-2032) (USD Billion)
11.5.2.7.3 South Africa Expense Management Software Market Estimates and Forecasts, By Enterprise Size (2020-2032) (USD Billion)
11.5.2.7.4 South Africa Expense Management Software Market Estimates and Forecasts, By End-use Industry (2020-2032) (USD Billion)
11.5.2.8 Nigeria
11.5.2.8.1 Nigeria Expense Management Software Market Estimates and Forecasts, By Type (2020-2032) (USD Billion)
11.5.2.8.2 Nigeria Expense Management Software Market Estimates and Forecasts, By Function (2020-2032) (USD Billion)
11.5.2.8.3 Nigeria Expense Management Software Market Estimates and Forecasts, By Enterprise Size (2020-2032) (USD Billion)
11.5.2.8.4 Nigeria Expense Management Software Market Estimates and Forecasts, By End-use Industry (2020-2032) (USD Billion)
11.5.2.9 Rest of Africa
11.5.2.9.1 Rest of Africa Expense Management Software Market Estimates and Forecasts, By Type (2020-2032) (USD Billion)
11.5.2.9.2 Rest of Africa Expense Management Software Market Estimates and Forecasts, By Function (2020-2032) (USD Billion)
11.5.2.9.3 Rest of Africa Expense Management Software Market Estimates and Forecasts, By Enterprise Size (2020-2032) (USD Billion)
11.5.2.9.4 Rest of Africa Expense Management Software Market Estimates and Forecasts, By End-use Industry (2020-2032) (USD Billion)
11.6 Latin America
11.6.1 Trends Analysis
11.6.2 Latin America Expense Management Software Market Estimates and Forecasts, by Country (2020-2032) (USD Billion)
11.6.3 Latin America Expense Management Software Market Estimates and Forecasts, By Type (2020-2032) (USD Billion)
11.6.4 Latin America Expense Management Software Market Estimates and Forecasts, By Function (2020-2032) (USD Billion)
11.6.5 Latin America Expense Management Software Market Estimates and Forecasts, By Enterprise Size (2020-2032) (USD Billion)
11.6.6 Latin America Expense Management Software Market Estimates and Forecasts, By End-use Industry (2020-2032) (USD Billion)
11.6.7 Brazil
11.6.7.1 Brazil Expense Management Software Market Estimates and Forecasts, By Type (2020-2032) (USD Billion)
11.6.7.2 Brazil Expense Management Software Market Estimates and Forecasts, By Function (2020-2032) (USD Billion)
11.6.7.3 Brazil Expense Management Software Market Estimates and Forecasts, By Enterprise Size (2020-2032) (USD Billion)
11.6.7.4 Brazil Expense Management Software Market Estimates and Forecasts, By End-use Industry (2020-2032) (USD Billion)
11.6.8 Argentina
11.6.8.1 Argentina Expense Management Software Market Estimates and Forecasts, By Type (2020-2032) (USD Billion)
11.6.8.2 Argentina Expense Management Software Market Estimates and Forecasts, By Function (2020-2032) (USD Billion)
11.6.8.3 Argentina Expense Management Software Market Estimates and Forecasts, By Enterprise Size (2020-2032) (USD Billion)
11.6.8.4 Argentina Expense Management Software Market Estimates and Forecasts, By End-use Industry (2020-2032) (USD Billion)
11.6.9 Colombia
11.6.9.1 Colombia Expense Management Software Market Estimates and Forecasts, By Type (2020-2032) (USD Billion)
11.6.9.2 Colombia Expense Management Software Market Estimates and Forecasts, By Function (2020-2032) (USD Billion)
11.6.9.3 Colombia Expense Management Software Market Estimates and Forecasts, By Enterprise Size (2020-2032) (USD Billion)
11.6.9.4 Colombia Expense Management Software Market Estimates and Forecasts, By End-use Industry (2020-2032) (USD Billion)
11.6.10 Rest of Latin America
11.6.10.1 Rest of Latin America Expense Management Software Market Estimates and Forecasts, By Type (2020-2032) (USD Billion)
11.6.10.2 Rest of Latin America Expense Management Software Market Estimates and Forecasts, By Function (2020-2032) (USD Billion)
11.6.10.3 Rest of Latin America Expense Management Software Market Estimates and Forecasts, By Enterprise Size (2020-2032) (USD Billion)
11.6.10.4 Rest of Latin America Expense Management Software Market Estimates and Forecasts, By End-use Industry (2020-2032) (USD Billion)
12. Company Profiles
12.1 Avotus
12.1.1 Company Overview
12.1.2 Financial
12.1.3 Products/ Services Offered
12.1.4 SWOT Analysis
12.2 Vodafone Group Plc
12.2.1 Company Overview
12.2.2 Financial
12.2.3 Products/ Services Offered
12.2.4 SWOT Analysis
12.3 Valicom
12.3.1 Company Overview
12.3.2 Financial
12.3.3 Products/ Services Offered
12.3.4 SWOT Analysis
12.4 Habble Srl
12.4.1 Company Overview
12.4.2 Financial
12.4.3 Products/ Services Offered
12.4.4 SWOT Analysis
12.5 VoicePlus
12.5.1 Company Overview
12.5.2 Financial
12.5.3 Products/ Services Offered
12.5.4 SWOT Analysis
12.6 Tangoe
12.6.1 Company Overview
12.6.2 Financial
12.6.3 Products/ Services Offered
12.6.4 SWOT Analysis
12.7 Calero-MDSL
12.7.1 Company Overview
12.7.2 Financial
12.7.3 Products/ Services Offered
12.7.4 SWOT Analysis
12.8 Cass Information Systems, Inc.
12.8.1 Company Overview
12.8.2 Financial
12.8.3 Products/ Services Offered
12.8.4 SWOT Analysis
12.9 Tellennium
12.9.1 Company Overview
12.9.2 Financial
12.9.3 Products/ Services Offered
12.9.4 SWOT Analysis
12.10 Brightfin
12.10.1 Company Overview
12.10.2 Financial
12.10.3 Products/ Services Offered
12.10.4 SWOT Analysis
13. Use Cases and Best Practices
14. Conclusion
An accurate research report requires proper strategizing as well as implementation. There are multiple factors involved in the completion of good and accurate research report and selecting the best methodology to compete the research is the toughest part. Since the research reports we provide play a crucial role in any company’s decision-making process, therefore we at SNS Insider always believe that we should choose the best method which gives us results closer to reality. This allows us to reach at a stage wherein we can provide our clients best and accurate investment to output ratio.
Each report that we prepare takes a timeframe of 350-400 business hours for production. Starting from the selection of titles through a couple of in-depth brain storming session to the final QC process before uploading our titles on our website we dedicate around 350 working hours. The titles are selected based on their current market cap and the foreseen CAGR and growth.
The 5 steps process:
Step 1: Secondary Research:
Secondary Research or Desk Research is as the name suggests is a research process wherein, we collect data through the readily available information. In this process we use various paid and unpaid databases which our team has access to and gather data through the same. This includes examining of listed companies’ annual reports, Journals, SEC filling etc. Apart from this our team has access to various associations across the globe across different industries. Lastly, we have exchange relationships with various university as well as individual libraries.

Step 2: Primary Research
When we talk about primary research, it is a type of study in which the researchers collect relevant data samples directly, rather than relying on previously collected data. This type of research is focused on gaining content specific facts that can be sued to solve specific problems. Since the collected data is fresh and first hand therefore it makes the study more accurate and genuine.
We at SNS Insider have divided Primary Research into 2 parts.
Part 1 wherein we interview the KOLs of major players as well as the upcoming ones across various geographic regions. This allows us to have their view over the market scenario and acts as an important tool to come closer to the accurate market numbers. As many as 45 paid and unpaid primary interviews are taken from both the demand and supply side of the industry to make sure we land at an accurate judgement and analysis of the market.
This step involves the triangulation of data wherein our team analyses the interview transcripts, online survey responses and observation of on filed participants. The below mentioned chart should give a better understanding of the part 1 of the primary interview.

Part 2: In this part of primary research the data collected via secondary research and the part 1 of the primary research is validated with the interviews from individual consultants and subject matter experts.
Consultants are those set of people who have at least 12 years of experience and expertise within the industry whereas Subject Matter Experts are those with at least 15 years of experience behind their back within the same space. The data with the help of two main processes i.e., FGDs (Focused Group Discussions) and IDs (Individual Discussions). This gives us a 3rd party nonbiased primary view of the market scenario making it a more dependable one while collation of the data pointers.
Step 3: Data Bank Validation
Once all the information is collected via primary and secondary sources, we run that information for data validation. At our intelligence centre our research heads track a lot of information related to the market which includes the quarterly reports, the daily stock prices, and other relevant information. Our data bank server gets updated every fortnight and that is how the information which we collected using our primary and secondary information is revalidated in real time.

Step 4: QA/QC Process
After all the data collection and validation our team does a final level of quality check and quality assurance to get rid of any unwanted or undesired mistakes. This might include but not limited to getting rid of the any typos, duplication of numbers or missing of any important information. The people involved in this process include technical content writers, research heads and graphics people. Once this process is completed the title gets uploader on our platform for our clients to read it.
Step 5: Final QC/QA Process:
This is the last process and comes when the client has ordered the study. In this process a final QA/QC is done before the study is emailed to the client. Since we believe in giving our clients a good experience of our research studies, therefore, to make sure that we do not lack at our end in any way humanly possible we do a final round of quality check and then dispatch the study to the client.
By Type
Telecom/Mobile Expense Management
Cloud Expense Management
SaaS/UCaaS
IaaS
PaaS
By Function
Dispute Management
Invoice and Contract Management
Ordering and Provisioning Management
Sourcing Management
Inventory Management
Usage Management
Others (Reporting)
By Enterprise Size
Large Enterprise
Small and Medium-sized Enterprise
By End-use Industry
BFSI
Consumer Goods & Retail
Manufacturing
IT & Telecom
Healthcare
Media and Entertainment
Others (Transportation and Logistics)
Request for Segment Customization as per your Business Requirement: Segment Customization Request
Regional Coverage
North America
US
Canada
Mexico
Europe
Eastern Europe
Poland
Romania
Hungary
Turkey
Rest of Eastern Europe
Western Europe
Germany
France
UK
Italy
Spain
Netherlands
Switzerland
Austria
Rest of Western Europe
Asia Pacific
China
India
Japan
South Korea
Vietnam
Singapore
Australia
Rest of Asia Pacific
Middle East & Africa
Middle East
UAE
Egypt
Saudi Arabia
Qatar
Rest of the Middle East
Africa
Nigeria
South Africa
Rest of Africa
Latin America
Brazil
Argentina
Colombia
Rest of Latin America
Request for Country Level Research Report: Country Level Customization Request
Available Customization
With the given market data, SNS Insider offers customization as per the company’s specific needs. The following customization options are available for the report:
Product Analysis
Criss-Cross segment analysis (e.g. Product X Application)
Product Matrix which gives a detailed comparison of product portfolio of each company
Geographic Analysis
Additional countries in any of the regions
Company Information
Detailed analysis and profiling of additional market players (Up to five)
The Intelligent Network Market was valued at USD 4.7 billion in 2023 and is expected to reach USD 42.2 billion by 2032, growing at a CAGR of 27.49% by 2032.
The Home Automation Market size was estimated at USD 95.87 Billion in 2023 and will reach USD 249.26 Billion by 2032 at a CAGR of 11.26% by 2024-2032.
The AI Orchestration Market was valued at USD 7.56 billion in 2023 and is expected to reach USD 42.98 billion by 2032, growing at a CAGR of 21.36% by 2032.
The Sales Training Software Market Size was valued at USD 2.37 Billion in 2023 and will reach USD 7.82 Billion by 2032 and grow at a CAGR of 14.27% by 2032.
IoT Monetization Market was valued at USD 639.88 billion in 2023 and is expected to reach USD 27875.59 billion by 2032, growing at a CAGR of 52.1% from 2024-2032.
Active Network Management Market was valued at USD 1.24 billion in 2023 and will reach USD 4.56 billion by 2032, growing at a CAGR of 15.64% by 2032.

Hi! Click one of our member below to chat on Phone
© 2025 All Rights Reserved by SNS Insider Pvt Ltd


