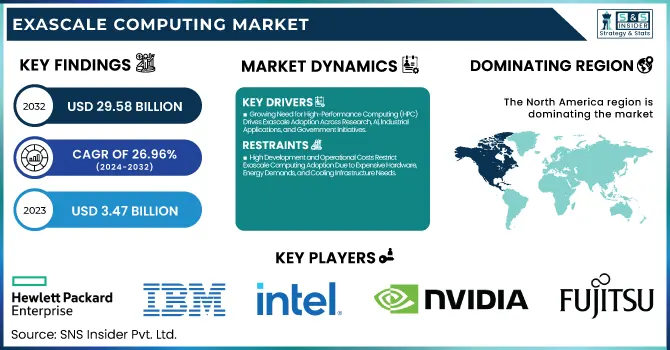
The Exascale Computing Market was valued at USD 3.47 billion in 2023 and is expected to reach USD 29.58 billion by 2032, growing at a CAGR of 26.96% from 2024-2032.
To Get more information on Exascale Computing Market - Request Free Sample Report
This report includes insights on adoption rate, R&D expenditure, energy efficiency data, funding & investment patterns, and algorithm & software development. The market is experiencing aggressive adoption with growing demand for high-performance computing across industries such as healthcare, finance, and defense. Major R&D investments are driving innovation in energy-efficient architecture and optimized software models. Government and private investments are fueling innovation, while software engineering is optimizing system performance and scalability. As exascale computing continues to grow, efficiency and cost remain central areas of focus, influencing the future of computing power and its applications in various industries.
Drivers
Growing Need for High-Performance Computing (HPC) Drives Exascale Adoption Across Research, AI, Industrial Applications, and Government Initiatives
The growing requirement for powerful computing in scientific research, sophisticated simulations, and data-intensive workloads is driving the growth of exascale computing. Healthcare, climate simulation, and aerospace industries need massive processing capabilities to manage large datasets and perform real-time analysis. AI and machine learning technology further necessitate this requirement, demanding quicker and more efficient computing systems. In addition, government and defense programs are heavily investing in exascale systems to advance national security and global technology leadership. Sustained innovations in semiconductor and processor technologies are enabling such systems to be scalable and energy-efficient, paving the way for widespread adoption across industries. With computational challenges escalating, exascale computing is fast becoming mandatory to address next-generation scientific and industrial issues.
Restraints
High Development and Operational Costs Restrict Exascale Computing Adoption Due to Expensive Hardware, Energy Demands, and Cooling Infrastructure Needs.
Development and maintenance of exascale systems require substantial investment in state-of-the-art hardware, massive-scale data centers, and sophisticated cooling infrastructure. The colossal power usage needed to support these high-performance computing platforms further increases operational costs, thus making it a major challenge for affordability. Organizations have to invest significant money in system overhauls, upkeep, and energy efficiency optimization. Moreover, the intricacies of incorporating exascale computing into current workflow also contribute to the cost of implementation. The investments of the government and corporations are important drivers, but finances can hinder high-scale deployments. Without affordable answers, mass adaptation is limited, keeping the extent of exascale computing for transforming industries like healthcare, climate modeling, and AI-based research limited.
Opportunities
Advancements in AI, Machine Learning, and Big Data Analytics Boost Exascale Computing Adoption for Faster Processing and Real-Time Decision-Making.
The growing intricacy of AI models, deep learning algorithms, and big data processing is generating demand for exascale computing. As businesses are dependent on AI for predictive analytics, automation, and decision-making, ultra-high-speed computation needs are more than ever before. Exascale machines accelerate AI training for more precise simulation and real-time data analysis. Healthcare, finance, and autonomous systems gain advantage from increased processing power, which enhances drug development, risk estimation, and applications of machine vision. Further, the convergence of AI-based automation in manufacturing and cybersecurity offers exascale with new applications. As big data and AI keep advancing, exascale computing is instrumental in breaking the technological barrier.
Challenges
Cybersecurity and Data Management Risks in Exascale Computing Increase Threats of Data Breaches, Regulatory Challenges, and System Vulnerabilities.
Handling large amounts of sensitive data in exascale computing systems raises the risk of cyberattacks, data breaches, and regulatory challenges. As increasing dependence on high-performance computing for AI, healthcare, and defense purposes grows, securing massive datasets becomes more complicated. Risks of unauthorized access, system exposure, and possible cyberattacks can halt operations and expose sensitive information. Compliance with international data protection laws is also an added complexity, necessitating strong encryption, access control, and real-time threat detection. Organizations need to invest in sophisticated cybersecurity frameworks to maintain data integrity while facilitating seamless scalability. Absence of proper security, the growth of exascale computing is going to face major roadblocks, restricting its mass adaptation within industries.
By End Use
The Government & Defense segment led the Exascale Computing Market in 2023 with the largest revenue share of around 34%. It is led by heavy investments in national defense, intelligence, and sophisticated defense simulations. Governments across the globe are utilizing exascale computing for cryptography, surveillance, and high-speed data processing in military systems. Climate modeling, nuclear research, and space exploration efforts also contribute to its leadership. The growing requirement for real-time decision-making and supercomputational capacity strengthens the strong market position of the segment.
The segment Healthcare & Biosciences is expected to expand at the fastest CAGR of 29.71% during 2024-2032. The demand is driven by exascale computing being able to expedite drug discovery, genomic research, and personalized medicine. Sophisticated disease modeling, vaccine design, and bioinformatics simulations demand ultra-high computing power, and exascale becomes imperative for innovation. Furthermore, AI-based diagnostics and biomedical data analysis further increase adoption, spurring the segment's future growth at a rapid rate.
By Component
The Hardware segment led the Exascale Computing Market in 2023 with the largest revenue share of approximately 54%. This dominance is spurred by the substantial investment needed in high-performance processors, GPUs, memory systems, and cooling facilities. The heightened need for power-efficient computing units, dedicated accelerators, and high-speed interconnects only reinforces the strength of the segment. Moreover, government and corporate efforts to establish next-generation supercomputing centers drive the surge in adoption of leading-edge hardware, guaranteeing top-notch computing capability for AI, scientific study, and military use.
The Services segment is anticipated to grow at the fastest CAGR of 24.26% during the forecast period from 2024 to 2032. This high growth is propelled by the increase in the requirement for exascale computer infrastructure integration, maintenance, and optimization. Businesses require professional services to make deployments seamless, compatible software, and performance tuning. Growing use of cloud-based exascale solutions and managed services is also boosting demand. With business models and research centers expanding computing power, expert support and consulting services are imperative, driving market growth.
By Deployment
The On-premises segment led the Exascale Computing Market in 2023 with the largest revenue share of approximately 55%. This is because the demand for specialized, high-performance infrastructure is high in defense, government, and research organizations. On-premises installations allow more control of security, data privacy, and performance optimization, thus being best suited for mission-critical applications. On-premises configurations are also used by industries that need real-time simulations and heavy computing, as they allow low-latency processing. The heavy investment in exascale supercomputers built to order also bolsters the market leadership of this segment.
The Cloud-based segment is expected to grow at the fastest CAGR of around 28.15% from 2024 to 2032. It is fueled by the growing use of scalable, cost-effective, and on-demand computing solutions. Cloud-based exascale computing minimizes infrastructure costs and enables organizations to tap into enormous computing power without significant capital expenditure. Moreover, the advancements in cloud security and AI-based workload management are fueling adoption. With industries focusing on flexibility and remote access, cloud-based exascale solutions are picking up huge momentum.
Regional Analysis
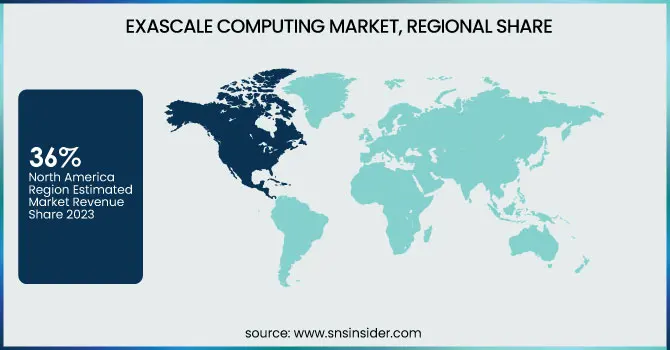
The North America region led the Exascale Computing Market in 2023 with the largest revenue share of around 36%. This is attributed to huge government investments in high-performance computing (HPC) for defense, scientific research, and space exploration. The region also has the presence of major technology companies and research institutions, further fueling developments in exascale computing. In addition, robust investments in AI, cloud computing, and big data analytics boost regional uptake. The U.S. Department of Energy's efforts to build exascale systems further consolidate North America's dominance.
The Asia Pacific region is expected to expand at the fastest CAGR of approximately 29.76% during 2024-2032. Exascale computing adoption is being propelled by fast developments in AI, 5G, and smart city projects. Government spending on supercomputing infrastructure, especially in China, Japan, and India, is driving market growth. The increasing demand for high-performance computing in sectors like healthcare, finance, and manufacturing also drives demand higher. Moreover, rising research and development spending reinforces the region's growth path.
Get Customized Report as per Your Business Requirement - Enquiry Now
Hewlett Packard Enterprise (HPE) [HPE Cray EX235a, HPE Slingshot-11]
International Business Machines Corporation (IBM) [IBM Power System AC922, IBM Power System S922LC]
Intel Corporation [Intel Xeon Max 9470, Intel Max 1550]
NVIDIA Corporation [NVIDIA GH200 Superchip, NVIDIA Hopper H100]
Cray Inc. [Cray EX235a, Cray EX254n]
Fujitsu Limited [Fujitsu A64FX, Tofu interconnect D]
Advanced Micro Devices, Inc. (AMD) [AMD EPYC 64C 2.0GHz, AMD Instinct MI250X]
Lenovo Group Limited [Lenovo ThinkSystem SD650 V3, Lenovo ThinkSystem SR670 V2]
Atos SE [BullSequana XH3000, BullSequana XH2000]
NEC Corporation [SX-Aurora TSUBASA, NEC Vector Engine]
Dell Technologies [Dell EMC PowerEdge XE8545, Dell EMC PowerSwitch Z9332F]
Microsoft [Microsoft Azure NDv5, Microsoft Azure HPC Cache]
Amazon Web Services (AWS) [AWS Graviton3, AWS Nitro System]
Sugon [Sugon TC8600, Sugon I620-G30]
Google [Google TPU v4, Google Cloud HPC VM]
Alibaba Cloud [Alibaba Cloud ECS Bare Metal Instance, Alibaba Cloud HPC Cluster]
In November 2024, HPE announced that El Capitan became the world's fastest supercomputer at 1.742 exaflops and one of the top 20 most energy-efficient systems. HPE now holds the top three spots in global exascale computing, with all three systems built by the company. El Capitan will support AI-driven research in national security, energy, climate, and healthcare.
In March 2024, NVIDIA announced the Blackwell platform, a major advancement in AI and high-performance computing. Featuring the world's most powerful GPU with 208 billion transistors, the platform improves AI model efficiency, enhances performance for large-scale computations, and reduces energy consumption by up to 25x.
| Report Attributes | Details |
|---|---|
| Market Size in 2023 | USD 3.47 Billion |
| Market Size by 2032 | USD 29.58 Billion |
| CAGR | CAGR of 26.96% From 2024 to 2032 |
| Base Year | 2023 |
| Forecast Period | 2024-2032 |
| Historical Data | 2020-2022 |
| Report Scope & Coverage | Market Size, Segments Analysis, Competitive Landscape, Regional Analysis, DROC & SWOT Analysis, Forecast Outlook |
| Key Segments | • By Component (Hardware, Software, Services) • By Deployment (On-premises, Cloud-based) • By End Use (Government & Defense, Healthcare & Biosciences, Financial Services, Research & Academia, Manufacturing & Energy, Others) |
| Regional Analysis/Coverage | North America (US, Canada, Mexico), Europe (Eastern Europe [Poland, Romania, Hungary, Turkey, Rest of Eastern Europe] Western Europe] Germany, France, UK, Italy, Spain, Netherlands, Switzerland, Austria, Rest of Western Europe]), Asia Pacific (China, India, Japan, South Korea, Vietnam, Singapore, Australia, Rest of Asia Pacific), Middle East & Africa (Middle East [UAE, Egypt, Saudi Arabia, Qatar, Rest of Middle East], Africa [Nigeria, South Africa, Rest of Africa], Latin America (Brazil, Argentina, Colombia, Rest of Latin America) |
| Company Profiles | Hewlett Packard Enterprise (HPE), International Business Machines Corporation (IBM), Intel Corporation, NVIDIA Corporation, Cray Inc., Fujitsu Limited, Advanced Micro Devices, Inc. (AMD), Lenovo Group Limited, Atos SE, NEC Corporation, Dell Technologies, Microsoft, Amazon Web Services (AWS), Sugon, Google, Alibaba Cloud |
ANS: Exascale Computing Market was valued at USD 3.47 billion in 2023 and is expected to reach USD 29.58 billion by 2032, growing at a CAGR of 26.96% from 2024-2032.
ANS: The Hardware segment led the market with a 54% revenue share in 2023, as high-performance processors, GPUs, and cooling systems remain critical components.
ANS: The On-premises segment held the highest revenue share of 55% in 2023, due to security, data privacy concerns, and the need for real-time, high-performance computing.
ANS: North America dominated with a 36% market share, driven by strong government funding, research initiatives, and advancements in defense and AI applications.
ANS: Increasing demand for high-performance computing in AI, industrial automation, and scientific research is pushing organizations to adopt exascale systems at a rapid pace.
Table of Contents:
1. Introduction
1.1 Market Definition
1.2 Scope (Inclusion and Exclusions)
1.3 Research Assumptions
2. Executive Summary
2.1 Market Overview
2.2 Regional Synopsis
2.3 Competitive Summary
3. Research Methodology
3.1 Top-Down Approach
3.2 Bottom-up Approach
3.3. Data Validation
3.4 Primary Interviews
4. Market Dynamics Impact Analysis
4.1 Market Driving Factors Analysis
4.1.1 Drivers
4.1.2 Restraints
4.1.3 Opportunities
4.1.4 Challenges
4.2 PESTLE Analysis
4.3 Porter’s Five Forces Model
5. Statistical Insights and Trends Reporting
5.1 Adoption Rate
5.2 R&D Spending
5.3 Energy Efficiency Metrics
5.4 Funding & Investment Trends
5.5 Software & Algorithm Development
6. Competitive Landscape
6.1 List of Major Companies, By Region
6.2 Market Share Analysis, By Region
6.3 Product Benchmarking
6.3.1 Product specifications and features
6.3.2 Pricing
6.4 Strategic Initiatives
6.4.1 Marketing and promotional activities
6.4.2 Distribution and supply chain strategies
6.4.3 Expansion plans and new product launches
6.4.4 Strategic partnerships and collaborations
6.5 Technological Advancements
6.6 Market Positioning and Branding
7. Exascale Computing Market Segmentation, By Component
7.1 Chapter Overview
7.2 Hardware
7.2.1 Hardware Market Trends Analysis (2020-2032)
7.2.2 Hardware Market Size Estimates and Forecasts to 2032 (USD Billion)
7.3 Software
7.3.1 Software Market Trends Analysis (2020-2032)
7.3.2 Software Market Size Estimates and Forecasts to 2032 (USD Billion)
7.4 Services
7.4.1 Services Market Trends Analysis (2020-2032)
7.4.2 Services Market Size Estimates and Forecasts to 2032 (USD Billion)
8. Exascale Computing Market Segmentation, By Deployment
8.1 Chapter Overview
8.2 On-premises
8.2.1 On-premises Market Trends Analysis (2020-2032)
8.2.2 On-premises Market Size Estimates and Forecasts to 2032 (USD Billion)
8.3 Cloud-based
8.3.1 Cloud-based Market Trends Analysis (2020-2032)
8.3.2 Cloud-based Market Size Estimates and Forecasts to 2032 (USD Billion)
9. Exascale Computing Market Segmentation, By End Use
9.1 Chapter Overview
9.2 Government & Defense
9.2.1 Government & Defense Market Trends Analysis (2020-2032)
9.2.2 Government & Defense Market Size Estimates and Forecasts to 2032 (USD Billion)
9.3 Healthcare & Biosciences
9.3.1 Healthcare & Biosciences Market Trends Analysis (2020-2032)
9.3.2 Healthcare & Biosciences Market Size Estimates and Forecasts to 2032 (USD Billion)
9.4 Financial Services
9.4.1 Financial Services Market Trends Analysis (2020-2032)
9.4.2 Financial Services Market Size Estimates and Forecasts to 2032 (USD Billion)
9.5 Research & Academia
9.5.1 Research & Academia Market Trends Analysis (2020-2032)
9.5.2 Research & Academia Market Size Estimates and Forecasts to 2032 (USD Billion)
9.6 Manufacturing & Energy
9.6.1 Manufacturing & Energy Market Trends Analysis (2020-2032)
9.6.2 Manufacturing & Energy Market Size Estimates and Forecasts to 2032 (USD Billion)
9.7 Others
9.7.1 Others Market Trends Analysis (2020-2032)
9.7.2 Others Market Size Estimates and Forecasts to 2032 (USD Billion)
10. Regional Analysis
10.1 Chapter Overview
10.2 North America
10.2.1 Trends Analysis
10.2.2 North America Exascale Computing Market Estimates and Forecasts, by Country (2020-2032) (USD Billion)
10.2.3 North America Exascale Computing Market Estimates and Forecasts, By Component (2020-2032) (USD Billion)
10.2.4 North America Exascale Computing Market Estimates and Forecasts, By Deployment (2020-2032) (USD Billion)
10.2.5 North America Exascale Computing Market Estimates and Forecasts, By End Use (2020-2032) (USD Billion)
10.2.6 USA
10.2.6.1 USA Exascale Computing Market Estimates and Forecasts, By Component (2020-2032) (USD Billion)
10.2.6.2 USA Exascale Computing Market Estimates and Forecasts, By Deployment (2020-2032) (USD Billion)
10.2.6.3 USA Exascale Computing Market Estimates and Forecasts, By End Use (2020-2032) (USD Billion)
10.2.7 Canada
10.2.7.1 Canada Exascale Computing Market Estimates and Forecasts, By Component (2020-2032) (USD Billion)
10.2.7.2 Canada Exascale Computing Market Estimates and Forecasts, By Deployment (2020-2032) (USD Billion)
10.2.7.3 Canada Exascale Computing Market Estimates and Forecasts, By End Use (2020-2032) (USD Billion)
10.2.8 Mexico
10.2.8.1 Mexico Exascale Computing Market Estimates and Forecasts, By Component (2020-2032) (USD Billion)
10.2.8.2 Mexico Exascale Computing Market Estimates and Forecasts, By Deployment (2020-2032) (USD Billion)
10.2.8.3 Mexico Exascale Computing Market Estimates and Forecasts, By End Use (2020-2032) (USD Billion)
10.3 Europe
10.3.1 Eastern Europe
10.3.1.1 Trends Analysis
10.3.1.2 Eastern Europe Exascale Computing Market Estimates and Forecasts, by Country (2020-2032) (USD Billion)
10.3.1.3 Eastern Europe Exascale Computing Market Estimates and Forecasts, By Component (2020-2032) (USD Billion)
10.3.1.4 Eastern Europe Exascale Computing Market Estimates and Forecasts, By Deployment (2020-2032) (USD Billion)
10.3.1.5 Eastern Europe Exascale Computing Market Estimates and Forecasts, By End Use (2020-2032) (USD Billion)
10.3.1.6 Poland
10.3.1.6.1 Poland Exascale Computing Market Estimates and Forecasts, By Component (2020-2032) (USD Billion)
10.3.1.6.2 Poland Exascale Computing Market Estimates and Forecasts, By Deployment (2020-2032) (USD Billion)
10.3.1.6.3 Poland Exascale Computing Market Estimates and Forecasts, By End Use (2020-2032) (USD Billion)
10.3.1.7 Romania
10.3.1.7.1 Romania Exascale Computing Market Estimates and Forecasts, By Component (2020-2032) (USD Billion)
10.3.1.7.2 Romania Exascale Computing Market Estimates and Forecasts, By Deployment (2020-2032) (USD Billion)
10.3.1.7.3 Romania Exascale Computing Market Estimates and Forecasts, By End Use (2020-2032) (USD Billion)
10.3.1.8 Hungary
10.3.1.8.1 Hungary Exascale Computing Market Estimates and Forecasts, By Component (2020-2032) (USD Billion)
10.3.1.8.2 Hungary Exascale Computing Market Estimates and Forecasts, By Deployment (2020-2032) (USD Billion)
10.3.1.8.3 Hungary Exascale Computing Market Estimates and Forecasts, By End Use (2020-2032) (USD Billion)
10.3.1.9 Turkey
10.3.1.9.1 Turkey Exascale Computing Market Estimates and Forecasts, By Component (2020-2032) (USD Billion)
10.3.1.9.2 Turkey Exascale Computing Market Estimates and Forecasts, By Deployment (2020-2032) (USD Billion)
10.3.1.9.3 Turkey Exascale Computing Market Estimates and Forecasts, By End Use (2020-2032) (USD Billion)
10.3.1.10 Rest of Eastern Europe
10.3.1.10.1 Rest of Eastern Europe Exascale Computing Market Estimates and Forecasts, By Component (2020-2032) (USD Billion)
10.3.1.10.2 Rest of Eastern Europe Exascale Computing Market Estimates and Forecasts, By Deployment (2020-2032) (USD Billion)
10.3.1.10.3 Rest of Eastern Europe Exascale Computing Market Estimates and Forecasts, By End Use (2020-2032) (USD Billion)
10.3.2 Western Europe
10.3.2.1 Trends Analysis
10.3.2.2 Western Europe Exascale Computing Market Estimates and Forecasts, by Country (2020-2032) (USD Billion)
10.3.2.3 Western Europe Exascale Computing Market Estimates and Forecasts, By Component (2020-2032) (USD Billion)
10.3.2.4 Western Europe Exascale Computing Market Estimates and Forecasts, By Deployment (2020-2032) (USD Billion)
10.3.2.5 Western Europe Exascale Computing Market Estimates and Forecasts, By End Use (2020-2032) (USD Billion)
10.3.2.6 Germany
10.3.2.6.1 Germany Exascale Computing Market Estimates and Forecasts, By Component (2020-2032) (USD Billion)
10.3.2.6.2 Germany Exascale Computing Market Estimates and Forecasts, By Deployment (2020-2032) (USD Billion)
10.3.2.6.3 Germany Exascale Computing Market Estimates and Forecasts, By End Use (2020-2032) (USD Billion)
10.3.2.7 France
10.3.2.7.1 France Exascale Computing Market Estimates and Forecasts, By Component (2020-2032) (USD Billion)
10.3.2.7.2 France Exascale Computing Market Estimates and Forecasts, By Deployment (2020-2032) (USD Billion)
10.3.2.7.3 France Exascale Computing Market Estimates and Forecasts, By End Use (2020-2032) (USD Billion)
10.3.2.8 UK
10.3.2.8.1 UK Exascale Computing Market Estimates and Forecasts, By Component (2020-2032) (USD Billion)
10.3.2.8.2 UK Exascale Computing Market Estimates and Forecasts, By Deployment (2020-2032) (USD Billion)
10.3.2.8.3 UK Exascale Computing Market Estimates and Forecasts, By End Use (2020-2032) (USD Billion)
10.3.2.9 Italy
10.3.2.9.1 Italy Exascale Computing Market Estimates and Forecasts, By Component (2020-2032) (USD Billion)
10.3.2.9.2 Italy Exascale Computing Market Estimates and Forecasts, By Deployment (2020-2032) (USD Billion)
10.3.2.9.3 Italy Exascale Computing Market Estimates and Forecasts, By End Use (2020-2032) (USD Billion)
10.3.2.10 Spain
10.3.2.10.1 Spain Exascale Computing Market Estimates and Forecasts, By Component (2020-2032) (USD Billion)
10.3.2.10.2 Spain Exascale Computing Market Estimates and Forecasts, By Deployment (2020-2032) (USD Billion)
10.3.2.10.3 Spain Exascale Computing Market Estimates and Forecasts, By End Use (2020-2032) (USD Billion)
10.3.2.11 Netherlands
10.3.2.11.1 Netherlands Exascale Computing Market Estimates and Forecasts, By Component (2020-2032) (USD Billion)
10.3.2.11.2 Netherlands Exascale Computing Market Estimates and Forecasts, By Deployment (2020-2032) (USD Billion)
10.3.2.11.3 Netherlands Exascale Computing Market Estimates and Forecasts, By End Use (2020-2032) (USD Billion)
10.3.2.12 Switzerland
10.3.2.12.1 Switzerland Exascale Computing Market Estimates and Forecasts, By Component (2020-2032) (USD Billion)
10.3.2.12.2 Switzerland Exascale Computing Market Estimates and Forecasts, By Deployment (2020-2032) (USD Billion)
10.3.2.12.3 Switzerland Exascale Computing Market Estimates and Forecasts, By End Use (2020-2032) (USD Billion)
10.3.2.13 Austria
10.3.2.13.1 Austria Exascale Computing Market Estimates and Forecasts, By Component (2020-2032) (USD Billion)
10.3.2.13.2 Austria Exascale Computing Market Estimates and Forecasts, By Deployment (2020-2032) (USD Billion)
10.3.2.13.3 Austria Exascale Computing Market Estimates and Forecasts, By End Use (2020-2032) (USD Billion)
10.3.2.14 Rest of Western Europe
10.3.2.14.1 Rest of Western Europe Exascale Computing Market Estimates and Forecasts, By Component (2020-2032) (USD Billion)
10.3.2.14.2 Rest of Western Europe Exascale Computing Market Estimates and Forecasts, By Deployment (2020-2032) (USD Billion)
10.3.2.14.3 Rest of Western Europe Exascale Computing Market Estimates and Forecasts, By End Use (2020-2032) (USD Billion)
10.4 Asia Pacific
10.4.1 Trends Analysis
10.4.2 Asia Pacific Exascale Computing Market Estimates and Forecasts, by Country (2020-2032) (USD Billion)
10.4.3 Asia Pacific Exascale Computing Market Estimates and Forecasts, By Component (2020-2032) (USD Billion)
10.4.4 Asia Pacific Exascale Computing Market Estimates and Forecasts, By Deployment (2020-2032) (USD Billion)
10.4.5 Asia Pacific Exascale Computing Market Estimates and Forecasts, By End Use (2020-2032) (USD Billion)
10.4.6 China
10.4.6.1 China Exascale Computing Market Estimates and Forecasts, By Component (2020-2032) (USD Billion)
10.4.6.2 China Exascale Computing Market Estimates and Forecasts, By Deployment (2020-2032) (USD Billion)
10.4.6.3 China Exascale Computing Market Estimates and Forecasts, By End Use (2020-2032) (USD Billion)
10.4.7 India
10.4.7.1 India Exascale Computing Market Estimates and Forecasts, By Component (2020-2032) (USD Billion)
10.4.7.2 India Exascale Computing Market Estimates and Forecasts, By Deployment (2020-2032) (USD Billion)
10.4.7.3 India Exascale Computing Market Estimates and Forecasts, By End Use (2020-2032) (USD Billion)
10.4.8 Japan
10.4.8.1 Japan Exascale Computing Market Estimates and Forecasts, By Component (2020-2032) (USD Billion)
10.4.8.2 Japan Exascale Computing Market Estimates and Forecasts, By Deployment (2020-2032) (USD Billion)
10.4.8.3 Japan Exascale Computing Market Estimates and Forecasts, By End Use (2020-2032) (USD Billion)
10.4.9 South Korea
10.4.9.1 South Korea Exascale Computing Market Estimates and Forecasts, By Component (2020-2032) (USD Billion)
10.4.9.2 South Korea Exascale Computing Market Estimates and Forecasts, By Deployment (2020-2032) (USD Billion)
10.4.9.3 South Korea Exascale Computing Market Estimates and Forecasts, By End Use (2020-2032) (USD Billion)
10.4.10 Vietnam
10.4.10.1 Vietnam Exascale Computing Market Estimates and Forecasts, By Component (2020-2032) (USD Billion)
10.4.10.2 Vietnam Exascale Computing Market Estimates and Forecasts, By Deployment (2020-2032) (USD Billion)
10.4.10.3 Vietnam Exascale Computing Market Estimates and Forecasts, By End Use (2020-2032) (USD Billion)
10.4.11 Singapore
10.4.11.1 Singapore Exascale Computing Market Estimates and Forecasts, By Component (2020-2032) (USD Billion)
10.4.11.2 Singapore Exascale Computing Market Estimates and Forecasts, By Deployment (2020-2032) (USD Billion)
10.4.11.3 Singapore Exascale Computing Market Estimates and Forecasts, By End Use (2020-2032) (USD Billion)
10.4.12 Australia
10.4.12.1 Australia Exascale Computing Market Estimates and Forecasts, By Component (2020-2032) (USD Billion)
10.4.12.2 Australia Exascale Computing Market Estimates and Forecasts, By Deployment (2020-2032) (USD Billion)
10.4.12.3 Australia Exascale Computing Market Estimates and Forecasts, By End Use (2020-2032) (USD Billion)
10.4.13 Rest of Asia Pacific
10.4.13.1 Rest of Asia Pacific Exascale Computing Market Estimates and Forecasts, By Component (2020-2032) (USD Billion)
10.4.13.2 Rest of Asia Pacific Exascale Computing Market Estimates and Forecasts, By Deployment (2020-2032) (USD Billion)
10.4.13.3 Rest of Asia Pacific Exascale Computing Market Estimates and Forecasts, By End Use (2020-2032) (USD Billion)
10.5 Middle East and Africa
10.5.1 Middle East
10.5.1.1 Trends Analysis
10.5.1.2 Middle East Exascale Computing Market Estimates and Forecasts, by Country (2020-2032) (USD Billion)
10.5.1.3 Middle East Exascale Computing Market Estimates and Forecasts, By Component (2020-2032) (USD Billion)
10.5.1.4 Middle East Exascale Computing Market Estimates and Forecasts, By Deployment (2020-2032) (USD Billion)
10.5.1.5 Middle East Exascale Computing Market Estimates and Forecasts, By End Use (2020-2032) (USD Billion)
10.5.1.6 UAE
10.5.1.6.1 UAE Exascale Computing Market Estimates and Forecasts, By Component (2020-2032) (USD Billion)
10.5.1.6.2 UAE Exascale Computing Market Estimates and Forecasts, By Deployment (2020-2032) (USD Billion)
10.5.1.6.3 UAE Exascale Computing Market Estimates and Forecasts, By End Use (2020-2032) (USD Billion)
10.5.1.7 Egypt
10.5.1.7.1 Egypt Exascale Computing Market Estimates and Forecasts, By Component (2020-2032) (USD Billion)
10.5.1.7.2 Egypt Exascale Computing Market Estimates and Forecasts, By Deployment (2020-2032) (USD Billion)
10.5.1.7.3 Egypt Exascale Computing Market Estimates and Forecasts, By End Use (2020-2032) (USD Billion)
10.5.1.8 Saudi Arabia
10.5.1.8.1 Saudi Arabia Exascale Computing Market Estimates and Forecasts, By Component (2020-2032) (USD Billion)
10.5.1.8.2 Saudi Arabia Exascale Computing Market Estimates and Forecasts, By Deployment (2020-2032) (USD Billion)
10.5.1.8.3 Saudi Arabia Exascale Computing Market Estimates and Forecasts, By End Use (2020-2032) (USD Billion)
10.5.1.9 Qatar
10.5.1.9.1 Qatar Exascale Computing Market Estimates and Forecasts, By Component (2020-2032) (USD Billion)
10.5.1.9.2 Qatar Exascale Computing Market Estimates and Forecasts, By Deployment (2020-2032) (USD Billion)
10.5.1.9.3 Qatar Exascale Computing Market Estimates and Forecasts, By End Use (2020-2032) (USD Billion)
10.5.1.10 Rest of Middle East
10.5.1.10.1 Rest of Middle East Exascale Computing Market Estimates and Forecasts, By Component (2020-2032) (USD Billion)
10.5.1.10.2 Rest of Middle East Exascale Computing Market Estimates and Forecasts, By Deployment (2020-2032) (USD Billion)
10.5.1.10.3 Rest of Middle East Exascale Computing Market Estimates and Forecasts, By End Use (2020-2032) (USD Billion)
10.5.2 Africa
10.5.2.1 Trends Analysis
10.5.2.2 Africa Exascale Computing Market Estimates and Forecasts, by Country (2020-2032) (USD Billion)
10.5.2.3 Africa Exascale Computing Market Estimates and Forecasts, By Component (2020-2032) (USD Billion)
10.5.2.4 Africa Exascale Computing Market Estimates and Forecasts, By Deployment (2020-2032) (USD Billion)
10.5.2.5 Africa Exascale Computing Market Estimates and Forecasts, By End Use (2020-2032) (USD Billion)
10.5.2.6 South Africa
10.5.2.6.1 South Africa Exascale Computing Market Estimates and Forecasts, By Component (2020-2032) (USD Billion)
10.5.2.6.2 South Africa Exascale Computing Market Estimates and Forecasts, By Deployment (2020-2032) (USD Billion)
10.5.2.6.3 South Africa Exascale Computing Market Estimates and Forecasts, By End Use (2020-2032) (USD Billion)
10.5.2.7 Nigeria
10.5.2.7.1 Nigeria Exascale Computing Market Estimates and Forecasts, By Component (2020-2032) (USD Billion)
10.5.2.7.2 Nigeria Exascale Computing Market Estimates and Forecasts, By Deployment (2020-2032) (USD Billion)
10.5.2.7.3 Nigeria Exascale Computing Market Estimates and Forecasts, By End Use (2020-2032) (USD Billion)
10.5.2.8 Rest of Africa
10.5.2.8.1 Rest of Africa Exascale Computing Market Estimates and Forecasts, By Component (2020-2032) (USD Billion)
10.5.2.8.2 Rest of Africa Exascale Computing Market Estimates and Forecasts, By Deployment (2020-2032) (USD Billion)
10.5.2.8.3 Rest of Africa Exascale Computing Market Estimates and Forecasts, By End Use (2020-2032) (USD Billion)
10.6 Latin America
10.6.1 Trends Analysis
10.6.2 Latin America Exascale Computing Market Estimates and Forecasts, by Country (2020-2032) (USD Billion)
10.6.3 Latin America Exascale Computing Market Estimates and Forecasts, By Component (2020-2032) (USD Billion)
10.6.4 Latin America Exascale Computing Market Estimates and Forecasts, By Deployment (2020-2032) (USD Billion)
10.6.5 Latin America Exascale Computing Market Estimates and Forecasts, By End Use (2020-2032) (USD Billion)
10.6.6 Brazil
10.6.6.1 Brazil Exascale Computing Market Estimates and Forecasts, By Component (2020-2032) (USD Billion)
10.6.6.2 Brazil Exascale Computing Market Estimates and Forecasts, By Deployment (2020-2032) (USD Billion)
10.6.6.3 Brazil Exascale Computing Market Estimates and Forecasts, By End Use (2020-2032) (USD Billion)
10.6.7 Argentina
10.6.7.1 Argentina Exascale Computing Market Estimates and Forecasts, By Component (2020-2032) (USD Billion)
10.6.7.2 Argentina Exascale Computing Market Estimates and Forecasts, By Deployment (2020-2032) (USD Billion)
10.6.7.3 Argentina Exascale Computing Market Estimates and Forecasts, By End Use (2020-2032) (USD Billion)
10.6.8 Colombia
10.6.8.1 Colombia Exascale Computing Market Estimates and Forecasts, By Component (2020-2032) (USD Billion)
10.6.8.2 Colombia Exascale Computing Market Estimates and Forecasts, By Deployment (2020-2032) (USD Billion)
10.6.8.3 Colombia Exascale Computing Market Estimates and Forecasts, By End Use (2020-2032) (USD Billion)
10.6.9 Rest of Latin America
10.6.9.1 Rest of Latin America Exascale Computing Market Estimates and Forecasts, By Component (2020-2032) (USD Billion)
10.6.9.2 Rest of Latin America Exascale Computing Market Estimates and Forecasts, By Deployment (2020-2032) (USD Billion)
10.6.9.3 Rest of Latin America Exascale Computing Market Estimates and Forecasts, By End Use (2020-2032) (USD Billion)
11. Company Profiles
11.1 Hewlett Packard Enterprise (HPE)
11.1.1 Company Overview
11.1.2 Financial
11.1.3 Products/ Services Offered
11.1.4 SWOT Analysis
11.2 International Business Machines Corporation (IBM)
11.2.1 Company Overview
11.2.2 Financial
11.2.3 Products/ Services Offered
11.2.4 SWOT Analysis
11.3 Intel Corporation
11.3.1 Company Overview
11.3.2 Financial
11.3.3 Products/ Services Offered
11.3.4 SWOT Analysis
11.4 NVIDIA Corporation
11.4.1 Company Overview
11.4.2 Financial
11.4.3 Products/ Services Offered
11.4.4 SWOT Analysis
11.5 Cray Inc.
11.5.1 Company Overview
11.5.2 Financial
11.5.3 Products/ Services Offered
11.5.4 SWOT Analysis
11.6 Fujitsu Limited
11.6.1 Company Overview
11.6.2 Financial
11.6.3 Products/ Services Offered
11.6.4 SWOT Analysis
11.7 Advanced Micro Devices, Inc. (AMD)
11.7.1 Company Overview
11.7.2 Financial
11.7.3 Products/ Services Offered
11.7.4 SWOT Analysis
11.8 Lenovo Group Limited
11.8.1 Company Overview
11.8.2 Financial
11.8.3 Products/ Services Offered
11.8.4 SWOT Analysis
11.9 Atos SE
11.9.1 Company Overview
11.9.2 Financial
11.9.3 Products/ Services Offered
11.9.4 SWOT Analysis
11.10 NEC Corporation
11.10.1 Company Overview
11.10.2 Financial
11.10.3 Products/ Services Offered
11.10.4 SWOT Analysis
12. Use Cases and Best Practices
13. Conclusion
An accurate research report requires proper strategizing as well as implementation. There are multiple factors involved in the completion of good and accurate research report and selecting the best methodology to compete the research is the toughest part. Since the research reports we provide play a crucial role in any company’s decision-making process, therefore we at SNS Insider always believe that we should choose the best method which gives us results closer to reality. This allows us to reach at a stage wherein we can provide our clients best and accurate investment to output ratio.
Each report that we prepare takes a timeframe of 350-400 business hours for production. Starting from the selection of titles through a couple of in-depth brain storming session to the final QC process before uploading our titles on our website we dedicate around 350 working hours. The titles are selected based on their current market cap and the foreseen CAGR and growth.
The 5 steps process:
Step 1: Secondary Research:
Secondary Research or Desk Research is as the name suggests is a research process wherein, we collect data through the readily available information. In this process we use various paid and unpaid databases which our team has access to and gather data through the same. This includes examining of listed companies’ annual reports, Journals, SEC filling etc. Apart from this our team has access to various associations across the globe across different industries. Lastly, we have exchange relationships with various university as well as individual libraries.

Step 2: Primary Research
When we talk about primary research, it is a type of study in which the researchers collect relevant data samples directly, rather than relying on previously collected data. This type of research is focused on gaining content specific facts that can be sued to solve specific problems. Since the collected data is fresh and first hand therefore it makes the study more accurate and genuine.
We at SNS Insider have divided Primary Research into 2 parts.
Part 1 wherein we interview the KOLs of major players as well as the upcoming ones across various geographic regions. This allows us to have their view over the market scenario and acts as an important tool to come closer to the accurate market numbers. As many as 45 paid and unpaid primary interviews are taken from both the demand and supply side of the industry to make sure we land at an accurate judgement and analysis of the market.
This step involves the triangulation of data wherein our team analyses the interview transcripts, online survey responses and observation of on filed participants. The below mentioned chart should give a better understanding of the part 1 of the primary interview.

Part 2: In this part of primary research the data collected via secondary research and the part 1 of the primary research is validated with the interviews from individual consultants and subject matter experts.
Consultants are those set of people who have at least 12 years of experience and expertise within the industry whereas Subject Matter Experts are those with at least 15 years of experience behind their back within the same space. The data with the help of two main processes i.e., FGDs (Focused Group Discussions) and IDs (Individual Discussions). This gives us a 3rd party nonbiased primary view of the market scenario making it a more dependable one while collation of the data pointers.
Step 3: Data Bank Validation
Once all the information is collected via primary and secondary sources, we run that information for data validation. At our intelligence centre our research heads track a lot of information related to the market which includes the quarterly reports, the daily stock prices, and other relevant information. Our data bank server gets updated every fortnight and that is how the information which we collected using our primary and secondary information is revalidated in real time.

Step 4: QA/QC Process
After all the data collection and validation our team does a final level of quality check and quality assurance to get rid of any unwanted or undesired mistakes. This might include but not limited to getting rid of the any typos, duplication of numbers or missing of any important information. The people involved in this process include technical content writers, research heads and graphics people. Once this process is completed the title gets uploader on our platform for our clients to read it.
Step 5: Final QC/QA Process:
This is the last process and comes when the client has ordered the study. In this process a final QA/QC is done before the study is emailed to the client. Since we believe in giving our clients a good experience of our research studies, therefore, to make sure that we do not lack at our end in any way humanly possible we do a final round of quality check and then dispatch the study to the client.
Key Segments:
By Component
Hardware
Software
Services
By Deployment
On-premises
Cloud-based
By End Use
Government & Defense
Healthcare & Biosciences
Financial Services
Research & Academia
Manufacturing & Energy
Others
Request for Segment Customization as per your Business Requirement: Segment Customization Request
Regional Coverage:
North America
US
Canada
Mexico
Europe
Eastern Europe
Poland
Romania
Hungary
Turkey
Rest of Eastern Europe
Western Europe
Germany
France
UK
Italy
Spain
Netherlands
Switzerland
Austria
Rest of Western Europe
Asia Pacific
China
India
Japan
South Korea
Vietnam
Singapore
Australia
Rest of Asia Pacific
Middle East & Africa
Middle East
UAE
Egypt
Saudi Arabia
Qatar
Rest of Middle East
Africa
Nigeria
South Africa
Rest of Africa
Latin America
Brazil
Argentina
Colombia
Rest of Latin America
Request for Country Level Research Report: Country Level Customization Request
Available Customization
With the given market data, SNS Insider offers customization as per the company’s specific needs. The following customization options are available for the report:
Detailed Volume Analysis
Criss-Cross segment analysis (e.g. Product X Application)
Competitive Product Benchmarking
Geographic Analysis
Additional countries in any of the regions
Customized Data Representation
Detailed analysis and profiling of additional market players
Digital signage market size was valued at USD 25.52 Billion in 2023. It is expected to Reach USD 49.48 Billion by 2032 and grow at a CAGR of 7.65% over the forecast period of 2024-2032.
The IoT-based Asset Tracking and Monitoring Market was valued at USD 4.5 billion in 2023 and will reach USD 13.1 billion and CAGR of 12.69% by 2032.
Video as a Service Market Size was valued at USD 5.53 Billion in 2023 and is expected to reach USD 20.35 Billion by 2032 and grow at a CAGR of 15.58% over the forecast period 2024-2032.
Next-generation Firewall Market was valued at USD 5.22 billion in 2023 and will reach USD 12.87 billion by 2032, growing at a CAGR of 10.59% by 2032
Screen Readers Software Market was valued at USD 96.78 billion in 2023 and is expected to reach USD 405.62 billion by 2032, growing at a CAGR of 17.31% from 2024-2032.
Data Integration Market was valued at USD 13.28 billion in 2023 and is expected to reach USD 37.78 billion by 2032, growing at a CAGR of 12.38% from 2024-2032.

Hi! Click one of our member below to chat on Phone
© 2025 All Rights Reserved by SNS Insider Pvt Ltd


