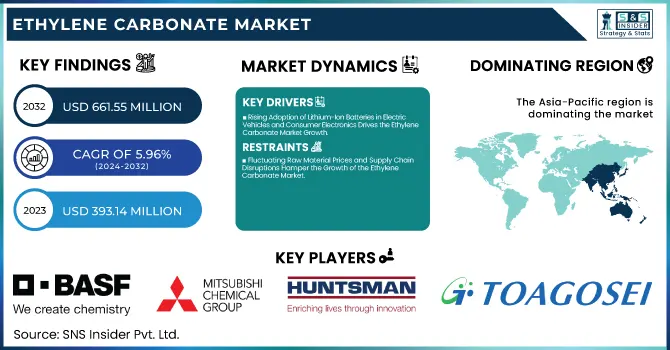
The Ethylene Carbonate Market Size was valued at USD 393.14 Million in 2023 and is expected to reach USD 661.55 Million by 2032, growing at a CAGR of 5.96% over the forecast period of 2024-2032.
The ethylene carbonate market is expanding rapidly, fueled by its demand in lithium-ion batteries, lubricants, and coatings. As manufacturers scale up operations, production capacity analysis reveals supply trends and competitive positioning. Fluctuations in raw material prices, particularly ethylene oxide and dimethyl carbonate, impact production costs, influencing market stability. Ongoing investment and expansion activities, including mergers and facility upgrades, are reshaping the industry landscape. Meanwhile, evolving regulatory frameworks and compliance requirements, such as REACH and EPA mandates, drive manufacturing strategies. Growing environmental concerns make environmental impact analysis essential, assessing sustainability efforts and carbon footprints. Our report provides an exclusive insight into these key factors, offering a comprehensive view of the market’s transformation.
Drivers
Rising Adoption of Lithium-Ion Batteries in Electric Vehicles and Consumer Electronics Drives the Ethylene Carbonate Market Growth
The increasing adoption of lithium-ion batteries in electric vehicles (EVs) and consumer electronics is a significant driver for the ethylene carbonate market. Ethylene carbonate plays a critical role as an electrolyte solvent in lithium-ion batteries due to its high dielectric constant and superior solubility for lithium salts, which enhances battery performance and lifespan. The growing push for sustainable transportation solutions has accelerated EV production, with government incentives and stringent emission regulations encouraging consumers to switch to electric mobility. Major automotive manufacturers are investing heavily in battery technology advancements, increasing demand for high-purity ethylene carbonate. Additionally, the expanding consumer electronics sector, including smartphones, laptops, and wearables, relies on lithium-ion batteries, further driving market growth. The rising need for energy storage solutions, particularly for renewable energy sources like solar and wind power, is another contributing factor. As battery manufacturers strive to improve efficiency, reduce charging times, and enhance battery durability, the demand for high-performance electrolytes such as ethylene carbonate continues to rise. Research in solid-state and next-generation batteries is also gaining momentum, ensuring that ethylene carbonate remains a crucial component in battery innovations. These factors collectively contribute to the long-term expansion of the ethylene carbonate market, making it a key material in the global shift toward electrification and energy storage.
Restraints
Fluctuating Raw Material Prices and Supply Chain Disruptions Hamper the Growth of the Ethylene Carbonate Market
The ethylene carbonate market is highly sensitive to fluctuations in raw material prices, particularly ethylene oxide and dimethyl carbonate, which are derived from petrochemical feedstocks. Any volatility in crude oil prices directly impacts the cost structure of ethylene carbonate production, creating uncertainties for manufacturers. Additionally, disruptions in global supply chains, caused by geopolitical tensions, trade restrictions, or economic downturns, contribute to market instability. The COVID-19 pandemic further exposed vulnerabilities in chemical supply chains, leading to raw material shortages, increased freight costs, and extended lead times. For ethylene carbonate manufacturers, securing a stable and cost-effective supply of raw materials is a major challenge, as price volatility affects profit margins and product pricing strategies. The rising demand for lithium-ion batteries has also intensified competition for high-purity ethylene carbonate, exacerbating supply constraints. Furthermore, unexpected events such as natural disasters, industrial accidents, or regulatory shifts can further disrupt supply chains, adding to market uncertainties. Companies operating in the ethylene carbonate market must develop robust risk management strategies, including diversifying raw material sourcing, securing long-term supplier contracts, and investing in localized production facilities to mitigate the impact of supply chain fluctuations.
Opportunities
Growing Research and Development Investments in Bio-Based Ethylene Carbonate Create New Market Prospects
The increasing emphasis on sustainability and environmental responsibility is driving significant research and development (R&D) investments in bio-based ethylene carbonate production. As industries seek to minimize their carbon footprint and dependency on fossil-based feedstocks, the development of renewable and biodegradable solvents has gained traction. Bio-based ethylene carbonate is derived from renewable sources such as biomass-based carbonates or bio-derived ethylene oxide, making it an attractive alternative to petrochemical-derived variants. Governments worldwide are encouraging the shift toward green chemistry and sustainable industrial practices by offering financial incentives, grants, and subsidies to companies investing in bio-based chemical production. Additionally, stringent environmental regulations on carbon emissions and hazardous chemical waste have compelled manufacturers to explore eco-friendly production pathways. The potential applications of bio-based ethylene carbonate extend beyond traditional sectors, finding uses in specialty coatings, biocompatible lubricants, and environmentally friendly polymer additives. Innovations in catalytic processes and fermentation-based synthesis are further enhancing the feasibility of large-scale bio-based ethylene carbonate production, making it more commercially viable. As consumer awareness of sustainable products grows and industries strive to meet corporate sustainability goals, the demand for bio-based ethylene carbonate is expected to rise significantly. This trend provides an opportunity for manufacturers to differentiate their product portfolios, tap into niche high-value markets, and establish themselves as leaders in green chemical solutions.
Challenge
Technical Challenges in Large-Scale Production of High-Purity Ethylene Carbonate Create Operational Difficulties
The large-scale production of high-purity ethylene carbonate presents significant technical and operational challenges, particularly in industries such as lithium-ion batteries, pharmaceuticals, and high-performance coatings, where stringent purity requirements must be met. The synthesis of ethylene carbonate requires precise catalytic reactions, advanced purification processes, and rigorous quality control measures to ensure minimal contaminant levels. Even small impurities can lead to performance issues in sensitive applications, such as reduced battery efficiency, altered chemical stability in pharmaceutical formulations, or compromised durability in coatings and adhesives. Scaling up production while maintaining consistent quality and purity levels demands high capital investment in state-of-the-art production facilities, making it difficult for smaller manufacturers to compete. Additionally, process optimization, waste management, and energy efficiency improvements are crucial for cost-effective manufacturing, requiring continuous R&D efforts. Another major challenge is the handling and storage of ethylene carbonate, as it is hygroscopic and can degrade under improper storage conditions, affecting its usability in critical applications. Furthermore, with the global shift toward sustainable chemical processes, manufacturers are under pressure to adopt greener and more energy-efficient production techniques, which adds complexity to large-scale operations. As demand for high-purity ethylene carbonate increases, companies must overcome these production challenges by investing in advanced separation technologies, improving feedstock sourcing strategies, and enhancing overall process efficiency to ensure product consistency and long-term market sustainability.
By Form
Liquid ethylene carbonate dominated the market in 2023 with a market share of 55.2%. The dominance of the liquid form is attributed to its widespread use in lithium-ion battery electrolytes, lubricants, and coatings, where its superior solvency and stability offer significant performance benefits. According to the International Energy Agency (IEA), the global electric vehicle market surged by over 35% in 2023, driving the demand for high-purity liquid ethylene carbonate in battery electrolytes. Additionally, the U.S. Environmental Protection Agency (EPA) has promoted the shift toward low-VOC coatings and sustainable lubricants, further accelerating the adoption of liquid ethylene carbonate in eco-friendly formulations. The Asian Clean Energy Coalition has also emphasized the role of high-performance solvents in advancing green energy storage solutions, reinforcing the dominance of liquid ethylene carbonate in multiple high-growth sectors.
By Application
Lithium battery electrolyte dominated the ethylene carbonate market in 2023 with a market share of 35.7%. The rapid expansion of electric vehicles (EVs) and energy storage solutions has made lithium battery electrolytes the largest application segment. According to the European Battery Alliance, lithium-ion battery production in Europe increased significantly in 2023, with companies like Northvolt and CATL expanding their manufacturing facilities. The U.S. Department of Energy (DOE) has also allocated $3.5 billion for domestic lithium-ion battery production, further strengthening demand for ethylene carbonate as a critical electrolyte solvent. With its high dielectric constant and low volatility, ethylene carbonate plays a crucial role in enhancing battery efficiency, stability, and cycle life, solidifying its dominance in this sector.
By End-use
The automotive sector dominated the ethylene carbonate market in 2023 with a market share of 38.6%. The increasing adoption of electric vehicles (EVs) and hybrid vehicles has driven significant demand for ethylene carbonate in lithium-ion battery electrolytes and lubricants. According to the International Council on Clean Transportation (ICCT), global EV sales exceeded 14 million units in 2023, with governments such as China, the U.S., and Germany implementing aggressive EV adoption policies and subsidies. Automakers like Tesla, BYD, and Volkswagen have expanded their battery production capacities, leading to increased consumption of ethylene carbonate in battery manufacturing and thermal management systems. Moreover, the European Union’s push for carbon-neutral mobility by 2035 has further reinforced the automotive sector’s reliance on ethylene carbonate, making it the dominant end-use industry.
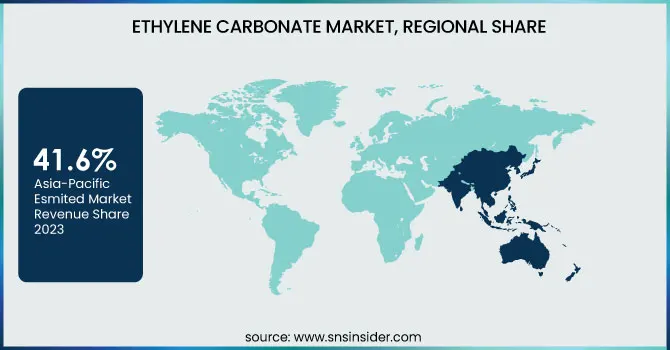
Asia Pacific dominated the ethylene carbonate market in 2023 with a market share of 41.6%. This dominance is driven by the booming electric vehicle (EV) industry, rapid industrialization, and strong lithium-ion battery production in China, Japan, and South Korea. China, the largest contributor, accounted for over 60% of global lithium-ion battery production in 2023, supported by major manufacturers such as CATL, BYD, and LG Energy Solution. According to the China Association of Automobile Manufacturers (CAAM), EV sales in China surged by 37% in 2023, fueling demand for ethylene carbonate in battery electrolytes. Japan and South Korea are key players in battery technology, with Panasonic and Samsung SDI investing in advanced battery materials. Government incentives, such as China’s New Energy Vehicle (NEV) subsidies and South Korea’s Green Growth Initiative, have accelerated the adoption of ethylene carbonate in various industrial applications, solidifying Asia Pacific’s leadership in the market.
North America emerged as the fastest-growing region in the ethylene carbonate market, with a significant growth rate during the forecast period. This growth is driven by increasing investments in EV production, energy storage systems, and sustainable lubricants, particularly in the United States and Canada. The U.S. Department of Energy (DOE) has allocated $3.5 billion for domestic lithium-ion battery manufacturing, attracting companies like Tesla, General Motors, and Ford, which are expanding battery production facilities. Additionally, the Bipartisan Infrastructure Law (BIL) has set aside $7.5 billion for EV charging infrastructure, accelerating demand for high-performance electrolytes in batteries. Canada, with its abundant lithium resources and strategic agreements with battery manufacturers, is emerging as a key supplier of battery raw materials. The North American market’s expansion is further fueled by stringent environmental regulations promoting low-emission lubricants and coatings, making the region a rapidly growing hub for ethylene carbonate applications.
BASF SE (Ethylene Carbonate, Propylene Carbonate, Dimethyl Carbonate)
Mitsubishi Chemical Group Corporation (Ethylene Carbonate, Propylene Carbonate, Ethyl Methyl Carbonate)
Huntsman International LLC (Ethylene Carbonate, Propylene Carbonate, Urethane Intermediates)
Toagosei Co., Ltd. (Ethylene Carbonate, Propylene Carbonate, Speciality Acrylates)
Oriental Union Chemical Corporation (OUCC) (Ethylene Carbonate, Propylene Carbonate, Ethylene Glycol)
Shandong Shida Shenghua Chemical Group Co., Ltd. (Ethylene Carbonate, Propylene Carbonate, Dimethyl Carbonate)
Shandong Senjie Cleantech Co., Ltd. (Ethylene Carbonate, Propylene Carbonate, Lithium Battery Electrolyte Solvents)
Lotte Chemical (Ethylene Carbonate, Propylene Carbonate, Polycarbonate Resins)
Taixing Taida Fine Chemical Co., Ltd. (Ethylene Carbonate, Propylene Carbonate, Lithium Battery Electrolytes)
Zibo Donghai Industries Co., Ltd. (Ethylene Carbonate, Propylene Carbonate, Solvent-Grade Carbonates)
Shandong Haike Chemical Group (Ethylene Carbonate, Propylene Carbonate, Dimethyl Carbonate)
Shandong Lixing Chemical Co., Ltd. (Ethylene Carbonate, Propylene Carbonate, Chemical Intermediates)
Dongying Hi-Tech Spring Chemical Industry Co., Ltd. (Ethylene Carbonate, Propylene Carbonate, Battery-Grade Carbonates)
Liaoning Ganglong Chemical Co., Ltd. (Ethylene Carbonate, Propylene Carbonate, Methyl Carbonate Esters)
Anhui Haoyuan Chemical Group Co., Ltd. (Ethylene Carbonate, Propylene Carbonate, Industrial Solvents)
Inner Mongolia Yuan Xing Energy Co., Ltd. (Ethylene Carbonate, Propylene Carbonate, Battery-Grade Solvents)
Hubei Xian Lin Chemical Co., Ltd. (Ethylene Carbonate, Propylene Carbonate, Lithium Battery Chemicals)
Hengyang New Material Technology Co., Ltd. (Ethylene Carbonate, Propylene Carbonate, Specialty Chemicals)
Shandong Jiahong Chemical Co., Ltd. (Ethylene Carbonate, Propylene Carbonate, Dimethyl Carbonate)
Ube Industries Ltd. (Ethylene Carbonate, Propylene Carbonate, High-Purity Electrolytes)
March 2024: Dow announced plans for a new carbonate solvents facility on the U.S. Gulf Coast to support lithium-ion battery production. The project, backed by the U.S. Department of Energy, will capture over 90% of carbon emissions, aligning with Dow’s decarbonization strategy.
December 2024: Asahi Kasei started operations at its new electrolyte solution plant in China to meet the rising demand for lithium-ion battery materials, enhancing supply chain efficiency for the electric vehicle market.
December 2024: Sailboat commenced commercial production of high-purity ethylene carbonate and dimethyl carbonate, key solvents for lithium-ion battery electrolytes, strengthening the supply chain for electric vehicle battery manufacturing.
Report Attributes | Details |
---|---|
Market Size in 2023 | USD 393.14 Million |
Market Size by 2032 | USD 661.55 Million |
CAGR | CAGR of 5.96% From 2024 to 2032 |
Base Year | 2023 |
Forecast Period | 2024-2032 |
Historical Data | 2020-2022 |
Report Scope & Coverage | Market Size, Segments Analysis, Competitive Landscape, Regional Analysis, DROC & SWOT Analysis, Forecast Outlook |
Key Segments | •By Form (Solid, Liquid) •By Application (Lubricants, Surface Coatings, Lithium Battery Electrolyte, Plasticizers, Others) •By End-use (Automotive, Industrial, Oil & Gas, Medical, Others) |
Regional Analysis/Coverage | North America (US, Canada, Mexico), Europe (Eastern Europe [Poland, Romania, Hungary, Turkey, Rest of Eastern Europe] Western Europe] Germany, France, UK, Italy, Spain, Netherlands, Switzerland, Austria, Rest of Western Europe]), Asia Pacific (China, India, Japan, South Korea, Vietnam, Singapore, Australia, Rest of Asia Pacific), Middle East & Africa (Middle East [UAE, Egypt, Saudi Arabia, Qatar, Rest of Middle East], Africa [Nigeria, South Africa, Rest of Africa], Latin America (Brazil, Argentina, Colombia, Rest of Latin America) |
Company Profiles | BASF SE, Mitsubishi Chemical Group Corporation, Huntsman International LLC, Toagosei Co., Ltd., Oriental Union Chemical Corporation (OUCC), Shandong Shida Shenghua Chemical Group Co., Ltd., Shandong Senjie Cleantech Co., Ltd., Lotte Chemical, Taixing Taida Fine Chemical Co., Ltd., Zibo Donghai Industries Co., Ltd. and other key players |
Ans: The Ethylene Carbonate Market is expected to grow from USD 393.14 Million in 2023 to USD 661.55 Million by 2032 at a CAGR of 5.96%.
Ans: The Ethylene Carbonate Market is affected by fluctuating ethylene oxide and dimethyl carbonate prices, influencing production costs.
Ans: The Ethylene Carbonate Market was led by lithium battery electrolytes with a 35.7% market share, driven by EV expansion.
Ans: The Ethylene Carbonate Market has opportunities in bio-based production due to growing sustainability and regulatory support.
Ans: The Ethylene Carbonate Market was led by Asia Pacific with a 41.6% share, driven by China’s strong lithium-ion battery production.
Table of Contents
1. Introduction
1.1 Market Definition
1.2 Scope (Inclusion and Exclusions)
1.3 Research Assumptions
2. Executive Summary
2.1 Market Overview
2.2 Regional Synopsis
2.3 Competitive Summary
3. Research Methodology
3.1 Top-Down Approach
3.2 Bottom-up Approach
3.3. Data Validation
3.4 Primary Interviews
4. Market Dynamics Impact Analysis
4.1 Market Driving Factors Analysis
4.1.1 Drivers
4.1.2 Restraints
4.1.3 Opportunities
4.1.4 Challenges
4.2 PESTLE Analysis
4.3 Porter’s Five Forces Model
5. Statistical Insights and Trends Reporting
5.1 Production Capacity by Manufacturer
5.2 Raw Material Price Trends
5.3 Investment & Expansion Activities
5.4 Regulatory Framework and Compliance Requirements
5.5 Environmental Impact Analysis
6. Competitive Landscape
6.1 List of Major Companies, By Region
6.2 Market Share Analysis, By Region
6.3 Product Benchmarking
6.3.1 Product specifications and features
6.3.2 Pricing
6.4 Strategic Initiatives
6.4.1 Marketing and promotional activities
6.4.2 Distribution and supply chain strategies
6.4.3 Expansion plans and new product launches
6.4.4 Strategic partnerships and collaborations
6.5 Technological Advancements
6.6 Market Positioning and Branding
7. Ethylene Carbonate Market Segmentation, by Form
7.1 Chapter Overview
7.2 Solid
7.2.1 Solid Market Trends Analysis (2020-2032)
7.2.2 Solid Market Size Estimates and Forecasts to 2032 (USD Million)
7.3 Liquid
7.3.1 Liquid Market Trends Analysis (2020-2032)
7.3.2 Liquid Market Size Estimates and Forecasts to 2032 (USD Million)
8. Ethylene Carbonate Market Segmentation, by Application
8.1 Chapter Overview
8.2 Lubricants
8.2.1 Lubricants Market Trends Analysis (2020-2032)
8.2.2 Lubricants Market Size Estimates and Forecasts to 2032 (USD Million)
8.3 Surface Coatings
8.3.1 Surface Coatings Market Trends Analysis (2020-2032)
8.3.2 Surface Coatings Market Size Estimates and Forecasts to 2032 (USD Million)
8.4 Lithium Battery Electrolyte
8.4.1 Lithium Battery Electrolyte Market Trends Analysis (2020-2032)
8.4.2 Lithium Battery Electrolyte Market Size Estimates and Forecasts to 2032 (USD Million)
8.5 Plasticizers
8.5.1 Plasticizers Market Trends Analysis (2020-2032)
8.5.2 Plasticizers Market Size Estimates and Forecasts to 2032 (USD Million)
8.6 Others
8.6.1 Others Market Trends Analysis (2020-2032)
8.6.2 Others Market Size Estimates and Forecasts to 2032 (USD Million)
9. Ethylene Carbonate Market Segmentation, by End-use
9.1 Chapter Overview
9.2 Automotive
9.2.1 Automotive Market Trends Analysis (2020-2032)
9.2.2 Automotive Market Size Estimates and Forecasts to 2032 (USD Million)
9.3 Industrial
9.3.1 Industrial Market Trends Analysis (2020-2032)
9.3.2 Industrial Market Size Estimates and Forecasts to 2032 (USD Million)
9.4 Oil & Gas
9.4.1 Oil & Gas Market Trends Analysis (2020-2032)
9.4.2 Oil & Gas Market Size Estimates and Forecasts to 2032 (USD Million)
9.5 Medical
9.5.1 Medical Market Trends Analysis (2020-2032)
9.5.2 Medical Market Size Estimates and Forecasts to 2032 (USD Million)
9.6 Others
9.6.1 Others Market Trends Analysis (2020-2032)
9.6.2 Others Market Size Estimates and Forecasts to 2032 (USD Million)
10. Regional Analysis
10.1 Chapter Overview
10.2 North America
10.2.1 Trends Analysis
10.2.2 North America Ethylene Carbonate Market Estimates and Forecasts, by Country (2020-2032) (USD Million)
10.2.3 North America Ethylene Carbonate Market Estimates and Forecasts, by Form (2020-2032) (USD Million)
10.2.4 North America Ethylene Carbonate Market Estimates and Forecasts, by Application (2020-2032) (USD Million)
10.2.5 North America Ethylene Carbonate Market Estimates and Forecasts, by End-use (2020-2032) (USD Million)
10.2.6 USA
10.2.6.1 USA Ethylene Carbonate Market Estimates and Forecasts, by Form (2020-2032) (USD Million)
10.2.6.2 USA Ethylene Carbonate Market Estimates and Forecasts, by Application (2020-2032) (USD Million)
10.2.6.3 USA Ethylene Carbonate Market Estimates and Forecasts, by End-use (2020-2032) (USD Million)
10.2.7 Canada
10.2.7.1 Canada Ethylene Carbonate Market Estimates and Forecasts, by Form (2020-2032) (USD Million)
10.2.7.2 Canada Ethylene Carbonate Market Estimates and Forecasts, by Application (2020-2032) (USD Million)
10.2.7.3 Canada Ethylene Carbonate Market Estimates and Forecasts, by End-use (2020-2032) (USD Million)
10.2.8 Mexico
10.2.8.1 Mexico Ethylene Carbonate Market Estimates and Forecasts, by Form (2020-2032) (USD Million)
10.2.8.2 Mexico Ethylene Carbonate Market Estimates and Forecasts, by Application (2020-2032) (USD Million)
10.2.8.3 Mexico Ethylene Carbonate Market Estimates and Forecasts, by End-use (2020-2032) (USD Million)
10.3 Europe
10.3.1 Eastern Europe
10.3.1.1 Trends Analysis
10.3.1.2 Eastern Europe Ethylene Carbonate Market Estimates and Forecasts, by Country (2020-2032) (USD Million)
10.3.1.3 Eastern Europe Ethylene Carbonate Market Estimates and Forecasts, by Form (2020-2032) (USD Million)
10.3.1.4 Eastern Europe Ethylene Carbonate Market Estimates and Forecasts, by Application (2020-2032) (USD Million)
10.3.1.5 Eastern Europe Ethylene Carbonate Market Estimates and Forecasts, by End-use (2020-2032) (USD Million)
10.3.1.6 Poland
10.3.1.6.1 Poland Ethylene Carbonate Market Estimates and Forecasts, by Form (2020-2032) (USD Million)
10.3.1.6.2 Poland Ethylene Carbonate Market Estimates and Forecasts, by Application (2020-2032) (USD Million)
10.3.1.6.3 Poland Ethylene Carbonate Market Estimates and Forecasts, by End-use (2020-2032) (USD Million)
10.3.1.7 Romania
10.3.1.7.1 Romania Ethylene Carbonate Market Estimates and Forecasts, by Form (2020-2032) (USD Million)
10.3.1.7.2 Romania Ethylene Carbonate Market Estimates and Forecasts, by Application (2020-2032) (USD Million)
10.3.1.7.3 Romania Ethylene Carbonate Market Estimates and Forecasts, by End-use (2020-2032) (USD Million)
10.3.1.8 Hungary
10.3.1.8.1 Hungary Ethylene Carbonate Market Estimates and Forecasts, by Form (2020-2032) (USD Million)
10.3.1.8.2 Hungary Ethylene Carbonate Market Estimates and Forecasts, by Application (2020-2032) (USD Million)
10.3.1.8.3 Hungary Ethylene Carbonate Market Estimates and Forecasts, by End-use (2020-2032) (USD Million)
10.3.1.9 Turkey
10.3.1.9.1 Turkey Ethylene Carbonate Market Estimates and Forecasts, by Form (2020-2032) (USD Million)
10.3.1.9.2 Turkey Ethylene Carbonate Market Estimates and Forecasts, by Application (2020-2032) (USD Million)
10.3.1.9.3 Turkey Ethylene Carbonate Market Estimates and Forecasts, by End-use (2020-2032) (USD Million)
10.3.1.10 Rest of Eastern Europe
10.3.1.10.1 Rest of Eastern Europe Ethylene Carbonate Market Estimates and Forecasts, by Form (2020-2032) (USD Million)
10.3.1.10.2 Rest of Eastern Europe Ethylene Carbonate Market Estimates and Forecasts, by Application (2020-2032) (USD Million)
10.3.1.10.3 Rest of Eastern Europe Ethylene Carbonate Market Estimates and Forecasts, by End-use (2020-2032) (USD Million)
10.3.2 Western Europe
10.3.2.1 Trends Analysis
10.3.2.2 Western Europe Ethylene Carbonate Market Estimates and Forecasts, by Country (2020-2032) (USD Million)
10.3.2.3 Western Europe Ethylene Carbonate Market Estimates and Forecasts, by Form (2020-2032) (USD Million)
10.3.2.4 Western Europe Ethylene Carbonate Market Estimates and Forecasts, by Application (2020-2032) (USD Million)
10.3.2.5 Western Europe Ethylene Carbonate Market Estimates and Forecasts, by End-use (2020-2032) (USD Million)
10.3.2.6 Germany
10.3.2.6.1 Germany Ethylene Carbonate Market Estimates and Forecasts, by Form (2020-2032) (USD Million)
10.3.2.6.2 Germany Ethylene Carbonate Market Estimates and Forecasts, by Application (2020-2032) (USD Million)
10.3.2.6.3 Germany Ethylene Carbonate Market Estimates and Forecasts, by End-use (2020-2032) (USD Million)
10.3.2.7 France
10.3.2.7.1 France Ethylene Carbonate Market Estimates and Forecasts, by Form (2020-2032) (USD Million)
10.3.2.7.2 France Ethylene Carbonate Market Estimates and Forecasts, by Application (2020-2032) (USD Million)
10.3.2.7.3 France Ethylene Carbonate Market Estimates and Forecasts, by End-use (2020-2032) (USD Million)
10.3.2.8 UK
10.3.2.8.1 UK Ethylene Carbonate Market Estimates and Forecasts, by Form (2020-2032) (USD Million)
10.3.2.8.2 UK Ethylene Carbonate Market Estimates and Forecasts, by Application (2020-2032) (USD Million)
10.3.2.8.3 UK Ethylene Carbonate Market Estimates and Forecasts, by End-use (2020-2032) (USD Million)
10.3.2.9 Italy
10.3.2.9.1 Italy Ethylene Carbonate Market Estimates and Forecasts, by Form (2020-2032) (USD Million)
10.3.2.9.2 Italy Ethylene Carbonate Market Estimates and Forecasts, by Application (2020-2032) (USD Million)
10.3.2.9.3 Italy Ethylene Carbonate Market Estimates and Forecasts, by End-use (2020-2032) (USD Million)
10.3.2.10 Spain
10.3.2.10.1 Spain Ethylene Carbonate Market Estimates and Forecasts, by Form (2020-2032) (USD Million)
10.3.2.10.2 Spain Ethylene Carbonate Market Estimates and Forecasts, by Application (2020-2032) (USD Million)
10.3.2.10.3 Spain Ethylene Carbonate Market Estimates and Forecasts, by End-use (2020-2032) (USD Million)
10.3.2.11 Netherlands
10.3.2.11.1 Netherlands Ethylene Carbonate Market Estimates and Forecasts, by Form (2020-2032) (USD Million)
10.3.2.11.2 Netherlands Ethylene Carbonate Market Estimates and Forecasts, by Application (2020-2032) (USD Million)
10.3.2.11.3 Netherlands Ethylene Carbonate Market Estimates and Forecasts, by End-use (2020-2032) (USD Million)
10.3.2.12 Switzerland
10.3.2.12.1 Switzerland Ethylene Carbonate Market Estimates and Forecasts, by Form (2020-2032) (USD Million)
10.3.2.12.2 Switzerland Ethylene Carbonate Market Estimates and Forecasts, by Application (2020-2032) (USD Million)
10.3.2.12.3 Switzerland Ethylene Carbonate Market Estimates and Forecasts, by End-use (2020-2032) (USD Million)
10.3.2.13 Austria
10.3.2.13.1 Austria Ethylene Carbonate Market Estimates and Forecasts, by Form (2020-2032) (USD Million)
10.3.2.13.2 Austria Ethylene Carbonate Market Estimates and Forecasts, by Application (2020-2032) (USD Million)
10.3.2.13.3 Austria Ethylene Carbonate Market Estimates and Forecasts, by End-use (2020-2032) (USD Million)
10.3.2.14 Rest of Western Europe
10.3.2.14.1 Rest of Western Europe Ethylene Carbonate Market Estimates and Forecasts, by Form (2020-2032) (USD Million)
10.3.2.14.2 Rest of Western Europe Ethylene Carbonate Market Estimates and Forecasts, by Application (2020-2032) (USD Million)
10.3.2.14.3 Rest of Western Europe Ethylene Carbonate Market Estimates and Forecasts, by End-use (2020-2032) (USD Million)
10.4 Asia Pacific
10.4.1 Trends Analysis
10.4.2 Asia Pacific Ethylene Carbonate Market Estimates and Forecasts, by Country (2020-2032) (USD Million)
10.4.3 Asia Pacific Ethylene Carbonate Market Estimates and Forecasts, by Form (2020-2032) (USD Million)
10.4.4 Asia Pacific Ethylene Carbonate Market Estimates and Forecasts, by Application (2020-2032) (USD Million)
10.4.5 Asia Pacific Ethylene Carbonate Market Estimates and Forecasts, by End-use (2020-2032) (USD Million)
10.4.6 China
10.4.6.1 China Ethylene Carbonate Market Estimates and Forecasts, by Form (2020-2032) (USD Million)
10.4.6.2 China Ethylene Carbonate Market Estimates and Forecasts, by Application (2020-2032) (USD Million)
10.4.6.3 China Ethylene Carbonate Market Estimates and Forecasts, by End-use (2020-2032) (USD Million)
10.4.7 India
10.4.7.1 India Ethylene Carbonate Market Estimates and Forecasts, by Form (2020-2032) (USD Million)
10.4.7.2 India Ethylene Carbonate Market Estimates and Forecasts, by Application (2020-2032) (USD Million)
10.4.7.3 India Ethylene Carbonate Market Estimates and Forecasts, by End-use (2020-2032) (USD Million)
10.4.8 Japan
10.4.8.1 Japan Ethylene Carbonate Market Estimates and Forecasts, by Form (2020-2032) (USD Million)
10.4.8.2 Japan Ethylene Carbonate Market Estimates and Forecasts, by Application (2020-2032) (USD Million)
10.4.8.3 Japan Ethylene Carbonate Market Estimates and Forecasts, by End-use (2020-2032) (USD Million)
10.4.9 South Korea
10.4.9.1 South Korea Ethylene Carbonate Market Estimates and Forecasts, by Form (2020-2032) (USD Million)
10.4.9.2 South Korea Ethylene Carbonate Market Estimates and Forecasts, by Application (2020-2032) (USD Million)
10.4.9.3 South Korea Ethylene Carbonate Market Estimates and Forecasts, by End-use (2020-2032) (USD Million)
10.4.10 Vietnam
10.4.10.1 Vietnam Ethylene Carbonate Market Estimates and Forecasts, by Form (2020-2032) (USD Million)
10.4.10.2 Vietnam Ethylene Carbonate Market Estimates and Forecasts, by Application (2020-2032) (USD Million)
10.4.10.3 Vietnam Ethylene Carbonate Market Estimates and Forecasts, by End-use (2020-2032) (USD Million)
10.4.11 Singapore
10.4.11.1 Singapore Ethylene Carbonate Market Estimates and Forecasts, by Form (2020-2032) (USD Million)
10.4.11.2 Singapore Ethylene Carbonate Market Estimates and Forecasts, by Application (2020-2032) (USD Million)
10.4.11.3 Singapore Ethylene Carbonate Market Estimates and Forecasts, by End-use (2020-2032) (USD Million)
10.4.12 Australia
10.4.12.1 Australia Ethylene Carbonate Market Estimates and Forecasts, by Form (2020-2032) (USD Million)
10.4.12.2 Australia Ethylene Carbonate Market Estimates and Forecasts, by Application (2020-2032) (USD Million)
10.4.12.3 Australia Ethylene Carbonate Market Estimates and Forecasts, by End-use (2020-2032) (USD Million)
10.4.13 Rest of Asia Pacific
10.4.13.1 Rest of Asia Pacific Ethylene Carbonate Market Estimates and Forecasts, by Form (2020-2032) (USD Million)
10.4.13.2 Rest of Asia Pacific Ethylene Carbonate Market Estimates and Forecasts, by Application (2020-2032) (USD Million)
10.4.13.3 Rest of Asia Pacific Ethylene Carbonate Market Estimates and Forecasts, by End-use (2020-2032) (USD Million)
10.5 Middle East and Africa
10.5.1 Middle East
10.5.1.1 Trends Analysis
10.5.1.2 Middle East Ethylene Carbonate Market Estimates and Forecasts, by Country (2020-2032) (USD Million)
10.5.1.3 Middle East Ethylene Carbonate Market Estimates and Forecasts, by Form (2020-2032) (USD Million)
10.5.1.4 Middle East Ethylene Carbonate Market Estimates and Forecasts, by Application (2020-2032) (USD Million)
10.5.1.5 Middle East Ethylene Carbonate Market Estimates and Forecasts, by End-use (2020-2032) (USD Million)
10.5.1.6 UAE
10.5.1.6.1 UAE Ethylene Carbonate Market Estimates and Forecasts, by Form (2020-2032) (USD Million)
10.5.1.6.2 UAE Ethylene Carbonate Market Estimates and Forecasts, by Application (2020-2032) (USD Million)
10.5.1.6.3 UAE Ethylene Carbonate Market Estimates and Forecasts, by End-use (2020-2032) (USD Million)
10.5.1.7 Egypt
10.5.1.7.1 Egypt Ethylene Carbonate Market Estimates and Forecasts, by Form (2020-2032) (USD Million)
10.5.1.7.2 Egypt Ethylene Carbonate Market Estimates and Forecasts, by Application (2020-2032) (USD Million)
10.5.1.7.3 Egypt Ethylene Carbonate Market Estimates and Forecasts, by End-use (2020-2032) (USD Million)
10.5.1.8 Saudi Arabia
10.5.1.8.1 Saudi Arabia Ethylene Carbonate Market Estimates and Forecasts, by Form (2020-2032) (USD Million)
10.5.1.8.2 Saudi Arabia Ethylene Carbonate Market Estimates and Forecasts, by Application (2020-2032) (USD Million)
10.5.1.8.3 Saudi Arabia Ethylene Carbonate Market Estimates and Forecasts, by End-use (2020-2032) (USD Million)
10.5.1.9 Qatar
10.5.1.9.1 Qatar Ethylene Carbonate Market Estimates and Forecasts, by Form (2020-2032) (USD Million)
10.5.1.9.2 Qatar Ethylene Carbonate Market Estimates and Forecasts, by Application (2020-2032) (USD Million)
10.5.1.9.3 Qatar Ethylene Carbonate Market Estimates and Forecasts, by End-use (2020-2032) (USD Million)
10.5.1.10 Rest of Middle East
10.5.1.10.1 Rest of Middle East Ethylene Carbonate Market Estimates and Forecasts, by Form (2020-2032) (USD Million)
10.5.1.10.2 Rest of Middle East Ethylene Carbonate Market Estimates and Forecasts, by Application (2020-2032) (USD Million)
10.5.1.10.3 Rest of Middle East Ethylene Carbonate Market Estimates and Forecasts, by End-use (2020-2032) (USD Million)
10.5.2 Africa
10.5.2.1 Trends Analysis
10.5.2.2 Africa Ethylene Carbonate Market Estimates and Forecasts, by Country (2020-2032) (USD Million)
10.5.2.3 Africa Ethylene Carbonate Market Estimates and Forecasts, by Form (2020-2032) (USD Million)
10.5.2.4 Africa Ethylene Carbonate Market Estimates and Forecasts, by Application (2020-2032) (USD Million)
10.5.2.5 Africa Ethylene Carbonate Market Estimates and Forecasts, by End-use (2020-2032) (USD Million)
10.5.2.6 South Africa
10.5.2.6.1 South Africa Ethylene Carbonate Market Estimates and Forecasts, by Form (2020-2032) (USD Million)
10.5.2.6.2 South Africa Ethylene Carbonate Market Estimates and Forecasts, by Application (2020-2032) (USD Million)
10.5.2.6.3 South Africa Ethylene Carbonate Market Estimates and Forecasts, by End-use (2020-2032) (USD Million)
10.5.2.7 Nigeria
10.5.2.7.1 Nigeria Ethylene Carbonate Market Estimates and Forecasts, by Form (2020-2032) (USD Million)
10.5.2.7.2 Nigeria Ethylene Carbonate Market Estimates and Forecasts, by Application (2020-2032) (USD Million)
10.5.2.7.3 Nigeria Ethylene Carbonate Market Estimates and Forecasts, by End-use (2020-2032) (USD Million)
10.5.2.8 Rest of Africa
10.5.2.8.1 Rest of Africa Ethylene Carbonate Market Estimates and Forecasts, by Form (2020-2032) (USD Million)
10.5.2.8.2 Rest of Africa Ethylene Carbonate Market Estimates and Forecasts, by Application (2020-2032) (USD Million)
10.5.2.8.3 Rest of Africa Ethylene Carbonate Market Estimates and Forecasts, by End-use (2020-2032) (USD Million)
10.6 Latin America
10.6.1 Trends Analysis
10.6.2 Latin America Ethylene Carbonate Market Estimates and Forecasts, by Country (2020-2032) (USD Million)
10.6.3 Latin America Ethylene Carbonate Market Estimates and Forecasts, by Form (2020-2032) (USD Million)
10.6.4 Latin America Ethylene Carbonate Market Estimates and Forecasts, by Application (2020-2032) (USD Million)
10.6.5 Latin America Ethylene Carbonate Market Estimates and Forecasts, by End-use (2020-2032) (USD Million)
10.6.6 Brazil
10.6.6.1 Brazil Ethylene Carbonate Market Estimates and Forecasts, by Form (2020-2032) (USD Million)
10.6.6.2 Brazil Ethylene Carbonate Market Estimates and Forecasts, by Application (2020-2032) (USD Million)
10.6.6.3 Brazil Ethylene Carbonate Market Estimates and Forecasts, by End-use (2020-2032) (USD Million)
10.6.7 Argentina
10.6.7.1 Argentina Ethylene Carbonate Market Estimates and Forecasts, by Form (2020-2032) (USD Million)
10.6.7.2 Argentina Ethylene Carbonate Market Estimates and Forecasts, by Application (2020-2032) (USD Million)
10.6.7.3 Argentina Ethylene Carbonate Market Estimates and Forecasts, by End-use (2020-2032) (USD Million)
10.6.8 Colombia
10.6.8.1 Colombia Ethylene Carbonate Market Estimates and Forecasts, by Form (2020-2032) (USD Million)
10.6.8.2 Colombia Ethylene Carbonate Market Estimates and Forecasts, by Application (2020-2032) (USD Million)
10.6.8.3 Colombia Ethylene Carbonate Market Estimates and Forecasts, by End-use (2020-2032) (USD Million)
10.6.9 Rest of Latin America
10.6.9.1 Rest of Latin America Ethylene Carbonate Market Estimates and Forecasts, by Form (2020-2032) (USD Million)
10.6.9.2 Rest of Latin America Ethylene Carbonate Market Estimates and Forecasts, by Application (2020-2032) (USD Million)
10.6.9.3 Rest of Latin America Ethylene Carbonate Market Estimates and Forecasts, by End-use (2020-2032) (USD Million)
11. Company Profiles
11.1 BASF SE
11.1.1 Company Overview
11.1.2 Financial
11.1.3 Products/ Services Offered
11.1.4 SWOT Analysis
11.2 Mitsubishi Chemical Group Corporation
11.2.1 Company Overview
11.2.2 Financial
11.2.3 Products/ Services Offered
11.2.4 SWOT Analysis
11.3 Huntsman International LLC
11.3.1 Company Overview
11.3.2 Financial
11.3.3 Products/ Services Offered
11.3.4 SWOT Analysis
11.4 Toagosei Co., Ltd.
11.4.1 Company Overview
11.4.2 Financial
11.4.3 Products/ Services Offered
11.4.4 SWOT Analysis
11.5 Oriental Union Chemical Corporation (OUCC)
11.5.1 Company Overview
11.5.2 Financial
11.5.3 Products/ Services Offered
11.5.4 SWOT Analysis
11.6 Shandong Shida Shenghua Chemical Group Co., Ltd.
11.6.1 Company Overview
11.6.2 Financial
11.6.3 Products/ Services Offered
11.6.4 SWOT Analysis
11.7 Shandong Senjie Cleantech Co., Ltd.
11.7.1 Company Overview
11.7.2 Financial
11.7.3 Products/ Services Offered
11.7.4 SWOT Analysis
11.8 Lotte Chemical
11.8.1 Company Overview
11.8.2 Financial
11.8.3 Products/ Services Offered
11.8.4 SWOT Analysis
11.9 Taixing Taida Fine Chemical Co., Ltd.
11.9.1 Company Overview
11.9.2 Financial
11.9.3 Products/ Services Offered
11.9.4 SWOT Analysis
11.10 Zibo Donghai Industries Co., Ltd.
11.10.1 Company Overview
11.10.2 Financial
11.10.3 Products/ Services Offered
11.10.4 SWOT Analysis
12. Use Cases and Best Practices
13. Conclusion
An accurate research report requires proper strategizing as well as implementation. There are multiple factors involved in the completion of good and accurate research report and selecting the best methodology to compete the research is the toughest part. Since the research reports we provide play a crucial role in any company’s decision-making process, therefore we at SNS Insider always believe that we should choose the best method which gives us results closer to reality. This allows us to reach at a stage wherein we can provide our clients best and accurate investment to output ratio.
Each report that we prepare takes a timeframe of 350-400 business hours for production. Starting from the selection of titles through a couple of in-depth brain storming session to the final QC process before uploading our titles on our website we dedicate around 350 working hours. The titles are selected based on their current market cap and the foreseen CAGR and growth.
The 5 steps process:
Step 1: Secondary Research:
Secondary Research or Desk Research is as the name suggests is a research process wherein, we collect data through the readily available information. In this process we use various paid and unpaid databases which our team has access to and gather data through the same. This includes examining of listed companies’ annual reports, Journals, SEC filling etc. Apart from this our team has access to various associations across the globe across different industries. Lastly, we have exchange relationships with various university as well as individual libraries.
Step 2: Primary Research
When we talk about primary research, it is a type of study in which the researchers collect relevant data samples directly, rather than relying on previously collected data. This type of research is focused on gaining content specific facts that can be sued to solve specific problems. Since the collected data is fresh and first hand therefore it makes the study more accurate and genuine.
We at SNS Insider have divided Primary Research into 2 parts.
Part 1 wherein we interview the KOLs of major players as well as the upcoming ones across various geographic regions. This allows us to have their view over the market scenario and acts as an important tool to come closer to the accurate market numbers. As many as 45 paid and unpaid primary interviews are taken from both the demand and supply side of the industry to make sure we land at an accurate judgement and analysis of the market.
This step involves the triangulation of data wherein our team analyses the interview transcripts, online survey responses and observation of on filed participants. The below mentioned chart should give a better understanding of the part 1 of the primary interview.
Part 2: In this part of primary research the data collected via secondary research and the part 1 of the primary research is validated with the interviews from individual consultants and subject matter experts.
Consultants are those set of people who have at least 12 years of experience and expertise within the industry whereas Subject Matter Experts are those with at least 15 years of experience behind their back within the same space. The data with the help of two main processes i.e., FGDs (Focused Group Discussions) and IDs (Individual Discussions). This gives us a 3rd party nonbiased primary view of the market scenario making it a more dependable one while collation of the data pointers.
Step 3: Data Bank Validation
Once all the information is collected via primary and secondary sources, we run that information for data validation. At our intelligence centre our research heads track a lot of information related to the market which includes the quarterly reports, the daily stock prices, and other relevant information. Our data bank server gets updated every fortnight and that is how the information which we collected using our primary and secondary information is revalidated in real time.
Step 4: QA/QC Process
After all the data collection and validation our team does a final level of quality check and quality assurance to get rid of any unwanted or undesired mistakes. This might include but not limited to getting rid of the any typos, duplication of numbers or missing of any important information. The people involved in this process include technical content writers, research heads and graphics people. Once this process is completed the title gets uploader on our platform for our clients to read it.
Step 5: Final QC/QA Process:
This is the last process and comes when the client has ordered the study. In this process a final QA/QC is done before the study is emailed to the client. Since we believe in giving our clients a good experience of our research studies, therefore, to make sure that we do not lack at our end in any way humanly possible we do a final round of quality check and then dispatch the study to the client.
Key Segments:
By Form
Solid
Liquid
By Application
Lubricants
Surface Coatings
Lithium Battery Electrolyte
Plasticizers
Others
By End-use
Automotive
Industrial
Oil & Gas
Medical
Others
Request for Segment Customization as per your Business Requirement: Segment Customization Request
Regional Coverage:
North America
US
Canada
Mexico
Europe
Eastern Europe
Poland
Romania
Hungary
Turkey
Rest of Eastern Europe
Western Europe
Germany
France
UK
Italy
Spain
Netherlands
Switzerland
Austria
Rest of Western Europe
Asia Pacific
China
India
Japan
South Korea
Vietnam
Singapore
Australia
Rest of Asia Pacific
Middle East & Africa
Middle East
UAE
Egypt
Saudi Arabia
Qatar
Rest of Middle East
Africa
Nigeria
South Africa
Rest of Africa
Latin America
Brazil
Argentina
Colombia
Rest of Latin America
Request for Country Level Research Report: Country Level Customization Request
Available Customization
With the given market data, SNS Insider offers customization as per the company’s specific needs. The following customization options are available for the report:
Detailed Volume Analysis
Criss-Cross segment analysis (e.g. Product X Application)
Competitive Product Benchmarking
Geographic Analysis
Additional countries in any of the regions
Customized Data Representation
Detailed analysis and profiling of additional market players
The Global Chemical Market was valued at USD 3.08 trillion in 2023 and is projected to reach USD 4.95 trillion by 2031, growing at a compound annual growth rate (CAGR) of 6.1% during the forecast period from 2024 to 2031.
The Laminated Glass Market size was valued at USD 22.71 Billion in 2023 and is expected to reach USD 39.18 Billion by 2032, growing at a CAGR of 6.25% over the forecast period 2024-2032.
The Lignin Market Size was valued at USD 1.10 billion in 2023, and is expected to reach USD 1.60 billion by 2032, and grow at a CAGR of 4.3% over the forecast period 2024-2032.
Iron Ore Market size was valued at USD 309.7 billion in 2023 and is expected to reach USD 392.4 billion by 2032, growing at a CAGR of 2.7% from 2024 to 2032.
The Thermic Fluids Market Size was valued at USD 11.6 Billion in 2023 and is expected to reach USD 16.3 Billion by 2032, growing at a CAGR of 3.9% over the forecast period of 2024-2032.
Pharmaceutical Fine Chemicals Market was valued at USD 138.3 Bn in 2023 and is expected to reach USD 255.5 Bn by 2032, growing at a CAGR of 7.1% from 2024-2032.
Hi! Click one of our member below to chat on Phone