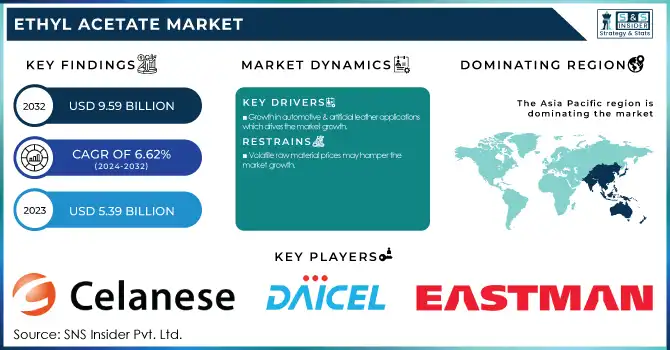
The Ethyl Acetate Market size was USD 5.39 Billion in 2023 and is expected to reach USD 9.59 Billion by 2032 and grow at a CAGR of 6.62% over the forecast period of 2024-2032. This report provides comprehensive statistical insights and trends in the Ethyl Acetate Market, covering production capacity and utilization rates by country and type in 2023. It analyzes feedstock prices and supply chain dynamics, highlighting cost fluctuations and availability. The study examines the regulatory landscape, assessing its impact on production and usage across regions. Environmental metrics such as VOC emissions, waste management, and sustainability initiatives are detailed. The report also explores end-use demand trends in paint & coatings, inks, process solvents, and pharmaceuticals. Additionally, it covers technological advancements and R&D investments in bio-based Ethyl Acetate, reflecting market innovation.
To Get more information on Ethyl Acetate Market - Request Free Sample Report
Drivers
Growth in automotive & artificial leather applications which drives the market growth.
Increasing application in automotive and artificial leather due to solvent properties is likely to accelerate the usage of ethyl acetate over the years, improving coating performance & surface quality. Ethyl acetate is extensively used in automotive paints, clear coatings, and adhesives because of its ability to vaporize quickly and is compatible with polymeric resins, thus providing a high quality and durable finish. At the same time, the manufacture of artificial leather help to ensure that synthetic fibers and polymers are brought together in such a way as to give better texture, quality, and strength of the finished product while retaining the necessary flexibility. The trend of environmentally friendly formulation and increasing environmental regulations has spurred the demand for low-VOC solvents such as ethyl acetate. This dual application across both sectors, and coupled with technological advancements in solvent usage, is helping the overall market flourish.
Restraint
Volatile raw material prices may hamper the market growth.
The prices of raw materials are volatile, more so for certain basic inputs (e.g., ethanol and acetic acid), which contribute to high uncertainty in production costs. Price volatility of these commodities can lead to sudden spikes in cost, and manufacturers may need to undergo a price recalibration process further reducing their margins. This uncertainty makes it extremely challenging for firms to outline investments in capacity expansion and innovation, causing market growth to stagnate. Additionally, the production costs will be higher, which means that prices for the end-user will be higher, resulting in lower overall demand and competitiveness.
Opportunity
Innovation in production technologies creates an opportunity in the market.
The ethyl acetate market is being opened up by innovations in production technologies (in terms of process efficiency and environmental impact). Innovations in catalytic methods and process intensification help manufacturers maximize yield by reducing the potential for waste and energy consumption (Çatal et al. This helps reduce costs as well as tightens compliance with environmental regulations which are ever-closely becoming stringent. Additionally, enhanced production methods allow better consistency and quality of the product, subsequently increasing the number of end-use applications. Moreover, digital monitoring and automation integration offer tighter control over their production parameters, which enhances their efficiency and outputs even further. These innovations can also open new feedstocks but also lessen reliance on traditional feedstock mins, thus decreasing the exposure to high price cycles.
Challenges
Competition from bio-based alternatives may create a challenge for the market.
The market for ethyl acetate has been progressing continually over the years. However, competition offered by bio-based substitutes is a prime restraint for the conventional ethyl acetate market. With increasing awareness towards the environment and stringent regulations, manufacturers are inclined towards bio-based solvents owing to their low VOC emissions and lesser environmental hazard. These alternatives not only fulfil the sustainability ambitions of different industry sectors but also benefit from ongoing technological development that increases their performance and cost efficiency.
By Application
Paint & Coatings held the largest market share, around 54% in 2023. It is a key ingredient for high-performance coatings. The outstanding solvent properties of ethyl acetate allow it to dissolve resins and pigments, facilitating homogeneous disperse and short drying times, which important for high quality of the finish. Additionally, the ability to use it with so many polymers and additives makes Valley Craft even more desirable in this market. In addition to that, the ever-rising need for advanced coating solutions in construction, automotive and consumer goods sectors has further strengthened the dominance of paint & coatings segment in ethyl acetate consumption.
By End Use
Automotive segment held the largest market share around 35% in 2023. It is owing to the wide range of applications of ethyl acetate in the automotive industry, especially in coatings, adhesives, and finishes. Ethyl acetate is useful in automotive paints and coatings for its ability to evaporate quickly to facilitate application and delivery of a smooth, long-lasting finish. A resin that is freely soluble in the solvent and of sufficiently low toxicity to be an attractive production and consumer choice. Ethyl Acetate continues to play a very important role in the automotive sector owing to the fact that the automotive sector is constantly evolving in terms of aesthetic quality in a vehicle along with the functionality of a product and the search for synthetic alternatives that are eco-friendly.
By Distribution Channel
Offline segment held the largest market share around 68% in 2023. It has several established distribution networks, long-standing relationships in traditional industries, and an in-depth reach characterize the larger share of the ethyl acetate market in the offline segment. Offline sales channels like direct sales through distributors and industrial suppliers fulfill the requirements for bulk buying specific to major end-use industries including automotive, pharmaceuticals, and paints & coatings. Customers benefit from convenient access, a large inventory, and on-site technical support in these channels—imperative for continuous supply and timely delivery of chemicals. In addition, offline channels also remain popular due to in-person consultations that provide assurances that specialized products are delivered correctly.
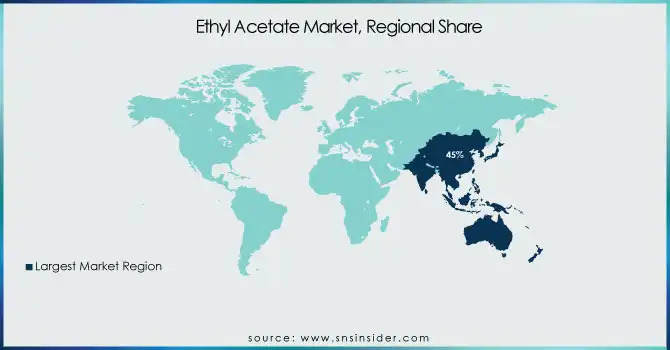
Asia Pacific held the largest market share, around 45% in 2023. It is owing to the rapid industrial growth rate and the growing manufacturing infrastructure in the region. The growth in automotive, paints, coatings, and adhesives sectors in the region is key to a robust ethyl acetate demand since the chemical plays a crucial role in quality finishing and production processes. Well-founded technology investments and many government initiatives stimulating industrialization and growth, have also added to the production capacity of these nations, especially in China and India. It also is one of the preferred production and consumption hubs in the region, driven by comparatively competitive cost structures and a well-established supply chain.
North America held a significant share market share in 2023. It is due to the R&D investments and a mature network of distribution networks provide consistent supply for quality solvents across the region. In addition, strict environmental regulations as well as rapidly increasing consumer demand for low VOC products are providing a strong push toward the replacement of ethyl acetate for various key applications, including automotive coatings, adhesives, and pharmaceuticals. The emergence of several strategic partnerships and the technological advancement in various production processes has further increased the competitiveness in the market, making North America as a gold-point for consumption and production of ethyl acetate.
Get Customized Report as per Your Business Requirement - Enquiry Now
Key Players
Celanese Corporation (Elvacite, Tuffak)
Daicel Corporation (Daijet, Celgreen)
Eastman Chemical Company (Eastman EA, Solusolv)
INEOS (INEOS Ethyl Acetate, INEOS Oxide)
IOL (IOL Ethyl Acetate, IOL PharmaSolv)
Jiangsu SOPO (Group) Co., Ltd. (SOPO Ethyl Acetate, SOPO Solvent)
Jubilant Pharmova Limited (Jubilant Ethyl Acetate, Jubilant PharmaSolv)
KAI CO. LTD. (KAI Acetate, KAI Solvex)
Linde PLC (Linde Ethyl Acetate, Linde Solvents)
Sasol Limited (Sasol Ethyl Acetate, Sasol Solvenx)
SHOWA DENKO KK (SDK Ethyl Acetate, SDK Solvent)
Sipchem (Sipchem Ethyl Acetate, Sipchem Solvent)
Solvay (Solvay Ethyl Acetate, Solvay Acetex)
Yip's Chemical Holdings Limited (Bauhinia Ethyl Acetate, Bauhinia Solvent)
Godavari Biorefineries Ltd. (Godavari Ethyl Acetate, Godavari BioSolv)
Kanoria Chemicals & Industries Limited (Kanoria Ethyl Acetate, Kanoria Solvent)
Sekab Biofuels & Chemicals AB (Sekab Green EA, Sekab BioSolvent)
Merck KGaA (Merck Ethyl Acetate, Merck Solvent)
Shandong Jinyimeng Group Co., Ltd. (Jinyimeng Ethyl Acetate, Jinyimeng Solvent)
Handsome Chemical Co., Ltd. (Handsome Ethyl Acetate, Handsome Solvent)
Recent Development:
In 2023, Eastman Chemical Company implemented eco-friendly production practices for ethyl acetate, focusing on sustainability and reducing environmental impact. The company also introduced advanced process technologies to improve efficiency and product quality.
In 2023, Celanese Corporation expanded its ethyl acetate production capacity to meet the rising market demand. This strategic move aims to strengthen its position in the global solvent market and ensure a consistent supply for key industries.
| Report Attributes | Details |
|---|---|
| Market Size in 2023 | USD 5.39 Billion |
| Market Size by 2032 | USD 9.59 Billion |
| CAGR | CAGR of 6.62% From 2024 to 2032 |
| Base Year | 2023 |
| Forecast Period | 2024-2032 |
| Historical Data | 2020-2022 |
| Report Scope & Coverage | Market Size, Segments Analysis, Competitive Landscape, Regional Analysis, DROC & SWOT Analysis, Forecast Outlook |
| Key Segments | • By Application (Paint & Coatings, Inks, Process Solvents, Pigments, Other) • By End-Use (Artificial Leather, Pharmaceutical, Automotive, Food & Beverage, Packaging, Other) • , By Distribution Channel (Offline, Online) |
| Regional Analysis/Coverage | North America (US, Canada, Mexico), Europe (Eastern Europe [Poland, Romania, Hungary, Turkey, Rest of Eastern Europe] Western Europe] Germany, France, UK, Italy, Spain, Netherlands, Switzerland, Austria, Rest of Western Europe]), Asia Pacific (China, India, Japan, South Korea, Vietnam, Singapore, Australia, Rest of Asia Pacific), Middle East & Africa (Middle East [UAE, Egypt, Saudi Arabia, Qatar, Rest of Middle East], Africa [Nigeria, South Africa, Rest of Africa], Latin America (Brazil, Argentina, Colombia, Rest of Latin America) |
| Company Profiles | Celanese Corporation, Daicel Corporation, Eastman Chemical Company, INEOS, IOL, Jiangsu SOPO (Group) Co., Ltd., Jubilant Pharmova Limited, KAI CO. LTD., Linde PLC, Sasol Limited, SHOWA DENKO KK, Sipchem, Solvay, Yip's Chemical Holdings Limited, Godavari Biorefineries Ltd., Kanoria Chemicals & Industries Limited, Sekab Biofuels & Chemicals AB, Merck KGaA, Shandong Jinyimeng Group Co., Ltd., Handsome Chemical Co., Ltd. |
Ans: The Ethyl Acetate Market was valued at USD 5.39 Billion in 2023.
Ans: The expected CAGR of the global Ethyl Acetate Market during the forecast period is 6.62%
Ans: Automotive will grow rapidly in the Ethyl Acetate Market from 2024-2032.
Ans: Growth in automotive & artificial leather applications which drives the market growth.
Ans: North America led the Ethyl Acetate Market in the region with the highest revenue share in 2023.
Table of Contents
1. Introduction
1.1 Market Definition
1.2 Scope (Inclusion and Exclusions)
1.3 Research Assumptions
2. Executive Summary
2.1 Market Overview
2.2 Regional Synopsis
2.3 Competitive Summary
3. Research Methodology
3.1 Top-Down Approach
3.2 Bottom-up Approach
3.3. Data Validation
3.4 Primary Interviews
4. Market Dynamics Impact Analysis
4.1 Market Driving Factors Analysis
4.1.1 Drivers
4.1.2 Restraints
4.1.3 Opportunities
4.1.4 Challenges
4.2 PESTLE Analysis
4.3 Porter’s Five Forces Model
5. Statistical Insights and Trends Reporting
5.1 By Production Capacity and Utilization, by Country, By Type, 2023
5.2 Feedstock Prices, by Country, By Type, 2023
5.3 Regulatory Impact, by l Country, By Type, 2023.
5.4 Environmental Metrics: Emissions Data, Waste Management Practices, and Sustainability Initiatives, by Region
5.5 Innovation and R&D, Type, 2023
6. Competitive Landscape
6.1 List of Major Companies, By Region
6.2 Market Share Analysis, By Region
6.3 Product Benchmarking
6.3.1 Product specifications and features
6.3.2 Pricing
6.4 Strategic Initiatives
6.4.1 Marketing and promotional activities
6.4.2 Distribution and Supply Chain Strategies
6.4.3 Expansion plans and new Product launches
6.4.4 Strategic partnerships and collaborations
6.5 Technological Advancements
6.6 Market Positioning and Branding
7. Ethyl Acetate Market Segmentation, by Application
7.1 Chapter Overview
7.2 Paint & Coatings
7.2.1 Paint & Coatings Market Trends Analysis (2020-2032)
7.2.2 Paint & Coatings Market Size Estimates and Forecasts to 2032 (USD Billion)
7.3 Inks
7.3.1 Inks Market Trends Analysis (2020-2032)
7.3.2 Inks Market Size Estimates and Forecasts to 2032 (USD Billion)
7.4 Process Solvents
7.4.1 Process Solvents Market Trends Analysis (2020-2032)
7.4.2 Process Solvents Market Size Estimates and Forecasts to 2032 (USD Billion)
7.5 Pigments
7.5.1 Pigments Market Trends Analysis (2020-2032)
7.5.2 Pigments Market Size Estimates and Forecasts to 2032 (USD Billion)
7.6 Other
7.6.1 Other Market Trends Analysis (2020-2032)
7.6.2 Other Market Size Estimates and Forecasts to 2032 (USD Billion)
8. Ethyl Acetate Market Segmentation, End-Use
8.1 Chapter Overview
8.2 Artificial Leather
8.2.1 Artificial Leather Market Trends Analysis (2020-2032)
8.2.2 Artificial Leather Market Size Estimates and Forecasts to 2032 (USD Billion)
8.3 Pharmaceutical
8.3.1 Pharmaceutical Market Trends Analysis (2020-2032)
8.3.2 Pharmaceutical Market Size Estimates and Forecasts to 2032 (USD Billion)
8.4 Automotive
8.4.1 Automotive Market Trends Analysis (2020-2032)
8.4.2 Automotive Market Size Estimates and Forecasts to 2032 (USD Billion)
8.5 Food & Beverages
8.5.1 Food & Beverages Market Trends Analysis (2020-2032)
8.5.2 Food & Beverages Market Size Estimates and Forecasts to 2032 (USD Billion)
8.6 Packaging
8.6.1 Packaging Market Trends Analysis (2020-2032)
8.6.2 Packaging Market Size Estimates and Forecasts to 2032 (USD Billion)
8.7 Other
8.7.1 Other Market Trends Analysis (2020-2032)
8.7.2 Other Market Size Estimates and Forecasts to 2032 (USD Billion)
9. Ethyl Acetate Market Segmentation, by Distribution Channel
9.1 Chapter Overview
9.2 Offline
9.2.1 Offline Market Trends Analysis (2020-2032)
9.2.2 Offline Market Size Estimates and Forecasts to 2032 (USD Billion)
9.3 Online
9.3.1 Online Market Trends Analysis (2020-2032)
9.3.2 Online Market Size Estimates and Forecasts to 2032 (USD Billion)
10. Regional Analysis
10.1 Chapter Overview
10.2 North America
10.2.1 Trends Analysis
10.2.2 North America Ethyl Acetate Market Estimates and Forecasts, by Country (2020-2032) (USD Billion)
10.2.3 North America Ethyl Acetate Market Estimates and Forecasts, by Application (2020-2032) (USD Billion)
10.2.4 North America Ethyl Acetate Market Estimates and Forecasts, End-Use (2020-2032) (USD Billion)
10.2.5 North America Ethyl Acetate Market Estimates and Forecasts, by Distribution Channel (2020-2032) (USD Billion)
10.2.6 USA
10.2.6.1 USA Ethyl Acetate Market Estimates and Forecasts, by Application (2020-2032) (USD Billion)
10.2.6.2 USA Ethyl Acetate Market Estimates and Forecasts, End-Use (2020-2032) (USD Billion)
10.2.6.3 USA Ethyl Acetate Market Estimates and Forecasts, by Distribution Channel (2020-2032) (USD Billion)
10.2.7 Canada
10.2.7.1 Canada Ethyl Acetate Market Estimates and Forecasts, by Application (2020-2032) (USD Billion)
10.2.7.2 Canada Ethyl Acetate Market Estimates and Forecasts, End-Use (2020-2032) (USD Billion)
10.2.7.3 Canada Ethyl Acetate Market Estimates and Forecasts, by Distribution Channel (2020-2032) (USD Billion)
10.2.8 Mexico
10.2.8.1 Mexico Ethyl Acetate Market Estimates and Forecasts, by Application (2020-2032) (USD Billion)
10.2.8.2 Mexico Ethyl Acetate Market Estimates and Forecasts, End-Use (2020-2032) (USD Billion)
10.2.8.3 Mexico Ethyl Acetate Market Estimates and Forecasts, by Distribution Channel (2020-2032) (USD Billion)
10.3 Europe
10.3.1 Eastern Europe
10.3.1.1 Trends Analysis
10.3.1.2 Eastern Europe Ethyl Acetate Market Estimates and Forecasts, by Country (2020-2032) (USD Billion)
10.3.1.3 Eastern Europe Ethyl Acetate Market Estimates and Forecasts, by Application (2020-2032) (USD Billion)
10.3.1.4 Eastern Europe Ethyl Acetate Market Estimates and Forecasts, End-Use (2020-2032) (USD Billion)
10.3.1.5 Eastern Europe Ethyl Acetate Market Estimates and Forecasts, by Distribution Channel (2020-2032) (USD Billion)
10.3.1.6 Poland
10.3.1.6.1 Poland Ethyl Acetate Market Estimates and Forecasts, by Application (2020-2032) (USD Billion)
10.3.1.6.2 Poland Ethyl Acetate Market Estimates and Forecasts, End-Use (2020-2032) (USD Billion)
10.3.1.6.3 Poland Ethyl Acetate Market Estimates and Forecasts, by Distribution Channel (2020-2032) (USD Billion)
10.3.1.7 Romania
10.3.1.7.1 Romania Ethyl Acetate Market Estimates and Forecasts, by Application (2020-2032) (USD Billion)
10.3.1.7.2 Romania Ethyl Acetate Market Estimates and Forecasts, End-Use (2020-2032) (USD Billion)
10.3.1.7.3 Romania Ethyl Acetate Market Estimates and Forecasts, by Distribution Channel (2020-2032) (USD Billion)
10.3.1.8 Hungary
10.3.1.8.1 Hungary Ethyl Acetate Market Estimates and Forecasts, by Application (2020-2032) (USD Billion)
10.3.1.8.2 Hungary Ethyl Acetate Market Estimates and Forecasts, End-Use (2020-2032) (USD Billion)
10.3.1.8.3 Hungary Ethyl Acetate Market Estimates and Forecasts, by Distribution Channel (2020-2032) (USD Billion)
10.3.1.9 Turkey
10.3.1.9.1 Turkey Ethyl Acetate Market Estimates and Forecasts, by Application (2020-2032) (USD Billion)
10.3.1.9.2 Turkey Ethyl Acetate Market Estimates and Forecasts, End-Use (2020-2032) (USD Billion)
10.3.1.9.3 Turkey Ethyl Acetate Market Estimates and Forecasts, by Distribution Channel (2020-2032) (USD Billion)
10.3.1.10 Rest of Eastern Europe
10.3.1.10.1 Rest of Eastern Europe Ethyl Acetate Market Estimates and Forecasts, by Application (2020-2032) (USD Billion)
10.3.1.10.2 Rest of Eastern Europe Ethyl Acetate Market Estimates and Forecasts, End-Use (2020-2032) (USD Billion)
10.3.1.10.3 Rest of Eastern Europe Ethyl Acetate Market Estimates and Forecasts, by Distribution Channel (2020-2032) (USD Billion)
10.3.2 Western Europe
10.3.2.1 Trends Analysis
10.3.2.2 Western Europe Ethyl Acetate Market Estimates and Forecasts, by Country (2020-2032) (USD Billion)
10.3.2.3 Western Europe Ethyl Acetate Market Estimates and Forecasts, by Application (2020-2032) (USD Billion)
10.3.2.4 Western Europe Ethyl Acetate Market Estimates and Forecasts, End-Use (2020-2032) (USD Billion)
10.3.2.5 Western Europe Ethyl Acetate Market Estimates and Forecasts, by Distribution Channel (2020-2032) (USD Billion)
10.3.2.6 Germany
10.3.2.6.1 Germany Ethyl Acetate Market Estimates and Forecasts, by Application (2020-2032) (USD Billion)
10.3.2.6.2 Germany Ethyl Acetate Market Estimates and Forecasts, End-Use (2020-2032) (USD Billion)
10.3.2.6.3 Germany Ethyl Acetate Market Estimates and Forecasts, by Distribution Channel (2020-2032) (USD Billion)
10.3.2.7 France
10.3.2.7.1 France Ethyl Acetate Market Estimates and Forecasts, by Application (2020-2032) (USD Billion)
10.3.2.7.2 France Ethyl Acetate Market Estimates and Forecasts, End-Use (2020-2032) (USD Billion)
10.3.2.7.3 France Ethyl Acetate Market Estimates and Forecasts, by Distribution Channel (2020-2032) (USD Billion)
10.3.2.8 UK
10.3.2.8.1 UK Ethyl Acetate Market Estimates and Forecasts, by Application (2020-2032) (USD Billion)
10.3.2.8.2 UK Ethyl Acetate Market Estimates and Forecasts, End-Use (2020-2032) (USD Billion)
10.3.2.8.3 UK Ethyl Acetate Market Estimates and Forecasts, by Distribution Channel (2020-2032) (USD Billion)
10.3.2.9 Italy
10.3.2.9.1 Italy Ethyl Acetate Market Estimates and Forecasts, by Application (2020-2032) (USD Billion)
10.3.2.9.2 Italy Ethyl Acetate Market Estimates and Forecasts, End-Use (2020-2032) (USD Billion)
10.3.2.9.3 Italy Ethyl Acetate Market Estimates and Forecasts, by Distribution Channel (2020-2032) (USD Billion)
10.3.2.10 Spain
10.3.2.10.1 Spain Ethyl Acetate Market Estimates and Forecasts, by Application (2020-2032) (USD Billion)
10.3.2.10.2 Spain Ethyl Acetate Market Estimates and Forecasts, End-Use (2020-2032) (USD Billion)
10.3.2.10.3 Spain Ethyl Acetate Market Estimates and Forecasts, by Distribution Channel (2020-2032) (USD Billion)
10.3.2.11 Netherlands
10.3.2.11.1 Netherlands Ethyl Acetate Market Estimates and Forecasts, by Application (2020-2032) (USD Billion)
10.3.2.11.2 Netherlands Ethyl Acetate Market Estimates and Forecasts, End-Use (2020-2032) (USD Billion)
10.3.2.11.3 Netherlands Ethyl Acetate Market Estimates and Forecasts, by Distribution Channel (2020-2032) (USD Billion)
10.3.2.12 Switzerland
10.3.2.12.1 Switzerland Ethyl Acetate Market Estimates and Forecasts, by Application (2020-2032) (USD Billion)
10.3.2.12.2 Switzerland Ethyl Acetate Market Estimates and Forecasts, End-Use (2020-2032) (USD Billion)
10.3.2.12.3 Switzerland Ethyl Acetate Market Estimates and Forecasts, by Distribution Channel (2020-2032) (USD Billion)
10.3.2.13 Austria
10.3.2.13.1 Austria Ethyl Acetate Market Estimates and Forecasts, by Application (2020-2032) (USD Billion)
10.3.2.13.2 Austria Ethyl Acetate Market Estimates and Forecasts, End-Use (2020-2032) (USD Billion)
10.3.2.13.3 Austria Ethyl Acetate Market Estimates and Forecasts, by Distribution Channel (2020-2032) (USD Billion)
10.3.2.14 Rest of Western Europe
10.3.2.14.1 Rest of Western Europe Ethyl Acetate Market Estimates and Forecasts, by Application (2020-2032) (USD Billion)
10.3.2.14.2 Rest of Western Europe Ethyl Acetate Market Estimates and Forecasts, End-Use (2020-2032) (USD Billion)
10.3.2.14.3 Rest of Western Europe Ethyl Acetate Market Estimates and Forecasts, by Distribution Channel (2020-2032) (USD Billion)
10.4 Asia Pacific
10.4.1 Trends Analysis
10.4.2 Asia Pacific Ethyl Acetate Market Estimates and Forecasts, by Country (2020-2032) (USD Billion)
10.4.3 Asia Pacific Ethyl Acetate Market Estimates and Forecasts, by Application (2020-2032) (USD Billion)
10.4.4 Asia Pacific Ethyl Acetate Market Estimates and Forecasts, End-Use (2020-2032) (USD Billion)
10.4.5 Asia Pacific Ethyl Acetate Market Estimates and Forecasts, by Distribution Channel (2020-2032) (USD Billion)
10.4.6 China
10.4.6.1 China Ethyl Acetate Market Estimates and Forecasts, by Application (2020-2032) (USD Billion)
10.4.6.2 China Ethyl Acetate Market Estimates and Forecasts, End-Use (2020-2032) (USD Billion)
10.4.6.3 China Ethyl Acetate Market Estimates and Forecasts, by Distribution Channel (2020-2032) (USD Billion)
10.4.7 India
10.4.7.1 India Ethyl Acetate Market Estimates and Forecasts, by Application (2020-2032) (USD Billion)
10.4.7.2 India Ethyl Acetate Market Estimates and Forecasts, End-Use (2020-2032) (USD Billion)
10.4.7.3 India Ethyl Acetate Market Estimates and Forecasts, by Distribution Channel (2020-2032) (USD Billion)
10.4.8 Japan
10.4.8.1 Japan Ethyl Acetate Market Estimates and Forecasts, by Application (2020-2032) (USD Billion)
10.4.8.2 Japan Ethyl Acetate Market Estimates and Forecasts, End-Use (2020-2032) (USD Billion)
10.4.8.3 Japan Ethyl Acetate Market Estimates and Forecasts, by Distribution Channel (2020-2032) (USD Billion)
10.4.9 South Korea
10.4.9.1 South Korea Ethyl Acetate Market Estimates and Forecasts, by Application (2020-2032) (USD Billion)
10.4.9.2 South Korea Ethyl Acetate Market Estimates and Forecasts, End-Use (2020-2032) (USD Billion)
10.4.9.3 South Korea Ethyl Acetate Market Estimates and Forecasts, by Distribution Channel (2020-2032) (USD Billion)
10.4.10 Vietnam
10.4.10.1 Vietnam Ethyl Acetate Market Estimates and Forecasts, by Application (2020-2032) (USD Billion)
10.4.10.2 Vietnam Ethyl Acetate Market Estimates and Forecasts, End-Use (2020-2032) (USD Billion)
10.4.10.3 Vietnam Ethyl Acetate Market Estimates and Forecasts, by Distribution Channel (2020-2032) (USD Billion)
10.4.11 Singapore
10.4.11.1 Singapore Ethyl Acetate Market Estimates and Forecasts, by Application (2020-2032) (USD Billion)
10.4.11.2 Singapore Ethyl Acetate Market Estimates and Forecasts, End-Use (2020-2032) (USD Billion)
10.4.11.3 Singapore Ethyl Acetate Market Estimates and Forecasts, by Distribution Channel (2020-2032) (USD Billion)
10.4.12 Australia
10.4.12.1 Australia Ethyl Acetate Market Estimates and Forecasts, by Application (2020-2032) (USD Billion)
10.4.12.2 Australia Ethyl Acetate Market Estimates and Forecasts, End-Use (2020-2032) (USD Billion)
10.4.12.3 Australia Ethyl Acetate Market Estimates and Forecasts, by Distribution Channel (2020-2032) (USD Billion)
10.4.13 Rest of Asia Pacific
10.4.13.1 Rest of Asia Pacific Ethyl Acetate Market Estimates and Forecasts, by Application (2020-2032) (USD Billion)
10.4.13.2 Rest of Asia Pacific Ethyl Acetate Market Estimates and Forecasts, End-Use (2020-2032) (USD Billion)
10.4.13.3 Rest of Asia Pacific Ethyl Acetate Market Estimates and Forecasts, by Distribution Channel (2020-2032) (USD Billion)
10.5 Middle East and Africa
10.5.1 Middle East
10.5.1.1 Trends Analysis
10.5.1.2 Middle East Ethyl Acetate Market Estimates and Forecasts, by Country (2020-2032) (USD Billion)
10.5.1.3 Middle East Ethyl Acetate Market Estimates and Forecasts, by Application (2020-2032) (USD Billion)
10.5.1.4 Middle East Ethyl Acetate Market Estimates and Forecasts, End-Use (2020-2032) (USD Billion)
10.5.1.5 Middle East Ethyl Acetate Market Estimates and Forecasts, by Distribution Channel (2020-2032) (USD Billion)
10.5.1.6 UAE
10.5.1.6.1 UAE Ethyl Acetate Market Estimates and Forecasts, by Application (2020-2032) (USD Billion)
10.5.1.6.2 UAE Ethyl Acetate Market Estimates and Forecasts, End-Use (2020-2032) (USD Billion)
10.5.1.6.3 UAE Ethyl Acetate Market Estimates and Forecasts, by Distribution Channel (2020-2032) (USD Billion)
10.5.1.7 Egypt
10.5.1.7.1 Egypt Ethyl Acetate Market Estimates and Forecasts, by Application (2020-2032) (USD Billion)
10.5.1.7.2 Egypt Ethyl Acetate Market Estimates and Forecasts, End-Use (2020-2032) (USD Billion)
10.5.1.7.3 Egypt Ethyl Acetate Market Estimates and Forecasts, by Distribution Channel (2020-2032) (USD Billion)
10.5.1.8 Saudi Arabia
10.5.1.8.1 Saudi Arabia Ethyl Acetate Market Estimates and Forecasts, by Application (2020-2032) (USD Billion)
10.5.1.8.2 Saudi Arabia Ethyl Acetate Market Estimates and Forecasts, End-Use (2020-2032) (USD Billion)
10.5.1.8.3 Saudi Arabia Ethyl Acetate Market Estimates and Forecasts, by Distribution Channel (2020-2032) (USD Billion)
10.5.1.9 Qatar
10.5.1.9.1 Qatar Ethyl Acetate Market Estimates and Forecasts, by Application (2020-2032) (USD Billion)
10.5.1.9.2 Qatar Ethyl Acetate Market Estimates and Forecasts, End-Use (2020-2032) (USD Billion)
10.5.1.9.3 Qatar Ethyl Acetate Market Estimates and Forecasts, by Distribution Channel (2020-2032) (USD Billion)
10.5.1.10 Rest of Middle East
10.5.1.10.1 Rest of Middle East Ethyl Acetate Market Estimates and Forecasts, by Application (2020-2032) (USD Billion)
10.5.1.10.2 Rest of Middle East Ethyl Acetate Market Estimates and Forecasts, End-Use (2020-2032) (USD Billion)
10.5.1.10.3 Rest of Middle East Ethyl Acetate Market Estimates and Forecasts, by Distribution Channel (2020-2032) (USD Billion)
10.5.2 Africa
10.5.2.1 Trends Analysis
10.5.2.2 Africa Ethyl Acetate Market Estimates and Forecasts, by Country (2020-2032) (USD Billion)
10.5.2.3 Africa Ethyl Acetate Market Estimates and Forecasts, by Application (2020-2032) (USD Billion)
10.5.2.4 Africa Ethyl Acetate Market Estimates and Forecasts, End-Use (2020-2032) (USD Billion)
10.5.2.5 Africa Ethyl Acetate Market Estimates and Forecasts, by Distribution Channel (2020-2032) (USD Billion)
10.5.2.6 South Africa
10.5.2.6.1 South Africa Ethyl Acetate Market Estimates and Forecasts, by Application (2020-2032) (USD Billion)
10.5.2.6.2 South Africa Ethyl Acetate Market Estimates and Forecasts, End-Use (2020-2032) (USD Billion)
10.5.2.6.3 South Africa Ethyl Acetate Market Estimates and Forecasts, by Distribution Channel (2020-2032) (USD Billion)
10.5.2.7 Nigeria
10.5.2.7.1 Nigeria Ethyl Acetate Market Estimates and Forecasts, by Application (2020-2032) (USD Billion)
10.5.2.7.2 Nigeria Ethyl Acetate Market Estimates and Forecasts, End-Use (2020-2032) (USD Billion)
10.5.2.7.3 Nigeria Ethyl Acetate Market Estimates and Forecasts, by Distribution Channel (2020-2032) (USD Billion)
10.5.2.8 Rest of Africa
10.5.2.8.1 Rest of Africa Ethyl Acetate Market Estimates and Forecasts, by Application (2020-2032) (USD Billion)
10.5.2.8.2 Rest of Africa Ethyl Acetate Market Estimates and Forecasts, End-Use (2020-2032) (USD Billion)
10.5.2.8.3 Rest of Africa Ethyl Acetate Market Estimates and Forecasts, by Distribution Channel (2020-2032) (USD Billion)
10.6 Latin America
10.6.1 Trends Analysis
10.6.2 Latin America Ethyl Acetate Market Estimates and Forecasts, by Country (2020-2032) (USD Billion)
10.6.3 Latin America Ethyl Acetate Market Estimates and Forecasts, by Application (2020-2032) (USD Billion)
10.6.4 Latin America Ethyl Acetate Market Estimates and Forecasts, End-Use (2020-2032) (USD Billion)
10.6.5 Latin America Ethyl Acetate Market Estimates and Forecasts, by Distribution Channel (2020-2032) (USD Billion)
10.6.6 Brazil
10.6.6.1 Brazil Ethyl Acetate Market Estimates and Forecasts, by Application (2020-2032) (USD Billion)
10.6.6.2 Brazil Ethyl Acetate Market Estimates and Forecasts, End-Use (2020-2032) (USD Billion)
10.6.6.3 Brazil Ethyl Acetate Market Estimates and Forecasts, by Distribution Channel (2020-2032) (USD Billion)
10.6.7 Argentina
10.6.7.1 Argentina Ethyl Acetate Market Estimates and Forecasts, by Application (2020-2032) (USD Billion)
10.6.7.2 Argentina Ethyl Acetate Market Estimates and Forecasts, End-Use (2020-2032) (USD Billion)
10.6.7.3 Argentina Ethyl Acetate Market Estimates and Forecasts, by Distribution Channel (2020-2032) (USD Billion)
10.6.8 Colombia
10.6.8.1 Colombia Ethyl Acetate Market Estimates and Forecasts, by Application (2020-2032) (USD Billion)
10.6.8.2 Colombia Ethyl Acetate Market Estimates and Forecasts, End-Use (2020-2032) (USD Billion)
10.6.8.3 Colombia Ethyl Acetate Market Estimates and Forecasts, by Distribution Channel (2020-2032) (USD Billion)
10.6.9 Rest of Latin America
10.6.9.1 Rest of Latin America Ethyl Acetate Market Estimates and Forecasts, by Application (2020-2032) (USD Billion)
10.6.9.2 Rest of Latin America Ethyl Acetate Market Estimates and Forecasts, End-Use (2020-2032) (USD Billion)
10.6.9.3 Rest of Latin America Ethyl Acetate Market Estimates and Forecasts, by Distribution Channel (2020-2032) (USD Billion)
11. Company Profiles
11.1 Celanese Corporation
11.1.1 Company Overview
11.1.2 Financial
11.1.3 Product/ Services Offered
11.1.4 SWOT Analysis
11.2 Eastman Chemical Company
11.2.1 Company Overview
11.2.2 Financial
11.2.3 Product/ Services Offered
11.2.4 SWOT Analysis
11.3 Daicel Corporation
11.3.1 Company Overview
11.3.2 Financial
11.3.3 Product/ Services Offered
11.3.4 SWOT Analysis
11.4 INEOS
11.4.1 Company Overview
11.4.2 Financial
11.4.3 Product/ Services Offered
11.4.4 SWOT Analysis
11.5 IOL
11.5.1 Company Overview
11.5.2 Financial
11.5.3 Product/ Services Offered
11.5.4 SWOT Analysis
11.6 Jiangsu SOPO (Group) Co., Ltd.
11.6.1 Company Overview
11.6.2 Financial
11.6.3 Product/ Services Offered
11.6.4 SWOT Analysis
11.7 Jubilant Pharmova Limited
11.7.1 Company Overview
11.7.2 Financial
11.7.3 Product/ Services Offered
11.7.4 SWOT Analysis
11.8 Linde PLC
11.8.1 Company Overview
11.8.2 Financial
11.8.3 Product/ Services Offered
11.8.4 SWOT Analysis
11.9 Sasol Limited
11.9.1 Company Overview
11.9.2 Financial
11.9.3 Product/ Services Offered
11.9.4 SWOT Analysis
11.10 Godavari Biorefineries Ltd.
11.10.1 Company Overview
11.10.2 Financial
11.10.3 Product/ Services Offered
11.10.4 SWOT Analysis
12. Use Cases and Best Practices
13. Conclusion
An accurate research report requires proper strategizing as well as implementation. There are multiple factors involved in the completion of good and accurate research report and selecting the best methodology to compete the research is the toughest part. Since the research reports we provide play a crucial role in any company’s decision-making process, therefore we at SNS Insider always believe that we should choose the best method which gives us results closer to reality. This allows us to reach at a stage wherein we can provide our clients best and accurate investment to output ratio.
Each report that we prepare takes a timeframe of 350-400 business hours for production. Starting from the selection of titles through a couple of in-depth brain storming session to the final QC process before uploading our titles on our website we dedicate around 350 working hours. The titles are selected based on their current market cap and the foreseen CAGR and growth.
The 5 steps process:
Step 1: Secondary Research:
Secondary Research or Desk Research is as the name suggests is a research process wherein, we collect data through the readily available information. In this process we use various paid and unpaid databases which our team has access to and gather data through the same. This includes examining of listed companies’ annual reports, Journals, SEC filling etc. Apart from this our team has access to various associations across the globe across different industries. Lastly, we have exchange relationships with various university as well as individual libraries.

Step 2: Primary Research
When we talk about primary research, it is a type of study in which the researchers collect relevant data samples directly, rather than relying on previously collected data. This type of research is focused on gaining content specific facts that can be sued to solve specific problems. Since the collected data is fresh and first hand therefore it makes the study more accurate and genuine.
We at SNS Insider have divided Primary Research into 2 parts.
Part 1 wherein we interview the KOLs of major players as well as the upcoming ones across various geographic regions. This allows us to have their view over the market scenario and acts as an important tool to come closer to the accurate market numbers. As many as 45 paid and unpaid primary interviews are taken from both the demand and supply side of the industry to make sure we land at an accurate judgement and analysis of the market.
This step involves the triangulation of data wherein our team analyses the interview transcripts, online survey responses and observation of on filed participants. The below mentioned chart should give a better understanding of the part 1 of the primary interview.

Part 2: In this part of primary research the data collected via secondary research and the part 1 of the primary research is validated with the interviews from individual consultants and subject matter experts.
Consultants are those set of people who have at least 12 years of experience and expertise within the industry whereas Subject Matter Experts are those with at least 15 years of experience behind their back within the same space. The data with the help of two main processes i.e., FGDs (Focused Group Discussions) and IDs (Individual Discussions). This gives us a 3rd party nonbiased primary view of the market scenario making it a more dependable one while collation of the data pointers.
Step 3: Data Bank Validation
Once all the information is collected via primary and secondary sources, we run that information for data validation. At our intelligence centre our research heads track a lot of information related to the market which includes the quarterly reports, the daily stock prices, and other relevant information. Our data bank server gets updated every fortnight and that is how the information which we collected using our primary and secondary information is revalidated in real time.

Step 4: QA/QC Process
After all the data collection and validation our team does a final level of quality check and quality assurance to get rid of any unwanted or undesired mistakes. This might include but not limited to getting rid of the any typos, duplication of numbers or missing of any important information. The people involved in this process include technical content writers, research heads and graphics people. Once this process is completed the title gets uploader on our platform for our clients to read it.
Step 5: Final QC/QA Process:
This is the last process and comes when the client has ordered the study. In this process a final QA/QC is done before the study is emailed to the client. Since we believe in giving our clients a good experience of our research studies, therefore, to make sure that we do not lack at our end in any way humanly possible we do a final round of quality check and then dispatch the study to the client.
Key Segments:
By Application
Paint & Coatings
Inks
Process Solvents
Pigments
Other
By End-Use
Artificial Leather
Pharmaceutical
Automotive
Food & Beverage
Packaging
Other
By Distribution Channel
Offline
Online
Request for Segment Customization as per your Business Requirement: Segment Customization Request
Regional Coverage:
North America
US
Canada
Mexico
Europe
Eastern Europe
Poland
Romania
Hungary
Turkey
Rest of Eastern Europe
Western Europe
Germany
France
UK
Italy
Spain
Netherlands
Switzerland
Austria
Rest of Western Europe
Asia Pacific
China
India
Japan
South Korea
Vietnam
Singapore
Australia
Rest of Asia Pacific
Middle East & Africa
Middle East
UAE
Egypt
Saudi Arabia
Qatar
Rest of Middle East
Africa
Nigeria
South Africa
Rest of Africa
Latin America
Brazil
Argentina
Colombia
Rest of Latin America
Request for Country Level Research Report: Country Level Customization Request
Available Customization
With the given market data, SNS Insider offers customization as per the company’s specific needs. The following customization options are available for the report:
Detailed Volume Analysis
Criss-Cross segment analysis (e.g. Product X Application)
Competitive Product Benchmarking
Geographic Analysis
Additional countries in any of the regions
Customized Data Representation
Detailed analysis and profiling of additional market players
The Liquid Ring Vacuum Pumps Market Size was USD 1.5 billion in 2023 and is expected to reach USD 2.4 Bn by 2032 and grow at a CAGR of 5.3% by 2024-2032.
The Sustainable Apparel Market Size was valued at USD 11.20 billion in 2023 and will reach USD 24.53 billion by 2032, & grow at a CAGR of 9.1% by 2024-2032.
The Bitumen Market size was valued at USD 55.9 Billion in 2023. It is expected to grow to USD 76.6 Billion by 2032 and grow at a CAGR of 3.6% by 2024-2032.
The Prepreg market size was valued at USD 10.62 billion in 2023 and is expected to reach USD 27 billion by 2032 and grow at a CAGR of 10.93% over the forecast period 2024-2032.
The Glass Manufacturing Market Size was USD 118.9 billion in 2023 and is expected to reach USD 210.1 billion by 2032 and grow at a CAGR of 6.5% by 2024-2032.
The Vanillic Acid Market size was valued at USD 19.82 billion in 2023 and is expected to grow to USD 24.52 billion by 2032 and grow at a CAGR of 2.39% over the forecast period of 2024-2032.

Hi! Click one of our member below to chat on Phone
© 2025 All Rights Reserved by SNS Insider Pvt Ltd


