Ethernet Storage Fabric Market Size & Growth:
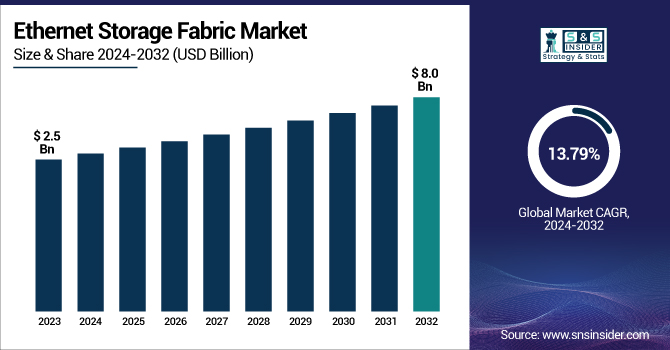
The Ethernet Storage Fabric Market was valued at USD 2.5 billion in 2023 and is expected to reach USD 8.0 billion by 2032, growing at a CAGR of 13.79% from 2024-2032.
To Get more information on Ethernet Storage Fabric Market - Request Free Sample Report
The Market is experiencing strong momentum, fueled by the growing need for high-speed and scalable storage networking solutions across modern data centers. In 2023, deployment volumes showed significant regional concentration, with North America and Asia-Pacific leading due to widespread adoption in hyperscale and cloud-native environments. Network architecture trends indicate a clear shift from traditional Fibre Channel-based systems to more advanced technologies such as NVMe over Fabrics and RDMA over Converged Ethernet, enhancing performance and flexibility. Data centers are reporting higher port utilization rates, particularly for 100G and 400G Ethernet, reflecting the rising traffic and need for low-latency access.
Additionally, metrics on latency and throughput show that ESF solutions consistently deliver superior performance compared to legacy systems, especially in AI-driven and high-performance workloads. This report also brings new insights into the evolution of software-defined storage fabrics, vendor innovation strategies, and the growing integration of ESF technologies with automation and AI-enabled data center infrastructures.
The U.S. Ethernet Storage Fabric market was valued at USD 0.7 billion in 2023 and is expected to reach USD 2.2 billion by 2032, growing at a CAGR of 13.51% from 2024-2032, driven by expanding data centers, increased adoption of NVMe-oF and RoCE technologies, and rising AI and cloud workloads. Enterprises are favoring ESF solutions for their low latency, scalability, and cost-effectiveness over legacy Fibre Channel systems.
Ethernet Storage Fabric Market Dynamics
Driver
-
Rising data volumes and latency-sensitive workloads are driving adoption of high-speed Ethernet storage fabrics.
The rapid rise in cloud computing, AI/ML workloads, and real-time analytics is driving the demand for high-performance, low-latency storage networks. Ethernet Storage Fabric (ESF) technologies such as NVMe-oF and RoCE are becoming essential in modern data centers due to their ability to handle massive data transfers with minimal delay. These fabrics support scalability, improved throughput, and simplified network management, which are critical for enterprises moving to cloud-native and hybrid environments. Additionally, the shift from Fibre Channel to Ethernet-based solutions offers better cost efficiency and interoperability, encouraging broader adoption across sectors like BFSI, telecom, and healthcare, especially in North America and Asia-Pacific.
Restraint
-
High deployment costs and compatibility issues with older systems hinder widespread ESF adoption.
Despite its performance advantages, the high initial cost of deploying Ethernet Storage Fabric solutions remains a key barrier, especially for small and mid-sized enterprises. Integrating ESF into existing infrastructure often requires significant hardware upgrades, including switches, NICs, and cabling. Furthermore, compatibility issues with legacy Fibre Channel or traditional storage area networks can complicate implementation, requiring customized configurations or dual-stack setups. This not only increases upfront investments but also demands skilled IT personnel for deployment and ongoing management. For organizations with tight budgets or limited IT capabilities, these hurdles can delay or deter migration to ESF technologies, slowing market growth in certain regions.
Opportunity
-
The global expansion of hyperscale and edge data centers is creating strong demand for scalable ESF solutions.
The surge in hyperscale and edge data centers globally presents a major growth opportunity for the Ethernet Storage Fabric market. Hyperscalers are increasingly deploying ESF solutions to support petabyte-scale data movement with minimal latency, critical for handling AI model training and big data workloads. Similarly, edge data centers require lightweight and high-speed storage fabrics to process data closer to the source, enhancing performance and reducing backhaul costs. The ongoing expansion of 5G, IoT, and real-time applications further amplifies this demand. Vendors offering flexible, software-defined ESF architectures are well-positioned to capitalize on this growing need for efficient, scalable storage infrastructure.
Challenge
-
Multivendor setups complicate ESF deployment due to integration, compatibility, and performance issues.
As organizations adopt Ethernet Storage Fabric solutions, managing complex, multivendor environments becomes increasingly challenging. Interoperability between products from different vendors—such as switches, adapters, and management software—can lead to integration issues, configuration mismatches, and performance inconsistencies. Ensuring end-to-end visibility, security, and optimization across diverse systems requires advanced network management tools and skilled personnel, adding to operational overhead. Furthermore, the lack of standardized protocols across vendors can result in vendor lock-in or limited flexibility. Addressing these challenges requires coordinated industry efforts, including the development of open standards and robust certification programs, to facilitate seamless interoperability and ease the deployment of ESF across enterprises.
Ethernet Storage Fabric Industry Segmentation Analysis
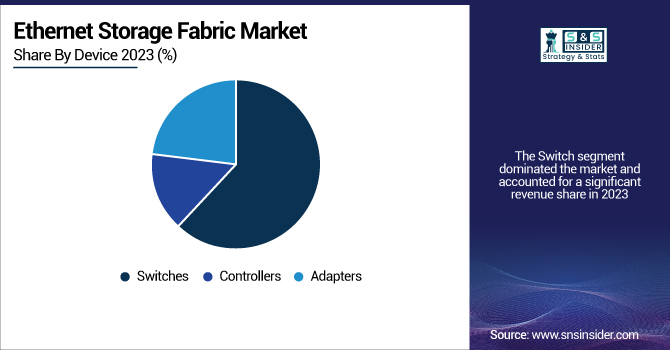
By Device
The switch segment dominated the market and accounted for a significant revenue share in 2023, owing to its usefulness in managing data flow over high-performance networks, seamlessly handling high-volume traffic. They are crucial in data centers as they can manage greater bandwidth and uphold protocols such as 25G/100G/400G Ethernet and work in conjunction with leading protocols such as NVMe-oF and RoCE. As enterprises and hyperscalers scale their operations, the demand for intelligent, low-latency switching infrastructure continues to grow.
The Adapters segment is anticipated to grow at a fast rate in the Ethernet Storage Fabric market, owing to the increasing adoption of RDMA-enabled interfaces and NVMe-over-Fabrics protocols. With enterprises emerging a demand for ultra-low latency and high throughput for their AI, machine learning, and big data workloads, high-performance adapters — particularly 100G and 200G—are becoming possible. Strides made from traditional SANs over to Ethernet-based storage networks further create demand for smart adapters that maximize protocol efficiency while keeping CPU overhead to a minimum.
By Switching
The 100 GbE and above segment dominated the Ethernet Storage Fabric market and accounted for owing to its ability to meet the bandwidth, speed, and low-latency requirements of modern data centers and high-performance workloads. With the rapid rise of hyperscale infrastructure, AI/ML processing, and NVMe-oF storage protocols, enterprises increasingly rely on 100G+ Ethernet for seamless data flow and scalability. This segment will continue to lead through 2032, driven by continual network upgrades, growing traffic volumes, and vendor innovations in 200G and 400G switching solutions for next-gen cloud and edge deployments.
The 40 GbE to 50 GbE segment is expected to register the fastest CAGR due to its strong adoption among mid-sized enterprises and data centers undergoing phased upgrades from 10/25 GbE infrastructure. This port range provides a balance between performance and cost-efficiency, making it ideal for organizations seeking improved throughput without the full cost of 100G+ solutions. As digital transformation accelerates across industries and demand for higher data rates grows, this segment will see rapid growth through 2030, especially in edge computing and private cloud environments requiring moderate bandwidth enhancements.
By Type
In 2023, Block storage dominated the Ethernet Storage Fabric market due to its high performance, low latency, and ability to handle transactional workloads efficiently. It is the preferred choice for enterprise databases, virtual machines, and mission-critical applications requiring fast and consistent data access. With increasing adoption of NVMe-over-Fabrics and the migration of core workloads to cloud and hybrid environments, block storage remains central to enterprise infrastructure. This segment is expected to maintain its dominance through 2032, supported by advancements in high-speed Ethernet switching and enterprise storage modernization efforts.
Hyper-Converged Infrastructure (HCI) is expected to register the fastest CAGR, driven by growing enterprise demand for simplified, scalable, and software-defined storage solutions. HCI integrates compute, storage, and networking into a single system, making it ideal for edge deployments, VDI, and private cloud environments. As organizations seek to reduce hardware complexity and increase deployment flexibility, HCI adoption is surging. Combined with Ethernet Storage Fabrics, HCI systems can achieve improved throughput and performance. Through 2030, the segment is forecasted to grow rapidly, especially among mid-sized enterprises and service providers embracing digital transformation.
By Application
The telecommunications segment dominated the Ethernet Storage Fabric market in 2023 due to the sector’s massive data demands, driven by 5G rollouts, edge computing, and increasing subscriber bases. Telcos require high-speed, low-latency infrastructure to manage real-time traffic, streaming services, and virtual network functions. Ethernet Storage Fabrics offer the scalability and throughput essential for these dynamic environments. With telecom operators continuing to invest in network modernization and distributed cloud infrastructure, this segment is expected to sustain its dominance through 2032, particularly in North America, Asia-Pacific, and parts of Europe.
Manufacturing & processing is expected to register the fastest CAGR, fueled by Industry 4.0 initiatives, automation, and smart factory implementations. Ethernet Storage Fabrics enable rapid data exchange between machines, sensors, and analytics platforms, supporting predictive maintenance, quality control, and real-time decision-making. As industrial environments become more data-intensive, manufacturers increasingly require reliable, scalable, and high-speed networking infrastructure. The segment is poised for strong growth through 2032, particularly across regions embracing digital transformation in industrial operations, such as Asia-Pacific and Europe, where smart manufacturing adoption is accelerating.
Ethernet Storage Fabric Market Regional Landscape
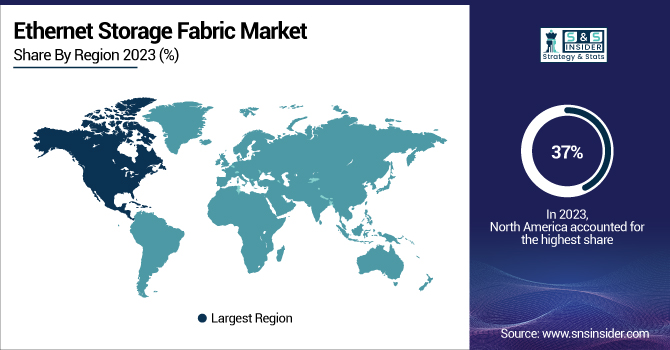
North America dominated the Ethernet Storage Fabric market in 2023 and accounted for 37% of revenue share due to its advanced data center infrastructure, high cloud adoption, and strong presence of hyperscalers and tech giants. The region leads in deploying next-gen storage technologies like NVMe-over-Fabrics and high-speed Ethernet, driven by AI/ML workloads, big data, and real-time analytics. Ongoing investments in edge computing, 5G, and hybrid cloud architectures further fuel demand. Through 2032, North America is expected to retain its lead, supported by innovation, early technology adoption, and robust demand from sectors like telecom, BFSI, and government.
Asia-Pacific is expected to register the fastest CAGR in the Ethernet Storage Fabric market, propelled by rapid digital transformation, growing cloud adoption, and expanding hyperscale and edge data centers. Countries like China, India, Japan, and South Korea are investing heavily in AI, IoT, and smart manufacturing, all of which demand high-performance storage networks. The region’s growing enterprise base and favorable government initiatives for IT infrastructure development further boost growth. Through 2030, Asia-Pacific will emerge as a key growth engine, driven by large-scale deployments in telecom, manufacturing, and public sector projects.
Get Customized Report as per Your Business Requirement - Enquiry Now
Key Players Listed in Ethernet Storage Fabric Market are:
-
Cisco Systems, Inc. – Nexus 9000 Series Switches
-
Arista Networks, Inc. – Arista 7280R Series
-
Juniper Networks, Inc. – QFX Series Switches
-
Broadcom Inc. – NetXtreme Ethernet Adapters
-
Intel Corporation – Ethernet Network Adapter E810
-
Hewlett Packard Enterprise (HPE) – HPE FlexFabric Switches
-
Dell Technologies Inc. – PowerSwitch Z-Series
-
Mellanox Technologies (NVIDIA) – ConnectX Ethernet Adapters
-
IBM Corporation – IBM Spectrum Scale
-
Huawei Technologies Co., Ltd. – CloudEngine Switches
-
Super Micro Computer, Inc. – Supermicro AOC Network Adapters
-
Lenovo Group Limited – Lenovo ThinkSystem NE Series Switches
-
Fujitsu Limited – PRIMERGY Switches
-
Extreme Networks, Inc. – ExtremeSwitching 5520
-
NetApp, Inc. – NetApp ONTAP Select
Recent Developments
-
October 2024: Astera Labs introduced the Scorpio Smart Fabric Switch portfolio, featuring the industry's first PCIe 6 switch. This innovation aims to enhance AI data center infrastructure by doubling bandwidth and improving power efficiency compared to previous specifications.
-
May 2024: Accton announced 800G-optimized products aimed at providing Ethernet and VoQ fabrics tailored for AI/ML workloads.
|
Report Attributes |
Details |
|---|---|
|
Market Size in 2023 |
USD 2.5 Billion |
|
Market Size by 2032 |
USD 8.0 Billion |
|
CAGR |
CAGR of 13.79% From 2024 to 2032 |
|
Base Year |
2023 |
|
Forecast Period |
2024-2032 |
|
Historical Data |
2020-2022 |
|
Report Scope & Coverage |
Market Size, Segments Analysis, Competitive Landscape, Regional Analysis, DROC & SWOT Analysis, Forecast Outlook |
|
Key Segments |
• By Device (Switches, Controllers, Adapters) |
|
Regional Analysis/Coverage |
North America (US, Canada, Mexico), Europe (Eastern Europe [Poland, Romania, Hungary, Turkey, Rest of Eastern Europe] Western Europe] Germany, France, UK, Italy, Spain, Netherlands, Switzerland, Austria, Rest of Western Europe]), Asia Pacific (China, India, Japan, South Korea, Vietnam, Singapore, Australia, Rest of Asia Pacific), Middle East & Africa (Middle East [UAE, Egypt, Saudi Arabia, Qatar, Rest of Middle East], Africa [Nigeria, South Africa, Rest of Africa], Latin America (Brazil, Argentina, Colombia, Rest of Latin America) |
|
Company Profiles |
Cisco Systems, Inc., Arista Networks, Inc., Juniper Networks, Inc., Broadcom Inc., Intel Corporation, Hewlett Packard Enterprise (HPE), Dell Technologies Inc., Mellanox Technologies (NVIDIA), IBM Corporation, Huawei Technologies Co., Ltd., Super Micro Computer, Inc., Lenovo Group Limited, Fujitsu Limited, Extreme Networks, Inc., NetApp, Inc. |
Frequently Asked Questions
Ans- Multivendor setups complicate ESF deployment due to integration, compatibility, and performance issues.
Ans- Rising data volumes and latency-sensitive workloads are driving adoption of high-speed Ethernet storage fabrics.
Ans- Asia-Pacific is expected to register the fastest CAGR during the forecast period.
Ans- The CAGR of the Ethernet Storage Fabric Market during the forecast period is 13.79% from 2024-2032.
Ans - The Ethernet Storage Fabric Market was valued at USD 2.5 billion in 2023 and is expected to reach USD 8.0 billion by 2032
Get in touch
