The Environmental Sensors Market was valued at USD 1.36 billion in 2023 and is expected to reach USD 3.33 billion by 2032, growing at a CAGR of 10.53% over the forecast period 2024-2032.

Get More Information on Environmental Sensor Market - Request Sample Report
The Environmental Sensors Market is growing significantly due to rising awareness and demand for sustainable solutions. With increasing awareness about climate change, air pollution, and water pollution, environmental sensors have been extensively used for monitoring and regulating environmental conditions. Strict environmental regulations are being enforced by governments and regulatory bodies, increasing the demand for accurate and real-time monitoring of air quality, water quality, temperature, and other environmental parameters. This has led to an enthusiastic market for environmental sensors in smart cities, healthcare, and industrial applications where the accuracy of data is critical for safety and efficiency. Growth of environmental sensors in 2024 is seen along with 80% of Global Smart cities incorporating environmental sensors into urban infrastructure by 2024. Currently, there are more than 1,200 hospitals with sensors for real-time air quality monitoring in the healthcare sector with a projected annual increase of 12%. Meanwhile, 60% more of the companies in the U.S. and EU have increased funding for basic environmental sensors because of stringent regulations
Moreover, the increasing popularity of smart technologies and the Internet of Things (IoT) is a stimulus to further growth of the environmental sensors market. Connected sensors power smart homes, offices, and cities that dynamically optimize energy consumption and improve indoor air quality and other environmental conditions. Environmental sensors integrated within IoT systems facilitate the improved collection and analysis of data necessary for productive decision-making. Rapid innovations coupled with increasing awareness regarding sustainability are expected to drive the demand for environmental sensors for outdoor and indoor environments, which in turn is anticipated to accelerate the environmental sensors market growth across different verticals and regions during the forecast period. The number of connected IoT devices will grow to 18.8 billion in 2024, a 13% increase over 2023. Approximately 73.5% of U.S. households are expected to use smart home devices, increasing to 90.7% by 2029. AI-powered energy efficiency systems will also be deployed in more than 25% of commercial buildings in the U.S. Environmental sensors will continue to play an increasing role in smart home tech, with which connected devices for improving indoor air quality will amount to 35% of the smart home annual shipments in 2024.
Key Drivers:
Industrial Automation and Sustainability Drive Demand for Advanced Environmental Sensors in Multiple Sectors
Driving forces for stimulating demand for the Environmental Sensors Market include an increasing adoption of industrial automation and smart manufacturing processes. To monitor environmental parameters in real-time in multiple industries, advanced environmental sensors are being utilized. That is important to maximize production capabilities, ensure security and safety, and meet environmental compliance. In industrial environments, smart sensors play a key role in predictive maintenance, minimizing downtime, and enhancing operational effectiveness. Moreover, the shift of industries towards sustainable and green technologies is also pushing the demand for environmental sensors to monitor emissions and waste products thus, propelling the market. We anticipate that industrial automation, especially in manufacturing, automotive, and energy sectors, will drive the need for advanced environmental sensors that deliver accurate real-time data for enhancing operational efficiency and sustainability. By 2024, more than 50% of industrial plants will employ AI-powered sensors to achieve a 40% reduction in downtime and 20-30% savings in maintenance costs. Sustainable manufacturing came in at 7.5% growth with 60% of smart sensor applications in the form of predictive maintenance in the manufacturing, automotive, and energy sectors. 40% of industrial facilities around the world have incorporated environmental sensors for real-time data on emissions and waste. Moreover, the new plants that introduced smart sensors for energy consumption and waste reduction accounted for 15% of them.
Renewable Energy Growth Drives Demand for Environmental Sensors to Optimize Performance and Sustainability
The rise of renewable energy is also an important factor stimulating the Environmental Sensors Market. As the world transitions to cleaner energy resources in the form of solar and wind power, so does the need to monitor the environmental factors impacting power generation. Data collection devices for environmental sensors help optimize the performance of renewable energy systems by providing data on weather patterns, temperature variations, and air quality. As a case in point, for solar energy, environmental sensors can monitor sunlight and cloud coverage to help identify optimal solar panel setups and usage. Just like any industry, wind turbines depend on their environmental sensors for accurate readings of wind speed, wind direction, and the other key environmental characteristics that drive energy production. Demand for environmental sensors is expected to increase further given the growing focus on renewable energy infrastructure and sustainability, which makes it an important enabler in the worldwide move towards greener energy alternatives. With the total global deployment of solar PV technology expected to surpass USD 500 billion in 2024, the need to monitor sunlight and cloud coverage with sensors has driven this trend. More than 85% of wind farms will have new environmental monitoring sensors to measure wind speed and wind direction, and more than 40% of wind turbines will adopt IoT-enabled sensors for predictive maintenance and operational performance. Along with this, it is estimated that environmental sensors will boost 18% in renewable energy systems enabling better operational efficiency and energy output.
Restrain:
Challenges in Environmental Sensors Market Include Data Accuracy Calibration Issues and Lack of Standardization
Data accuracy & data reliability issues are one of the major challenges in the Environmental Sensors Market. Environmental sensors are often exposed to varied and uncontrolled environments and therefore constant and accurate readings are difficult to maintain. Extreme temperatures, high humidity conditions, etc. Environmental conditions can jeopardize the accuracy of the sensor reading which in turn corrupts the data and results. Calibrating their sensors and achieving long-term accuracy over large areas continues to be a major obstacle for manufacturers. Another important restraint includes the non-availability of standardization among environmental sensors. The need for different specifications of sensors in various industries, regions, and applications led to a fragmented market. This fragmentation creates high complexity for manufacturers to develop sensors that would work together across different platforms and systems since there are no universal standards in place. The lack of such interoperability could impede mass adoption, most notably in areas such as smart cities and IoT-enabled environments.
By Location
The outdoor environment sensors segment held the largest share of 43.2% in 2023 owing to the rising demand for real-time monitoring of environment-related parameters in open spaces. They are primarily used for air quality monitoring, weather forecasting, and pollution control in smart cities and industrial applications. As climate change concerns and pressure over urban pollution and the desire for environmental sustainability have increased, governments, municipalities, and organizations have been increasingly investing in outdoor sensor networks to monitor and address these issues. Demand for high-quality, near-real-time data for the formulation and regulation of environmental policies has been a significant factor driving the market.
Portable environmental sensors are expected to be the fastest-growing segment by CAGR from 2024-2032, owing to their versatility, mobility, and ease of using portable environmental sensors. These sensors enable users to track environmental conditions in hard-to-reach or remote areas where fixed sensors cannot be deployed. Applications include growth in fields like agriculture, health, and industrial safety that require point environment data acquisition. The Portable Sensors Market is anticipated to grow at a rapid pace, incited by the ability of the industries to adapt to the concept of personalized and dynamic monitoring solutions, advancements in sensor technology, and the rising trend of IoT devices. Portable sensors also prove to be significant in mobile applications where rapid and localized environmental assessments are necessary due to their great flexibility and convenience.
By Type
In 2023, temperature sensors held a dominant market share of 28.8% and are expected to witness the fastest CAGR during the forecast period of 2023-2032. This is because they are widely used for industrial processes, climate control systems, and environmental monitoring. In a broad array of industries manufacturing, healthcare, agriculture, and energy temperature is one of the most essential parameters for systematic functioning, safety, and product quality. Real-time monitoring and control of temperature is crucial to reduce risk, ensure compliance, and improve productivity therefore, temperature sensors are in high demand. Additionally, the increasing shift towards IoT and smart systems is also expected to push the temperature sensor market further up. With the increased adoption of automation and smart technologies across the sectors, the task of temperature monitoring now plays a significant role, both in terms of energy consumption as well as optimization of HVAC systems that can further enhance indoor environmental quality. The robustness of these components and growing precision, affordability, and simplicity of integration in thermometers significantly spur adoption over the forecast period, thus holding promising growth prospects in the coming years.
By Application
In 2023, Smart City applications accounted for 41.5% of the Environmental Sensors Market on a growth based on the surging investments in urban infrastructure intending to make cities smarter, sustainable, robust & convenient to live. With the rise of environmental challenges, including air pollution, waste management, and energy consumption burden growing cities, environmental sensors are critical tools for urban monitoring and management. Air quality, temperature, noise level, and other data are collected through the sensors, allowing city officials to learn about the optimization of urban operations and functions, public health, and quality of life. The growing advancement for creating smart cities with various connected systems has led to this space being the market leader.
Smart Home Automation is estimated to expand with a rapid growth rate throughout 2024-2032, due to the enhancing adoption by homeowners for convenience, energy efficiency, and comfort-based technologies. Smart home automation allows environmental sensors to monitor indoor air quality, temperature, humidity, energy usage, etc. As more and more consumer IoT devices with smart voice commands come along, customers have been looking for solutions to tailor their homes to their preferences. Adoption of such trends along with the rising awareness among consumers regarding sustainability is expected to propel the demand for environmental sensors rapidly in smart homes and it is estimated to be the fastest-growing application over the years.
By Vertical
In 2023, the Government sector dominated the Environmental Sensors Market and held a share of 24.5%. Increased demand for environmental monitoring due to regulatory compliance and public health and safety concerns associated with industrial plants, as well as expanding initiatives for sustainable development, have all contributed to the growth of the Government sector in terms of revenue generation. Around the world, governments are implementing smart city projects and environmental policies that depend on continuous data collection about air quality, water quality, temperature, and other environmental metrics. Environmental sensors play a crucial role in these initiatives as they help cities and governments monitor pollution, track climate change, and regulate the environment. Moreover, it will continue to strengthen the position of government investments in environmental monitoring systems, due to the pursuit of a decrease in carbon footprints and infrastructure upgrades.
The Healthcare sector is likely to grow with the highest CAGR throughout the forecast period from 2024-2032, due to the surging demand for accurate and real-time monitoring of environmental conditions in healthcare settings. Patient health, comfort, and recovery are largely affected by environmental factors like humidity, air quality, and temperature. Hospitals and clinics are using environmental sensors to guarantee decent patient conditions, contain infection, and make healthcare facilities more energy-efficient. In addition, increasing applications of portable environmental sensors for real-time personal health conditions monitoring due to growing demand for wearable devices and telemedicine is further contributing to the market growth. Thus, as the health care industry starts making plenty of efforts in delivering a strong focus on the patient care process and working on maintaining the health care facility, the role of environmental sensors in healthy environments will drive better health outcomes.
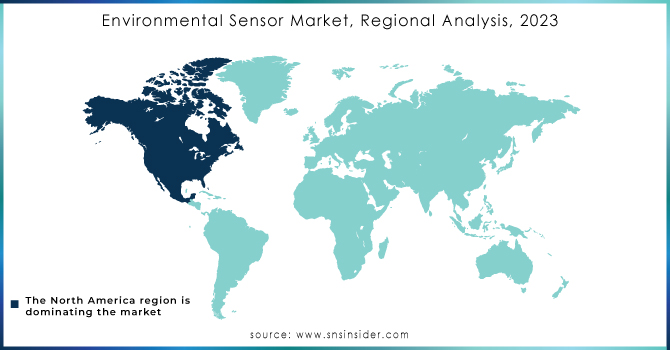
In 2023, North America held a 34.7% share of the Environmental Sensors Market, due to advanced environmental monitoring technologies, as well as strict government regulations and significant investments in smart city projects. Environmental sensors are increasingly being adopted in the U.S. and Canada for air quality monitoring, tracking industrial emissions, and assessing water quality. To take an example, in compliance monitoring of air and water pollution standards enforced by the U.S. Environmental Protection Agency (EPA) under the Clean Air and Clean Water Acts, environmental sensors are increasingly used. Likewise, the cities of Los Angeles and Chicago have designed a city-wide environmental-sensing solution that can collect connected data-stream of urban pollution data, energy consumption and public health indicators. Its commitment to sustainability and integration of IoT and smart technologies have made it a formidable market leader in the region.
Asia Pacific is anticipated to witness growth at the fastest CAGR during 2024-2032, on account of the rapid urbanization & industrialization, coupled with the initiatives undertaken by each government to tackle environmental issues. For example, environmental sensor networks are being implemented on a wide scale by some countries like China and India where severe air and water pollution is present. An example comes from China, which has placed sensors in air quality monitoring systems throughout urban and rural areas as part of its "Blue Sky Action Plan" to lower hazardous pollution levels. Likewise, India is adding the use of environmental sensors to its Smart Cities Mission to manage waste, track air quality and urban infrastructure. As well as which, Japan and South Korea are merging environment sensors into smart home & industrial automation systems for energy efficiency and sustainable practice. Climate sensor is one of the provinces with high development potential in terms of environment, which derive from projects launched by the regulatory policies, governmental actions and public awareness of environmental monitoring solutions.
Get Customized Report as per your Business Requirement - Request For Customized Report
Some of the major players in the Environmental Sensors Market are:
Sensirion AG (SGP40 Air Quality Sensor, SHT4x Humidity and Temperature Sensor)
Honeywell International Inc. (HPM Series Particle Sensor, HIH Series Humidity Sensors)
Siemens AG (QPA2000 Room Air Quality Sensor, QFM3160 Duct Humidity and Temperature Sensor)
ams-OSRAM AG (CCS811 Gas Sensor, ENS210 Temperature and Humidity Sensor)
Bosch Sensortec GmbH (BME680 Environmental Sensor, BME280 Humidity and Pressure Sensor)
OMRON Corporation (D6F-PH MEMS Flow Sensor, B5W-LD Air Quality Sensor)
Raritan Inc. (EMX Smart Rack Controller, DX2 Environmental Sensors)
Texas Instruments Incorporated (HDC2080 Humidity and Temperature Sensor, LMT70 Temperature Sensor)
Schneider Electric (SpaceLogic Sensor, SmartX Actuator Sensor)
Amphenol Corporation (Telaire T6700 CO2 Sensor, SM-UART-04L Dust Sensor)
Vaisala Oyj (HMP60 Humidity and Temperature Probe, GMP343 Carbon Dioxide Sensor)
EnOcean GmbH (STM 550 Multi-Sensor, STM 330 Temperature Sensor)
STMicroelectronics (HTS221 Humidity and Temperature Sensor, LPS22HB Barometric Pressure Sensor)
Renesas Electronics Corporation (HS3001 Humidity and Temperature Sensor, ZMOD4410 Gas Sensor)
TE Connectivity (HTU21D Humidity and Temperature Sensor, MS8607 PHT Combination Sensor)
Laird Connectivity (Sentrius RS1xx Temperature and Humidity Sensor, BT510 Bluetooth Sensor)
AlphaSense Inc. (OPC-N3 Particle Monitor, OX-B431 Oxygen Sensor)
Figaro Engineering Inc. (TGS2600 Air Quality Sensor, TGS5042 Carbon Monoxide Sensor)
Aeroqual Ltd. (Series 500 Portable Air Quality Monitor, SM50 Ozone Sensor)
SGX Sensortech (MiCS-5524 CO Sensor, MiCS-6814 Gas Sensor)
Some of the Raw Material Suppliers for Environmental Sensors Companies:
3M Company
Dow Inc.
BASF SE
DuPont de Nemours, Inc.
Mitsubishi Chemical Holdings Corporation
Sumitomo Chemical Co., Ltd.
LG Chem Ltd.
Toray Industries, Inc.
Covestro AG
SABIC (Saudi Basic Industries Corporation)
In October 2024, Sensirion launched the STS4L, its most cost-efficient temperature sensor, offering ±0.4°C accuracy, ultra-compact size (1.5 × 1.5 × 0.5 mm), and low power consumption, ideal for cost-sensitive applications.
In August 2024, Honeywell and Cisco partnered to use AI and automation to reduce building energy consumption by optimizing HVAC systems based on real-time occupancy data. The solution could reduce energy use by up to 30% while improving occupant comfort.
In August 2024, Siemens Smart Infrastructure launched the SICAM Enhanced Grid Sensor, offering real-time transparency for local grids and substations to optimize maintenance and integrate renewable energy.
| Report Attributes | Details |
|---|---|
| Market Size in 2023 | USD 1.36 Billion |
| Market Size by 2032 | USD 3.33 Billion |
| CAGR | CAGR of 10.53% From 2024 to 2032 |
| Base Year | 2023 |
| Forecast Period | 2024-2032 |
| Historical Data | 2020-2022 |
| Report Scope & Coverage | Market Size, Segments Analysis, Competitive Landscape, Regional Analysis, DROC & SWOT Analysis, Forecast Outlook |
| Key Segments | • By Location (Outdoor, Indoor, Portable) • By Type (Temperature, Chemicals, Humidity, Water Quality, Air Quality, Integrated, Ultraviolet (UV), Soil Moisture, Gas, Smoke) • By Application (Smart City, Smart Home Automation, Smart Office Automation, Others) • By Vertical (Government, Industrial, Healthcare, Residential, Commercial, Consumer Electronics, Enterprise) |
| Regional Analysis/Coverage | North America (US, Canada, Mexico), Europe (Eastern Europe [Poland, Romania, Hungary, Turkey, Rest of Eastern Europe] Western Europe] Germany, France, UK, Italy, Spain, Netherlands, Switzerland, Austria, Rest of Western Europe]), Asia Pacific (China, India, Japan, South Korea, Vietnam, Singapore, Australia, Rest of Asia Pacific), Middle East & Africa (Middle East [UAE, Egypt, Saudi Arabia, Qatar, Rest of Middle East], Africa [Nigeria, South Africa, Rest of Africa], Latin America (Brazil, Argentina, Colombia, Rest of Latin America) |
| Company Profiles | Sensirion AG, Honeywell International Inc., Siemens AG, ams-OSRAM AG, Bosch Sensortec GmbH, OMRON Corporation, Raritan Inc., Texas Instruments Incorporated, Schneider Electric, Amphenol Corporation, Vaisala Oyj, EnOcean GmbH, STMicroelectronics, Renesas Electronics Corporation, TE Connectivity, Laird Connectivity, AlphaSense Inc., Figaro Engineering Inc., Aeroqual Ltd., SGX Sensortech |
| Key Drivers | • Industrial Automation and Sustainability Drive Demand for Advanced Environmental Sensors in Multiple Sectors • Renewable Energy Growth Drives Demand for Environmental Sensors to Optimize Performance and Sustainability |
| RESTRAINTS | • Challenges in Environmental Sensors Market Include Data Accuracy Calibration Issues and Lack of Standardization |
Ans: The Environmental Sensors Market is expected to grow at a CAGR of 10.53% during 2024-2032.
Ans: Environmental Sensors Market size was USD 1.36 billion in 2023 and is expected to Reach USD 3.33 billion by 2032.
Ans: The major growth factor of the Environmental Sensors Market is the increasing demand for real-time environmental monitoring to address sustainability, climate change, and regulatory compliance.
Ans: The Temperature segment dominated the Environmental Sensors Market in 2023.
Ans: North America dominated the Environmental Sensors Market in 2023.
Table of Content
1. Introduction
1.1 Market Definition
1.2 Scope (Inclusion and Exclusions)
1.3 Research Assumptions
2. Executive Summary
2.1 Market Overview
2.2 Regional Synopsis
2.3 Competitive Summary
3. Research Methodology
3.1 Top-Down Approach
3.2 Bottom-up Approach
3.3. Data Validation
3.4 Primary Interviews
4. Market Dynamics Impact Analysis
4.1 Market Driving Factors Analysis
4.1.1 Drivers
4.1.2 Restraints
4.2 PESTLE Analysis
4.3 Porter’s Five Forces Model
5. Statistical Insights and Trends Reporting
5.1 Environmental Sensors Product Innovation and Launch Frequency (2023)
5.2 Environmental Sensors Regulatory Impact Analysis
5.3 Environmental Sensors Sensor Accuracy and Reliability Trends
6. Competitive Landscape
6.1 List of Major Companies, By Region
6.2 Market Share Analysis, By Region
6.3 Product Benchmarking
6.3.1 Product specifications and features
6.3.2 Pricing
6.4 Strategic Initiatives
6.4.1 Marketing and promotional activities
6.4.2 Distribution and Supply Chain Strategies
6.4.3 Expansion plans and new product launches
6.4.4 Strategic partnerships and collaborations
6.5 Technological Advancements
6.6 Market Positioning and Branding
7. Environmental Sensors Market Segmentation, By Location
7.1 Chapter Overview
7.2 Outdoor
7.2.1 Outdoor Market Trends Analysis (2020-2032)
7.2.2 Outdoor Market Size Estimates and Forecasts to 2032 (USD Billion)
7.3 Indoor
7.3.1 Indoor Market Trends Analysis (2020-2032)
7.3.2 Indoor Market Size Estimates and Forecasts to 2032 (USD Billion)
7.4 Portable
7.4.1 Portable Market Trends Analysis (2020-2032)
7.4.2 Portable Market Size Estimates and Forecasts to 2032 (USD Billion)
8. Environmental Sensors Market Segmentation, By Type
8.1 Chapter Overview
8.2 Temperature
8.2.1 Temperature Market Trends Analysis (2020-2032)
8.2.2 Temperature Market Size Estimates and Forecasts to 2032 (USD Billion)
8.3 Chemicals
8.3.1 Chemicals Market Trends Analysis (2020-2032)
8.3.2 Chemicals Market Size Estimates and Forecasts to 2032 (USD Billion)
8.4 Humidity
8.4.1 Humidity Market Trends Analysis (2020-2032)
8.4.2 Humidity Market Size Estimates and Forecasts to 2032 (USD Billion)
8.5 Water Quality
8.5.1 Water Quality Market Trends Analysis (2020-2032)
8.5.2 Water Quality Market Size Estimates and Forecasts to 2032 (USD Billion)
8.6 Air Quality
8.6.1 Air Quality Market Trends Analysis (2020-2032)
8.6.2 Air Quality Market Size Estimates and Forecasts to 2032 (USD Billion)
8.7 Integrated
8.7.1 Integrated Market Trends Analysis (2020-2032)
8.7.2 Integrated Market Size Estimates and Forecasts to 2032 (USD Billion)
8.8 Ultraviolet (UV)
8.8.1 Ultraviolet (UV) Market Trends Analysis (2020-2032)
8.8.2 Ultraviolet (UV) Market Size Estimates and Forecasts to 2032 (USD Billion)
8.9 Soil Moisture
8.9.1 Soil Moisture Market Trends Analysis (2020-2032)
8.9.2 Soil Moisture Market Size Estimates and Forecasts to 2032 (USD Billion)
8.10 Gas
8.10.1 Gas Market Trends Analysis (2020-2032)
8.10.2 Gas Market Size Estimates and Forecasts to 2032 (USD Billion)
8.11 Smoke
8.11.1 Smoke Market Trends Analysis (2020-2032)
8.11.2 Smoke Market Size Estimates and Forecasts to 2032 (USD Billion)
9. Environmental Sensors Market Segmentation, By Application
9.1 Chapter Overview
9.2 Smart City
9.2.1 Smart City Market Trends Analysis (2020-2032)
9.2.2 Smart City Market Size Estimates and Forecasts to 2032 (USD Billion)
9.3 Smart Home Automation
9.3.1 Smart Home Automation Market Trends Analysis (2020-2032)
9.3.2 Smart Home Automation Market Size Estimates and Forecasts to 2032 (USD Billion)
9.4 Smart Office Automation
9.4.1 Smart Office Automation Market Trends Analysis (2020-2032)
9.4.2 Smart Office Automation Market Size Estimates and Forecasts to 2032 (USD Billion)
9.5 Others
9.5.1 Others Market Trends Analysis (2020-2032)
9.5.2 Others Market Size Estimates and Forecasts to 2032 (USD Billion)
10. Environmental Sensors Market Segmentation, By Vertical
10.1 Chapter Overview
10.2 Government
10.2.1 Government Market Trends Analysis (2020-2032)
10.2.2 Government Market Size Estimates and Forecasts to 2032 (USD Billion)
10.3 Industrial
10.3.1 Industrial Market Trends Analysis (2020-2032)
10.3.2 Industrial Market Size Estimates and Forecasts to 2032 (USD Billion)
10.4 Healthcare
10.4.1 Healthcare Market Trends Analysis (2020-2032)
10.4.2 Healthcare Market Size Estimates and Forecasts to 2032 (USD Billion)
10.5 Residential
10.5.1 Residential Market Trends Analysis (2020-2032)
10.5.2 Residential Market Size Estimates and Forecasts to 2032 (USD Billion)
10.6 Commercial
10.6.1 Commercial Market Trends Analysis (2020-2032)
10.6.2 Commercial Market Size Estimates and Forecasts to 2032 (USD Billion)
10.7 Consumer Electronics
10.7.1 Consumer Electronics Market Trends Analysis (2020-2032)
10.7.2 Consumer Electronics Market Size Estimates and Forecasts to 2032 (USD Billion)
10.8 Enterprise
10.8.1 Enterprise Market Trends Analysis (2020-2032)
10.8.2 Enterprise Market Size Estimates and Forecasts to 2032 (USD Billion)
11. Regional Analysis
11.1 Chapter Overview
11.2 North America
11.2.1 Trends Analysis
11.2.2 North America Environmental Sensors Market Estimates and Forecasts, by Country (2020-2032) (USD Billion)
11.2.3 North America Environmental Sensors Market Estimates and Forecasts, By Location (2020-2032) (USD Billion)
11.2.4 North America Environmental Sensors Market Estimates and Forecasts, By Type (2020-2032) (USD Billion)
11.2.5 North America Environmental Sensors Market Estimates and Forecasts, By Application (2020-2032) (USD Billion)
11.2.6 North America Environmental Sensors Market Estimates and Forecasts, By Vertical (2020-2032) (USD Billion)
11.2.7 USA
11.2.7.1 USA Environmental Sensors Market Estimates and Forecasts, By Location (2020-2032) (USD Billion)
11.2.7.2 USA Environmental Sensors Market Estimates and Forecasts, By Type (2020-2032) (USD Billion)
11.2.7.3 USA Environmental Sensors Market Estimates and Forecasts, By Application (2020-2032) (USD Billion)
11.2.7.4 USA Environmental Sensors Market Estimates and Forecasts, By Vertical (2020-2032) (USD Billion)
11.2.8 Canada
11.2.8.1 Canada Environmental Sensors Market Estimates and Forecasts, By Location (2020-2032) (USD Billion)
11.2.8.2 Canada Environmental Sensors Market Estimates and Forecasts, By Type (2020-2032) (USD Billion)
11.2.8.3 Canada Environmental Sensors Market Estimates and Forecasts, By Application (2020-2032) (USD Billion)
11.2.8.4 Canada Environmental Sensors Market Estimates and Forecasts, By Vertical (2020-2032) (USD Billion)
11.2.9 Mexico
11.2.9.1 Mexico Environmental Sensors Market Estimates and Forecasts, By Location (2020-2032) (USD Billion)
11.2.9.2 Mexico Environmental Sensors Market Estimates and Forecasts, By Type (2020-2032) (USD Billion)
11.2.9.3 Mexico Environmental Sensors Market Estimates and Forecasts, By Application (2020-2032) (USD Billion)
11.2.9.4 Mexico Environmental Sensors Market Estimates and Forecasts, By Vertical (2020-2032) (USD Billion)
11.3 Europe
11.3.1 Eastern Europe
11.3.1.1 Trends Analysis
11.3.1.2 Eastern Europe Environmental Sensors Market Estimates and Forecasts, by Country (2020-2032) (USD Billion)
11.3.1.3 Eastern Europe Environmental Sensors Market Estimates and Forecasts, By Location (2020-2032) (USD Billion)
11.3.1.4 Eastern Europe Environmental Sensors Market Estimates and Forecasts, By Type (2020-2032) (USD Billion)
11.3.1.5 Eastern Europe Environmental Sensors Market Estimates and Forecasts, By Application (2020-2032) (USD Billion)
11.3.1.6 Eastern Europe Environmental Sensors Market Estimates and Forecasts, By Vertical (2020-2032) (USD Billion)
11.3.1.7 Poland
11.3.1.7.1 Poland Environmental Sensors Market Estimates and Forecasts, By Location (2020-2032) (USD Billion)
11.3.1.7.2 Poland Environmental Sensors Market Estimates and Forecasts, By Type (2020-2032) (USD Billion)
11.3.1.7.3 Poland Environmental Sensors Market Estimates and Forecasts, By Application (2020-2032) (USD Billion)
11.3.1.7.4 Poland Environmental Sensors Market Estimates and Forecasts, By Vertical (2020-2032) (USD Billion)
11.3.1.8 Romania
11.3.1.8.1 Romania Environmental Sensors Market Estimates and Forecasts, By Location (2020-2032) (USD Billion)
11.3.1.8.2 Romania Environmental Sensors Market Estimates and Forecasts, By Type (2020-2032) (USD Billion)
11.3.1.8.3 Romania Environmental Sensors Market Estimates and Forecasts, By Application (2020-2032) (USD Billion)
11.3.1.8.4 Romania Environmental Sensors Market Estimates and Forecasts, By Vertical (2020-2032) (USD Billion)
11.3.1.9 Hungary
11.3.1.9.1 Hungary Environmental Sensors Market Estimates and Forecasts, By Location (2020-2032) (USD Billion)
11.3.1.9.2 Hungary Environmental Sensors Market Estimates and Forecasts, By Type (2020-2032) (USD Billion)
11.3.1.9.3 Hungary Environmental Sensors Market Estimates and Forecasts, By Application (2020-2032) (USD Billion)
11.3.1.9.4 Hungary Environmental Sensors Market Estimates and Forecasts, By Vertical (2020-2032) (USD Billion)
11.3.1.10 turkey
11.3.1.10.1 Turkey Environmental Sensors Market Estimates and Forecasts, By Location (2020-2032) (USD Billion)
11.3.1.10.2 Turkey Environmental Sensors Market Estimates and Forecasts, By Type (2020-2032) (USD Billion)
11.3.1.10.3 Turkey Environmental Sensors Market Estimates and Forecasts, By Application (2020-2032) (USD Billion)
11.3.1.10.4 Turkey Environmental Sensors Market Estimates and Forecasts, By Vertical (2020-2032) (USD Billion)
11.3.1.11 Rest of Eastern Europe
11.3.1.11.1 Rest of Eastern Europe Environmental Sensors Market Estimates and Forecasts, By Location (2020-2032) (USD Billion)
11.3.1.11.2 Rest of Eastern Europe Environmental Sensors Market Estimates and Forecasts, By Type (2020-2032) (USD Billion)
11.3.1.11.3 Rest of Eastern Europe Environmental Sensors Market Estimates and Forecasts, By Application (2020-2032) (USD Billion)
11.3.1.11.4 Rest of Eastern Europe Environmental Sensors Market Estimates and Forecasts, By Vertical (2020-2032) (USD Billion)
11.3.2 Western Europe
11.3.2.1 Trends Analysis
11.3.2.2 Western Europe Environmental Sensors Market Estimates and Forecasts, by Country (2020-2032) (USD Billion)
11.3.2.3 Western Europe Environmental Sensors Market Estimates and Forecasts, By Location (2020-2032) (USD Billion)
11.3.2.4 Western Europe Environmental Sensors Market Estimates and Forecasts, By Type (2020-2032) (USD Billion)
11.3.2.5 Western Europe Environmental Sensors Market Estimates and Forecasts, By Application (2020-2032) (USD Billion)
11.3.2.6 Western Europe Environmental Sensors Market Estimates and Forecasts, By Vertical (2020-2032) (USD Billion)
11.3.2.7 Germany
11.3.2.7.1 Germany Environmental Sensors Market Estimates and Forecasts, By Location (2020-2032) (USD Billion)
11.3.2.7.2 Germany Environmental Sensors Market Estimates and Forecasts, By Type (2020-2032) (USD Billion)
11.3.2.7.3 Germany Environmental Sensors Market Estimates and Forecasts, By Application (2020-2032) (USD Billion)
11.3.2.7.4 Germany Environmental Sensors Market Estimates and Forecasts, By Vertical (2020-2032) (USD Billion)
11.3.2.8 France
11.3.2.8.1 France Environmental Sensors Market Estimates and Forecasts, By Location (2020-2032) (USD Billion)
11.3.2.8.2 France Environmental Sensors Market Estimates and Forecasts, By Type (2020-2032) (USD Billion)
11.3.2.8.3 France Environmental Sensors Market Estimates and Forecasts, By Application (2020-2032) (USD Billion)
11.3.2.8.4 France Environmental Sensors Market Estimates and Forecasts, By Vertical (2020-2032) (USD Billion)
11.3.2.9 UK
11.3.2.9.1 UK Environmental Sensors Market Estimates and Forecasts, By Location (2020-2032) (USD Billion)
11.3.2.9.2 UK Environmental Sensors Market Estimates and Forecasts, By Type (2020-2032) (USD Billion)
11.3.2.9.3 UK Environmental Sensors Market Estimates and Forecasts, By Application (2020-2032) (USD Billion)
11.3.2.9.4 UK Environmental Sensors Market Estimates and Forecasts, By Vertical (2020-2032) (USD Billion)
11.3.2.10 Italy
11.3.2.10.1 Italy Environmental Sensors Market Estimates and Forecasts, By Location (2020-2032) (USD Billion)
11.3.2.10.2 Italy Environmental Sensors Market Estimates and Forecasts, By Type (2020-2032) (USD Billion)
11.3.2.10.3 Italy Environmental Sensors Market Estimates and Forecasts, By Application (2020-2032) (USD Billion)
11.3.2.10.4 Italy Environmental Sensors Market Estimates and Forecasts, By Vertical (2020-2032) (USD Billion)
11.3.2.11 Spain
11.3.2.11.1 Spain Environmental Sensors Market Estimates and Forecasts, By Location (2020-2032) (USD Billion)
11.3.2.11.2 Spain Environmental Sensors Market Estimates and Forecasts, By Type (2020-2032) (USD Billion)
11.3.2.11.3 Spain Environmental Sensors Market Estimates and Forecasts, By Application (2020-2032) (USD Billion)
11.3.2.11.4 Spain Environmental Sensors Market Estimates and Forecasts, By Vertical (2020-2032) (USD Billion)
11.3.2.12 Netherlands
11.3.2.12.1 Netherlands Environmental Sensors Market Estimates and Forecasts, By Location (2020-2032) (USD Billion)
11.3.2.12.2 Netherlands Environmental Sensors Market Estimates and Forecasts, By Type (2020-2032) (USD Billion)
11.3.2.12.3 Netherlands Environmental Sensors Market Estimates and Forecasts, By Application (2020-2032) (USD Billion)
11.3.2.12.4 Netherlands Environmental Sensors Market Estimates and Forecasts, By Vertical (2020-2032) (USD Billion)
11.3.2.13 Switzerland
11.3.2.13.1 Switzerland Environmental Sensors Market Estimates and Forecasts, By Location (2020-2032) (USD Billion)
11.3.2.13.2 Switzerland Environmental Sensors Market Estimates and Forecasts, By Type (2020-2032) (USD Billion)
11.3.2.13.3 Switzerland Environmental Sensors Market Estimates and Forecasts, By Application (2020-2032) (USD Billion)
11.3.2.13.4 Switzerland Environmental Sensors Market Estimates and Forecasts, By Vertical (2020-2032) (USD Billion)
11.3.2.14 Austria
11.3.2.14.1 Austria Environmental Sensors Market Estimates and Forecasts, By Location (2020-2032) (USD Billion)
11.3.2.14.2 Austria Environmental Sensors Market Estimates and Forecasts, By Type (2020-2032) (USD Billion)
11.3.2.14.3 Austria Environmental Sensors Market Estimates and Forecasts, By Application (2020-2032) (USD Billion)
11.3.2.14.4 Austria Environmental Sensors Market Estimates and Forecasts, By Vertical (2020-2032) (USD Billion)
11.3.2.15 Rest of Western Europe
11.3.2.15.1 Rest of Western Europe Environmental Sensors Market Estimates and Forecasts, By Location (2020-2032) (USD Billion)
11.3.2.15.2 Rest of Western Europe Environmental Sensors Market Estimates and Forecasts, By Type (2020-2032) (USD Billion)
11.3.2.15.3 Rest of Western Europe Environmental Sensors Market Estimates and Forecasts, By Application (2020-2032) (USD Billion)
11.3.2.15.4 Rest of Western Europe Environmental Sensors Market Estimates and Forecasts, By Vertical (2020-2032) (USD Billion)
11.4 Asia Pacific
11.4.1 Trends Analysis
11.4.2 Asia Pacific Environmental Sensors Market Estimates and Forecasts, by Country (2020-2032) (USD Billion)
11.4.3 Asia Pacific Environmental Sensors Market Estimates and Forecasts, By Location (2020-2032) (USD Billion)
11.4.4 Asia Pacific Environmental Sensors Market Estimates and Forecasts, By Type (2020-2032) (USD Billion)
11.4.5 Asia Pacific Environmental Sensors Market Estimates and Forecasts, By Application (2020-2032) (USD Billion)
11.4.6 Asia Pacific Environmental Sensors Market Estimates and Forecasts, By Vertical (2020-2032) (USD Billion)
11.4.7 China
11.4.7.1 China Environmental Sensors Market Estimates and Forecasts, By Location (2020-2032) (USD Billion)
11.4.7.2 China Environmental Sensors Market Estimates and Forecasts, By Type (2020-2032) (USD Billion)
11.4.7.3 China Environmental Sensors Market Estimates and Forecasts, By Application (2020-2032) (USD Billion)
11.4.7.4 China Environmental Sensors Market Estimates and Forecasts, By Vertical (2020-2032) (USD Billion)
11.4.8 India
11.4.8.1 India Environmental Sensors Market Estimates and Forecasts, By Location (2020-2032) (USD Billion)
11.4.8.2 India Environmental Sensors Market Estimates and Forecasts, By Type (2020-2032) (USD Billion)
11.4.8.3 India Environmental Sensors Market Estimates and Forecasts, By Application (2020-2032) (USD Billion)
11.4.8.4 India Environmental Sensors Market Estimates and Forecasts, By Vertical (2020-2032) (USD Billion)
11.4.9 Japan
11.4.9.1 Japan Environmental Sensors Market Estimates and Forecasts, By Location (2020-2032) (USD Billion)
11.4.9.2 Japan Environmental Sensors Market Estimates and Forecasts, By Type (2020-2032) (USD Billion)
11.4.9.3 Japan Environmental Sensors Market Estimates and Forecasts, By Application (2020-2032) (USD Billion)
11.4.9.4 Japan Environmental Sensors Market Estimates and Forecasts, By Vertical (2020-2032) (USD Billion)
11.4.10 South Korea
11.4.10.1 South Korea Environmental Sensors Market Estimates and Forecasts, By Location (2020-2032) (USD Billion)
11.4.10.2 South Korea Environmental Sensors Market Estimates and Forecasts, By Type (2020-2032) (USD Billion)
11.4.10.3 South Korea Environmental Sensors Market Estimates and Forecasts, By Application (2020-2032) (USD Billion)
11.4.10.4 South Korea Environmental Sensors Market Estimates and Forecasts, By Vertical (2020-2032) (USD Billion)
11.4.11 Vietnam
11.4.11.1 Vietnam Environmental Sensors Market Estimates and Forecasts, By Location (2020-2032) (USD Billion)
11.4.11.2 Vietnam Environmental Sensors Market Estimates and Forecasts, By Type (2020-2032) (USD Billion)
11.4.11.3 Vietnam Environmental Sensors Market Estimates and Forecasts, By Application (2020-2032) (USD Billion)
11.4.11.4 Vietnam Environmental Sensors Market Estimates and Forecasts, By Vertical (2020-2032) (USD Billion)
11.4.12 Singapore
11.4.12.1 Singapore Environmental Sensors Market Estimates and Forecasts, By Location (2020-2032) (USD Billion)
11.4.12.2 Singapore Environmental Sensors Market Estimates and Forecasts, By Type (2020-2032) (USD Billion)
11.4.12.3 Singapore Environmental Sensors Market Estimates and Forecasts, By Application (2020-2032) (USD Billion)
11.4.12.4 Singapore Environmental Sensors Market Estimates and Forecasts, By Vertical (2020-2032) (USD Billion)
11.4.13 Australia
11.4.13.1 Australia Environmental Sensors Market Estimates and Forecasts, By Location (2020-2032) (USD Billion)
11.4.13.2 Australia Environmental Sensors Market Estimates and Forecasts, By Type (2020-2032) (USD Billion)
11.4.13.3 Australia Environmental Sensors Market Estimates and Forecasts, By Application (2020-2032) (USD Billion)
11.4.13.4 Australia Environmental Sensors Market Estimates and Forecasts, By Vertical (2020-2032) (USD Billion)
11.4.14 Rest of Asia Pacific
11.4.14.1 Rest of Asia Pacific Environmental Sensors Market Estimates and Forecasts, By Location (2020-2032) (USD Billion)
11.4.14.2 Rest of Asia Pacific Environmental Sensors Market Estimates and Forecasts, By Type (2020-2032) (USD Billion)
11.4.14.3 Rest of Asia Pacific Environmental Sensors Market Estimates and Forecasts, By Application (2020-2032) (USD Billion)
11.4.14.4 Rest of Asia Pacific Environmental Sensors Market Estimates and Forecasts, By Vertical (2020-2032) (USD Billion)
11.5 Middle East and Africa
11.5.1 Middle East
11.5.1.1 Trends Analysis
11.5.1.2 Middle East Environmental Sensors Market Estimates and Forecasts, by Country (2020-2032) (USD Billion)
11.5.1.3 Middle East Environmental Sensors Market Estimates and Forecasts, By Location (2020-2032) (USD Billion)
11.5.1.4 Middle East Environmental Sensors Market Estimates and Forecasts, By Type (2020-2032) (USD Billion)
11.5.1.5 Middle East Environmental Sensors Market Estimates and Forecasts, By Application (2020-2032) (USD Billion)
11.5.1.6 Middle East Environmental Sensors Market Estimates and Forecasts, By Vertical (2020-2032) (USD Billion)
11.5.1.7 UAE
11.5.1.7.1 UAE Environmental Sensors Market Estimates and Forecasts, By Location (2020-2032) (USD Billion)
11.5.1.7.2 UAE Environmental Sensors Market Estimates and Forecasts, By Type (2020-2032) (USD Billion)
11.5.1.7.3 UAE Environmental Sensors Market Estimates and Forecasts, By Application (2020-2032) (USD Billion)
11.5.1.7.4 UAE Environmental Sensors Market Estimates and Forecasts, By Vertical (2020-2032) (USD Billion)
11.5.1.8 Egypt
11.5.1.8.1 Egypt Environmental Sensors Market Estimates and Forecasts, By Location (2020-2032) (USD Billion)
11.5.1.8.2 Egypt Environmental Sensors Market Estimates and Forecasts, By Type (2020-2032) (USD Billion)
11.5.1.8.3 Egypt Environmental Sensors Market Estimates and Forecasts, By Application (2020-2032) (USD Billion)
11.5.1.8.4 Egypt Environmental Sensors Market Estimates and Forecasts, By Vertical (2020-2032) (USD Billion)
11.5.1.9 Saudi Arabia
11.5.1.9.1 Saudi Arabia Environmental Sensors Market Estimates and Forecasts, By Location (2020-2032) (USD Billion)
11.5.1.9.2 Saudi Arabia Environmental Sensors Market Estimates and Forecasts, By Type (2020-2032) (USD Billion)
11.5.1.9.3 Saudi Arabia Environmental Sensors Market Estimates and Forecasts, By Application (2020-2032) (USD Billion)
11.5.1.9.4 Saudi Arabia Environmental Sensors Market Estimates and Forecasts, By Vertical (2020-2032) (USD Billion)
11.5.1.10 Qatar
11.5.1.10.1 Qatar Environmental Sensors Market Estimates and Forecasts, By Location (2020-2032) (USD Billion)
11.5.1.10.2 Qatar Environmental Sensors Market Estimates and Forecasts, By Type (2020-2032) (USD Billion)
11.5.1.10.3 Qatar Environmental Sensors Market Estimates and Forecasts, By Application (2020-2032) (USD Billion)
11.5.1.10.4 Qatar Environmental Sensors Market Estimates and Forecasts, By Vertical (2020-2032) (USD Billion)
11.5.1.11 Rest of Middle East
11.5.1.11.1 Rest of Middle East Environmental Sensors Market Estimates and Forecasts, By Location (2020-2032) (USD Billion)
11.5.1.11.2 Rest of Middle East Environmental Sensors Market Estimates and Forecasts, By Type (2020-2032) (USD Billion)
11.5.1.11.3 Rest of Middle East Environmental Sensors Market Estimates and Forecasts, By Application (2020-2032) (USD Billion)
11.5.1.11.4 Rest of Middle East Environmental Sensors Market Estimates and Forecasts, By Vertical (2020-2032) (USD Billion)
11.5.2 Africa
11.5.2.1 Trends Analysis
11.5.2.2 Africa Environmental Sensors Market Estimates and Forecasts, by Country (2020-2032) (USD Billion)
11.5.2.3 Africa Environmental Sensors Market Estimates and Forecasts, By Location (2020-2032) (USD Billion)
11.5.2.4 Africa Environmental Sensors Market Estimates and Forecasts, By Type (2020-2032) (USD Billion)
11.5.2.5 Africa Environmental Sensors Market Estimates and Forecasts, By Application (2020-2032) (USD Billion)
11.5.2.6 Africa Environmental Sensors Market Estimates and Forecasts, By Vertical (2020-2032) (USD Billion)
11.5.2.7 South Africa
11.5.2.7.1 South Africa Environmental Sensors Market Estimates and Forecasts, By Location (2020-2032) (USD Billion)
11.5.2.7.2 South Africa Environmental Sensors Market Estimates and Forecasts, By Type (2020-2032) (USD Billion)
11.5.2.7.3 South Africa Environmental Sensors Market Estimates and Forecasts, By Application (2020-2032) (USD Billion)
11.5.2.7.4 South Africa Environmental Sensors Market Estimates and Forecasts, By Vertical (2020-2032) (USD Billion)
11.5.2.8 Nigeria
11.5.2.8.1 Nigeria Environmental Sensors Market Estimates and Forecasts, By Location (2020-2032) (USD Billion)
11.5.2.8.2 Nigeria Environmental Sensors Market Estimates and Forecasts, By Type (2020-2032) (USD Billion)
11.5.2.8.3 Nigeria Environmental Sensors Market Estimates and Forecasts, By Application (2020-2032) (USD Billion)
11.5.2.8.4 Nigeria Environmental Sensors Market Estimates and Forecasts, By Vertical (2020-2032) (USD Billion)
11.5.2.9 Rest of Africa
11.5.2.9.1 Rest of Africa Environmental Sensors Market Estimates and Forecasts, By Location (2020-2032) (USD Billion)
11.5.2.9.2 Rest of Africa Environmental Sensors Market Estimates and Forecasts, By Type (2020-2032) (USD Billion)
11.5.2.9.3 Rest of Africa Environmental Sensors Market Estimates and Forecasts, By Application (2020-2032) (USD Billion)
11.5.2.9.4 Rest of Africa Environmental Sensors Market Estimates and Forecasts, By Vertical (2020-2032) (USD Billion)
11.6 Latin America
11.6.1 Trends Analysis
11.6.2 Latin America Environmental Sensors Market Estimates and Forecasts, by Country (2020-2032) (USD Billion)
11.6.3 Latin America Environmental Sensors Market Estimates and Forecasts, By Location (2020-2032) (USD Billion)
11.6.4 Latin America Environmental Sensors Market Estimates and Forecasts, By Type (2020-2032) (USD Billion)
11.6.5 Latin America Environmental Sensors Market Estimates and Forecasts, By Application (2020-2032) (USD Billion)
11.6.6 Latin America Environmental Sensors Market Estimates and Forecasts, By Vertical (2020-2032) (USD Billion)
11.6.7 Brazil
11.6.7.1 Brazil Environmental Sensors Market Estimates and Forecasts, By Location (2020-2032) (USD Billion)
11.6.7.2 Brazil Environmental Sensors Market Estimates and Forecasts, By Type (2020-2032) (USD Billion)
11.6.7.3 Brazil Environmental Sensors Market Estimates and Forecasts, By Application (2020-2032) (USD Billion)
11.6.7.4 Brazil Environmental Sensors Market Estimates and Forecasts, By Vertical (2020-2032) (USD Billion)
11.6.8 Argentina
11.6.8.1 Argentina Environmental Sensors Market Estimates and Forecasts, By Location (2020-2032) (USD Billion)
11.6.8.2 Argentina Environmental Sensors Market Estimates and Forecasts, By Type (2020-2032) (USD Billion)
11.6.8.3 Argentina Environmental Sensors Market Estimates and Forecasts, By Application (2020-2032) (USD Billion)
11.6.8.4 Argentina Environmental Sensors Market Estimates and Forecasts, By Vertical (2020-2032) (USD Billion)
11.6.9 Colombia
11.6.9.1 Colombia Environmental Sensors Market Estimates and Forecasts, By Location (2020-2032) (USD Billion)
11.6.9.2 Colombia Environmental Sensors Market Estimates and Forecasts, By Type (2020-2032) (USD Billion)
11.6.9.3 Colombia Environmental Sensors Market Estimates and Forecasts, By Application (2020-2032) (USD Billion)
11.6.9.4 Colombia Environmental Sensors Market Estimates and Forecasts, By Vertical (2020-2032) (USD Billion)
11.6.10 Rest of Latin America
11.6.10.1 Rest of Latin America Environmental Sensors Market Estimates and Forecasts, By Location (2020-2032) (USD Billion)
11.6.10.2 Rest of Latin America Environmental Sensors Market Estimates and Forecasts, By Type (2020-2032) (USD Billion)
11.6.10.3 Rest of Latin America Environmental Sensors Market Estimates and Forecasts, By Application (2020-2032) (USD Billion)
11.6.10.4 Rest of Latin America Environmental Sensors Market Estimates and Forecasts, By Vertical (2020-2032) (USD Billion)
12. Company Profiles
12.1 Sensirion AG
12.1.1 Company Overview
12.1.2 Financial
12.1.3 Products/ Services Offered
12.1.4 SWOT Analysis
12.2 Honeywell International Inc
12.2.1 Company Overview
12.2.2 Financial
12.2.3 Products/ Services Offered
12.2.4 SWOT Analysis
12.3 Siemens AG.
12.3.1 Company Overview
12.3.2 Financial
12.3.3 Products/ Services Offered
12.3.4 SWOT Analysis
12.4 ams-OSRAM AG
12.4.1 Company Overview
12.4.2 Financial
12.4.3 Products/ Services Offered
12.4.4 SWOT Analysis
12.5 Bosch Sensortec GmbH
12.5.1 Company Overview
12.5.2 Financial
12.5.3 Products/ Services Offered
12.5.4 SWOT Analysis
12.6 OMRON Corporation
12.6.1 Company Overview
12.6.2 Financial
12.6.3 Products/ Services Offered
12.6.4 SWOT Analysis
12.7 Raritan Inc
12.7.1 Company Overview
12.7.2 Financial
12.7.3 Products/ Services Offered
12.7.4 SWOT Analysis
12.8 Texas Instruments Incorporated
12.8.1 Company Overview
12.8.2 Financial
12.8.3 Products/ Services Offered
12.8.4 SWOT Analysis
12.9 Schneider Electric
12.9.1 Company Overview
12.9.2 Financial
12.9.3 Products/ Services Offered
12.9.4 SWOT Analysis
12.10 Amphenol Corporation
12.10.1 Company Overview
12.10.2 Financial
12.10.3 Products/ Services Offered
12.10.4 SWOT Analysis
13. Use Cases and Best Practices
14. Conclusion
An accurate research report requires proper strategizing as well as implementation. There are multiple factors involved in the completion of good and accurate research report and selecting the best methodology to compete the research is the toughest part. Since the research reports we provide play a crucial role in any company’s decision-making process, therefore we at SNS Insider always believe that we should choose the best method which gives us results closer to reality. This allows us to reach at a stage wherein we can provide our clients best and accurate investment to output ratio.
Each report that we prepare takes a timeframe of 350-400 business hours for production. Starting from the selection of titles through a couple of in-depth brain storming session to the final QC process before uploading our titles on our website we dedicate around 350 working hours. The titles are selected based on their current market cap and the foreseen CAGR and growth.
The 5 steps process:
Step 1: Secondary Research:
Secondary Research or Desk Research is as the name suggests is a research process wherein, we collect data through the readily available information. In this process we use various paid and unpaid databases which our team has access to and gather data through the same. This includes examining of listed companies’ annual reports, Journals, SEC filling etc. Apart from this our team has access to various associations across the globe across different industries. Lastly, we have exchange relationships with various university as well as individual libraries.

Step 2: Primary Research
When we talk about primary research, it is a type of study in which the researchers collect relevant data samples directly, rather than relying on previously collected data. This type of research is focused on gaining content specific facts that can be sued to solve specific problems. Since the collected data is fresh and first hand therefore it makes the study more accurate and genuine.
We at SNS Insider have divided Primary Research into 2 parts.
Part 1 wherein we interview the KOLs of major players as well as the upcoming ones across various geographic regions. This allows us to have their view over the market scenario and acts as an important tool to come closer to the accurate market numbers. As many as 45 paid and unpaid primary interviews are taken from both the demand and supply side of the industry to make sure we land at an accurate judgement and analysis of the market.
This step involves the triangulation of data wherein our team analyses the interview transcripts, online survey responses and observation of on filed participants. The below mentioned chart should give a better understanding of the part 1 of the primary interview.

Part 2: In this part of primary research the data collected via secondary research and the part 1 of the primary research is validated with the interviews from individual consultants and subject matter experts.
Consultants are those set of people who have at least 12 years of experience and expertise within the industry whereas Subject Matter Experts are those with at least 15 years of experience behind their back within the same space. The data with the help of two main processes i.e., FGDs (Focused Group Discussions) and IDs (Individual Discussions). This gives us a 3rd party nonbiased primary view of the market scenario making it a more dependable one while collation of the data pointers.
Step 3: Data Bank Validation
Once all the information is collected via primary and secondary sources, we run that information for data validation. At our intelligence centre our research heads track a lot of information related to the market which includes the quarterly reports, the daily stock prices, and other relevant information. Our data bank server gets updated every fortnight and that is how the information which we collected using our primary and secondary information is revalidated in real time.

Step 4: QA/QC Process
After all the data collection and validation our team does a final level of quality check and quality assurance to get rid of any unwanted or undesired mistakes. This might include but not limited to getting rid of the any typos, duplication of numbers or missing of any important information. The people involved in this process include technical content writers, research heads and graphics people. Once this process is completed the title gets uploader on our platform for our clients to read it.
Step 5: Final QC/QA Process:
This is the last process and comes when the client has ordered the study. In this process a final QA/QC is done before the study is emailed to the client. Since we believe in giving our clients a good experience of our research studies, therefore, to make sure that we do not lack at our end in any way humanly possible we do a final round of quality check and then dispatch the study to the client.
Key Segments:
By Location
Outdoor
Indoor
Portable
By Type
Temperature
Chemicals
Humidity
Water Quality
Air Quality
Integrated
Ultraviolet (UV)
Soil Moisture
Gas
Smoke
By Application
Smart City
Smart Home Automation
Smart Office Automation
Others
By Vertical
Government
Industrial
Healthcare
Residential
Commercial
Consumer Electronics
Enterprise
Request for Segment Customization as per your Business Requirement: Segment Customization Request
REGIONAL COVERAGE:
North America
US
Canada
Mexico
Europe
Eastern Europe
Poland
Romania
Hungary
Turkey
Rest of Eastern Europe
Western Europe
Germany
France
UK
Italy
Spain
Netherlands
Switzerland
Austria
Rest of Western Europe
Asia Pacific
China
India
Japan
South Korea
Vietnam
Singapore
Australia
Rest of Asia Pacific
Middle East & Africa
Middle East
UAE
Egypt
Saudi Arabia
Qatar
Rest of the Middle East
Africa
Nigeria
South Africa
Rest of Africa
Latin America
Brazil
Argentina
Colombia
Rest of Latin America
Request for Country Level Research Report: Country Level Customization Request
Available Customization
With the given market data, SNS Insider offers customization as per the company’s specific needs. The following customization options are available for the report:
Product Analysis
Criss-Cross segment analysis (e.g. Product X Application)
Product Matrix which gives a detailed comparison of the product portfolio of each company
Geographic Analysis
Additional countries in any of the regions
Company Information
Detailed analysis and profiling of additional market players (Up to five)
The Fingerprint Sensor Market Size was valued at USD 3.9 billion in 2023 and is expected to grow at a CAGR of 6.65% to reach USD 6.96 billion by 2032.
The Routing Market Size was valued at USD 15.4 billion in 2023, and is expected to reach USD 33.44 billion by 2032, and grow at a CAGR of 9 % by 2024-2032.
The Optical Sorter Market size was valued at USD 2.61 billion in 2023 and is expected to reach USD 5.33 billion by 2032 and grow at a CAGR of 8.33% over the forecast period 2024-2032.
The Electronic Packaging Market size was valued at USD 1.01 billion in 2023 and is expected to reach USD 4.48 billion by 2032 and grow at a CAGR of 18.02% over the forecast period 2024-2032.
The Drone Camera Market Size was valued at USD 14.20 billion in 2023 and is expected to reach USD 145.45 billion by 2032 and grow at a CAGR of 29.5% over the forecast period 2024-2032.
The Hearth Market was valued at USD 15.31 billion in 2023 and is expected to reach USD 22.73 billion by 2032, growing at a CAGR of 4.52% over the forecast period 2024-2032.

Hi! Click one of our member below to chat on Phone
© 2025 All Rights Reserved by SNS Insider Pvt Ltd


