image

Enriched Biochar Market Report Scope & Overview:

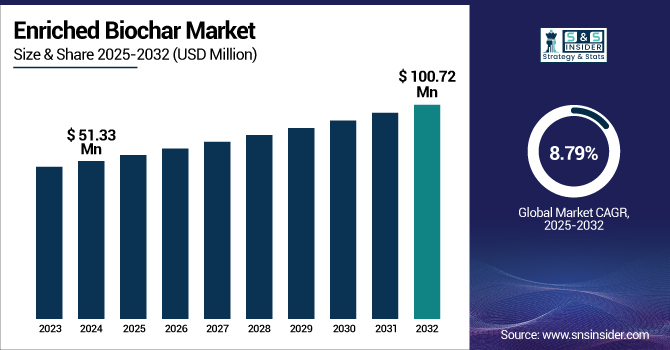
The Enriched Biochar Market size was valued at USD 51.33 million in 2024 and is expected to reach USD 100.72 million by 2032, growing at a CAGR of 8.79% over the forecast period of 2025-2032.

Enriched Biochar Market Revenue Analysis

To Get more information on Enriched Biochar Market - Request Free Sample Report

With the increased awareness toward sustainable agricultural practices, the biochar industry is expanding rapidly. Farmers are also using biochar, enriched as a soil amendment for improved soil fertility, greater nutrient retention, and water conservation. The addition of nitrogen, phosphorus, and potassium to biochar increases its effectiveness as a fertilizer, consistent with the trend toward organic cultivation and reduced use of synthetic fertilizers.

According to the Economic Research Service of the U.S. Department of Agriculture, agriculture and agriculture-linked industries represented USD 1.537 trillion, or 5.5% of the U.S. GDP in 2023. This highlights the importance of sustainable inputs, such as biochar and biochar-enriched products.

Biochar is known to increase plant productivity, enhance nutrient cycling, and increase soil carbon stocks, as shown by all evidence provided by the research conducted by the USDA Agricultural Research Service. The USDA Forest service also highlights the possibility of biochar fertilizer to be used as a tool to rehabilitate degraded soils and thus make it an important instrument in the sustainability of ecosystems.

Market Dynamics:

Drivers:

  • Growing Awareness Regarding Soil Health Importance and Fertility Improvement Among Farmers Propel Market Growth

Soil health has gained recognition as a valuable co-benefit possible through biochar production and application, stimulating the enriched biochar market growth. Enriched biochar increases the fertility of the soil, water holding capacity, and promotes sustainable agriculture. As the harmful effects of chemical fertilizers become more apparent, organic and green soil amendments are increasingly being sought after.

For instance, according to the USDA’s Agricultural Research Service, biochar improves the nutrient holding capacity, soil carbon stock, and plant yields.  It also helps slow soil loss, one of the most pressing problems in most agricultural areas.

Enriched biochar is being used to enhance soil fertility, and the agricultural sector is expected to develop the biochar industry due to specific benefits of it. Consequently, farmers are progressively utilizing this biochar fertilizer.

  • Positive Impact of Government Regulations and Incentives to Promote Sustainable Agriculture Fuel Market Expansion

As governments are pushing for sustainable agribusiness globally, the biochar industry is being positively impacted. In addition, the green ways are promoted by policies that seek to have healthier soils and dependency-less on chemical fertilizers.

For instance, according to the U.S. Department of Agriculture's Economic Research Service, in 2023 the agricultural sector constituted 5.5% of the U.S. GDP.

Additionally, governments are encouraging organic farming, including biochar fertilizer as soil conditioner. These regulations increasingly encourage a move to sustainable agricultural solutions. More government support and investment in the improved biochar industry will also help meet environmental targets since biochar seizes carbon in line with global climate change mitigation objectives.

Restraints:

  • Market Growth is Impeded due to Lack of Harmonization of Biochar Quality Standards at Regional Level

Low quality standards at different sites are one of the major aspects preventing the growth of enriched biochar market. The absence of an international benchmark for regulating the quality of biochar has led to discrepancies in the quality of biochar products, which affect the effectiveness and performance. Different standards and testing procedures may be employed by countries leading to misunderstanding and hindering international trade. For instance, some places might have extremely stringent standards for carbon content that vary from those of some other areas or could certify biochar with only particular feedstocks. This absence of standardization constrains market integration and slows down the global use of biochar products. Producers who seek to expand globally might struggle to comply with different regional standards, which would impede the growing trend of biochar fertilizer.

  • Variability in Biochar’s Effectiveness across Soil Types and Climatic Conditions Limits its Universal Applicability

The effectiveness of biochar as a soil amendment differs based on soil type and local climate. The contrast between tropical and temperate soils may not only run deeper than predicted by climate characteristics but also indicate that tropical soils are more adapted to some aspects of dry climate than to the humid one. Some soils and mineral may also interfere with the effectiveness of biochar over the long term. Farmers and producers could potentially be deterred from using biochar due to a lack of information about how biochar functions in specific agricultural climates. Consequently, the ranging results achieved across soil types and climate present a challenge to the global biochar market growth.

Segmentation Analysis:

By Technology

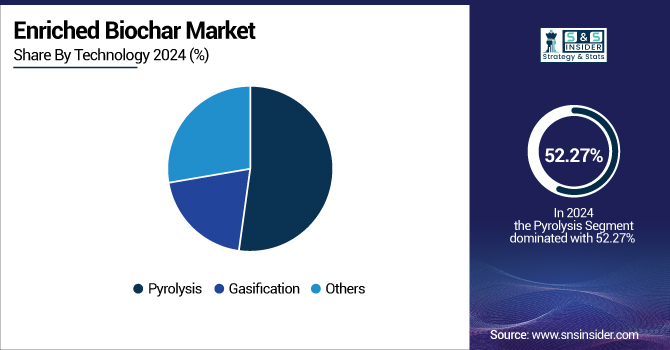
The pyrolysis technology segment dominated the enriched biochar market in 2024 with a market share of 52.27%. The technology is favored due to its ability to generate high-quality biochar by burning organic matter in the absence of oxygen, which increases its carbon sequestration capacity. It also allows for the enrichment of biochar with nutrients, making it suitable for agricultural applications. Pyrolysis is also considered one of the most efficient biomass conversion methods, and is supported by groups including the U.S. Department of Energy. Its supremacy is augmented by the increasing demand for sustainable agriculture and carbon sequestration, especially in assisting the world tackle climate change. Pyrolysis improves soil quality while helping in CO2 reduction, thus becoming one of the best options for biochar fertilizer production.

The gasification technology segment in the enriched biochar market is expected to witness fastest growth during 2025 to 2032.  In contrast, though, biochar is produced as solid residue while organic materials are converted into syngas, the latter being employed for limited energy production. Gasification is gaining popularity as it is more efficient and emits less harmful byproducts in contrast to traditional pyrolysis. It also aligns with the global transition to green and energy from waste solutions.

For instance, the U.S. Environmental Protection Agency emphasizes that gasification, through which energy is produced out of organic waste, aligns with the circular economy. Gasification is also being adopted widely by the governments and industries, which is driving the growth of biochar market in a way of renewable and clean method.

Enriched-Biochar-Market-By-Technology

By Application

In 2024, the agriculture segment dominated the enriched biochar market with a share of 54.67%. This is fueled by growing demand for sustainable agriculture, wherein enriched biochar increases soil fertility, nutrient uptake, and water conservation. It is especially useful in enhancing crop yield and soil health, which are crucial to global food security. The transition to organic farming also increases the application of biochar as a green substitute for chemical fertilizers.

For instance, the U.S. Department of Agriculture (USDA) promotes biochar as part of its sustainable agriculture efforts to cut down on the use of synthetic fertilizers. Biochar has become a popular choice among farmers globally and serves green goals by sequestering carbon.

The turfs segment is projected to emerge as the fastest growing segment in the enriched biochar market during the forecast period. The use of biochar in turf management is expanding due to its ability to improve soil health, retain more water, and encourage grass growth in residential lawns, golf courses, and sports fields. Adoption of biochar in the market is accelerating due to consumer demand for environmentally friendly landscaping techniques. A U.S. Department of Agriculture research underscores the use of biochar for sustainable soil quality and water consumption for turf management. Biochar is a well-known green landscaping remedy attracted by people who are environmentally conscious nowadays.

Regional Analysis:

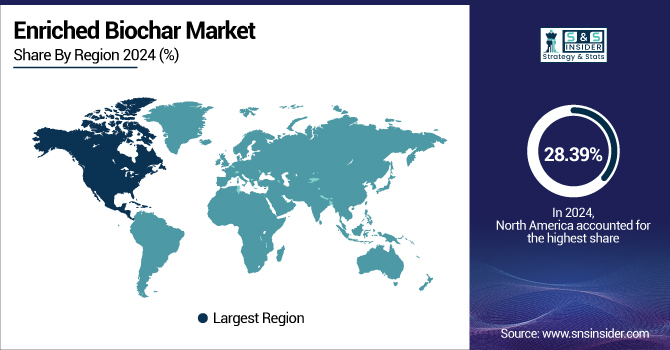
The enriched biochar industry in North America accounted for a market share of about 28.39%, in 2024. The market in North America is led by the U.S. and Canada, and these nations have been at the forefront of establishing sustainable farming and carbon sequestration practices.

For instance, government agencies, such as the U.S. Dollop of Agriculture and Aggregated Defiant Agency played a relevant role in actuality biochar through guidelines and grants for investigation.

In addition, the growing application of biochar in organic agricultural practices and incentives supported by the government have helped drive market growth. The market is dominated by countries, such as the U.S. due to technological developments in biochar and growing interest in soil erosion prevention and soil enrichment.

Europe dominated the enriched biochar market share of 44.83% in 2024 Due to the strict environmental regulations of the European Union, together with the focus on reducing greenhouse gas emissions, the use of biochar fertilizer as a climate change mitigation method has been expanded. Commercialization and biochar research has been led by Germany and the U.K.

For instance, in Germany, EU subsidies for sustainability-oriented agriculture and carbon-free farming methods in general, are stimulating the nascent biochar sector. The EU Green Deal, for instance, promotes biochar as a solution to soil improvement and carbon mitigation.

Asia Pacific held a market share of 14.60% in the enriched biochar market in 2024. China and India are increasingly using biochar technology to enhance soil fertility and agricultural yield due to the region's high dependence on agriculture. China's government initiative towards eco-friendly farming methods and organic fertilizers, and India's interest in using biochar to enhance water holding capacity in drought-prone areas, are major drivers.

For instance, India has been pushing biochar under its National Mission on Sustainable Agriculture to increase crop yields and improve soil fertility.

Latin America has also emerged as the fastest-growing region for enriched biochar market throughout the forecast period growing with a significant CAGR. Brazil and Argentina are among the leading countries, which are rapidly adopting biochar as part of their agricultural routines owing to increased focus on sustainable agriculture and soil rejuvenation. Research into biochar by the Brazilian government has been widely known and has actively sponsored research, mainly for prevention of soil deterioration and increasingly if it can be used for agricultural yield especially in the Amazon area. Growth of Latin America biochar market will be driven by the increasing focus on enhancing soil health and promoting sustainable agriculture.

Enriched-Biochar-Market-By-Region

Get Customized Report as per Your Business Requirement - Enquiry Now

Key Players:

The major competitors operating in the market are Carbon Gold Ltd, CharGrow, Bio365, The Natural Charcoal Company, The Dorset Charcoal Company, Swiss Biochar GmbH, Engrow Carbon Energy Private Limited, SoilFixer, SymSoil, and Biochar Supreme LLC.

Recent Developments:

  • March 2025: In a recent study, biochar has been confirmed for its effectiveness in increasing water holding capacity and lowering soil salinity to improve crop yield.

  • January 2025: OMRI Certification granted for American BioCarbon's biochar for use in organic crop production, enhancing soil health and market proofing making it organic with more sustainable practices.

Enriched Biochar Market Report Scope

Report Attributes Details
Market Size in 2024 USD 51.33 Million
Market Size by 2032 USD 100.72 Million
CAGR CAGR of 8.79% From 2025 to 2032
Base Year 2024
Forecast Period 2025-2032
Historical Data 2021-2023
Report Scope & Coverage Market Size, Segments Analysis, Competitive Landscape, Regional Analysis, DROC & SWOT Analysis, Forecast Outlook
Key Segments •By Technology (Pyrolysis, Gasification, Others)
•By Application (Agriculture, Gardening, Turfs, Others)
Regional Analysis/Coverage North America (US, Canada, Mexico), Europe (Germany, France, UK, Italy, Spain, Poland, Turkey, Rest of Europe), Asia Pacific (China, India, Japan, South Korea, Singapore, Australia, Rest of Asia Pacific), Middle East & Africa (UAE, Saudi Arabia, Qatar, South Africa, Rest of Middle East & Africa), Latin America (Brazil, Argentina, Rest of Latin America)
Company Profiles Carbon Gold Ltd, CharGrow, Bio365, The Natural Charcoal Company, The Dorset Charcoal Company, Swiss Biochar GmbH, Engrow Carbon Energy Private Limited, SoilFixer, SymSoil, Biochar Supreme LLC

Frequently Asked Questions

Ans: The enriched biochar market was valued at USD 51.33 million in 2024 and is expected to reach USD 100.72 million by 2032, growing at a CAGR of 8.79%.

Ans: Enriched biochar aids climate change mitigation by enhancing carbon sequestration, promoting sustainable agriculture, and reducing soil degradation, supporting global green initiatives.

Ans: Europe holds the largest share of the enriched biochar market driven by strict environmental policies and a focus on sustainable farming practices to reduce greenhouse gas emissions.

Ans: Governments are encouraging sustainable farming practices through regulations and incentives, promoting biochar adoption as an eco-friendly alternative to synthetic fertilizers in the enriched biochar market.

Ans: The turf segment is the fastest-growing in the enriched biochar market due to the increasing demand for eco-friendly landscaping practices and biochar’s benefits for soil health and water retention.

Table of Content

1. Introduction

1.1 Market Definition

1.2 Scope (Inclusion and Exclusions)

1.3 Research Assumptions

2. Executive Summary

2.1 Market Overview        

2.2 Regional Synopsis

2.3 Competitive Summary

3. Research Methodology

3.1 Top-Down Approach

3.2 Bottom-up Approach

3.3. Data Validation

3.4 Primary Interviews

4. Market Dynamics Impact Analysis

4.1 Market Driving Factors Analysis

4.1.2 Drivers

4.1.2 Restraints

4.1.3 Opportunities

4.1.4 Challenges

4.2 PESTLE Analysis

4.3 Porter’s Five Forces Model

5. Statistical Insights and Trends Reporting

5.1 Comparative Yield Analysis With Traditional Fertilizers

5.2 Waste-to-Biochar Conversion Efficiency Rates

5.3 Greenhouse Gas Emissions Reduction Impact

5.4 Climate-Specific Performance Comparisons

5.5 Intellectual Property and Patent Filing Trends

6. Competitive Landscape

6.1 List of Major Companies By Region

6.2 Market Share Analysis By Region

6.3 Technology Benchmarking

6.3.1 Technology specifications and features

6.3.2 Pricing

6.4 Strategic Initiatives

6.4.1 Marketing and promotional activities

6.4.2 Distribution and Supply Chain Strategies

6.4.3 Expansion Plans and New Technology Launches

6.4.4 Strategic partnerships and collaborations

6.5 Technological Advancements

6.6 Market Positioning and Branding

7. Copper Foil Market Segmentation By Technology

7.1 Chapter Overview

7.2 Pyrolysis

        7.2.1 Pyrolysis Trend Analysis (2021-2032)

7.2.2 Pyrolysis Market Size Estimates and Forecasts to 2032 (USD Million)

7.3 Gasification

       7.3.1 Gasification Market Trends Analysis (2021-2032)

       7.3.2 Gasification Market Size Estimates and Forecasts to 2032 (USD Million)

7.4 Others

       7.4.1 Others Market Trends Analysis (2021-2032)

       7.4.2 Others Market Size Estimates and Forecasts to 2032 (USD Million)

8. Copper Foil Market Segmentation By Application

8.1 Chapter Overview

8.2 Agriculture

        8.2.1 Agriculture Market Trends Analysis (2021-2032)

8.2.2 Agriculture Market Size Estimates and Forecasts to 2032 (USD Million)

8.3 Gardening

      8.3.1 Gardening Market Trends Analysis (2021-2032)

      8.3.2 Gardening Market Size Estimates and Forecasts to 2032 (USD Million)

8.4 Turfs

        8.4.1 Turfs Market Trends Analysis (2021-2032)

8.4.2 Turfs Market Size Estimates and Forecasts to 2032 (USD Million)

8.5 Others

        8.5.1 Others Market Trends Analysis (2021-2032)

8.5.2 Others Market Size Estimates and Forecasts to 2032 (USD Million)

9. Regional Analysis

     9.1 Chapter Overview

     9.2 North America

9.2.1 Trends Analysis

9.2.2 North America Copper Foil Market Estimates and Forecasts, by Country (2021-2032) (USD Million)

9.2.3 North America Copper Foil Market Estimates and Forecasts, By Technology (2021-2032) (USD Million) 

9.2.4 North America Copper Foil Market Estimates and Forecasts, By Application (2021-2032) (USD Million)

9.2.5 USA

9.2.5.1 USA Copper Foil Market Estimates and Forecasts, By Technology (2021-2032) (USD Million)

9.2.5.2 USA Copper Foil Market Estimates and Forecasts, By Application (2021-2032) (USD Million)

9.2.6 Canada

9.2.6.1 Canada Copper Foil Market Estimates and Forecasts, By Technology (2021-2032) (USD Million)

9.2.6.2 Canada Copper Foil Market Estimates and Forecasts, By Application (2021-2032) (USD Million)

9.2.7 Mexico

9.2.7.1 Mexico Copper Foil Market Estimates and Forecasts, By Technology (2021-2032) (USD Million)

9.2.7.2 Mexico Copper Foil Market Estimates and Forecasts, By Application (2021-2032) (USD Million)

9.3 Europe

9.3.1 Trends Analysis

9.3.2 Europe Copper Foil Market Estimates and Forecasts, by Country (2021-2032) (USD Million)

9.3.3 Europe Copper Foil Market Estimates and Forecasts, By Technology (2021-2032) (USD Million) 

9.3.4 Europe Copper Foil Market Estimates and Forecasts, By Application (2021-2032) (USD Million)

9.3.5 Germany

9.3.5.1 Germany Copper Foil Market Estimates and Forecasts, By Technology (2021-2032) (USD Million)

9.3.5.2 Germany Copper Foil Market Estimates and Forecasts, By Application (2021-2032) (USD Million)

9.3.6 France

9.3.6.1 France Copper Foil Market Estimates and Forecasts, By Technology (2021-2032) (USD Million)

9.3.6.2 France Copper Foil Market Estimates and Forecasts, By Application (2021-2032) (USD Million)

9.3.7 UK

9.3.7.1 UK Copper Foil Market Estimates and Forecasts, By Technology (2021-2032) (USD Million)

9.3.7.2 UK Copper Foil Market Estimates and Forecasts, By Application (2021-2032) (USD Million)

9.3.8 Italy

9.3.8.1 Italy Copper Foil Market Estimates and Forecasts, By Technology (2021-2032) (USD Million)

9.3.8.2 Italy Copper Foil Market Estimates and Forecasts, By Application (2021-2032) (USD Million)

9.3.9 Spain

9.3.9.1 Spain Copper Foil Market Estimates and Forecasts, By Technology (2021-2032) (USD Million)

9.3.9.2 Spain Copper Foil Market Estimates and Forecasts, By Application (2021-2032) (USD Million)

9.3.10 Poland

9.3.10.1 Poland Copper Foil Market Estimates and Forecasts, By Technology (2021-2032) (USD Million)

9.3.10.2 Poland Copper Foil Market Estimates and Forecasts, By Application (2021-2032) (USD Million)

9.3.11 Turkey

9.3.11.1 Turkey Copper Foil Market Estimates and Forecasts, By Technology (2021-2032) (USD Million)

9.3.11.2 Turkey Copper Foil Market Estimates and Forecasts, By Application (2021-2032) (USD Million)

9.3.12 Rest of Europe

9.3.12.1 Rest of Europe Copper Foil Market Estimates and Forecasts, By Technology (2021-2032) (USD Million)

9.3.12.2 Rest of Europe Copper Foil Market Estimates and Forecasts, By Application (2021-2032) (USD Million)

9.4 Asia Pacific

9.4.1 Trends Analysis

9.4.2 Asia Pacific Copper Foil Market Estimates and Forecasts, by Country (2021-2032) (USD Million)

9.4.3 Asia Pacific Copper Foil Market Estimates and Forecasts, By Technology (2021-2032) (USD Million) 

9.4.4 Asia Pacific Copper Foil Market Estimates and Forecasts, By Application (2021-2032) (USD Million)

9.4.5 China

9.4.5.1 China Copper Foil Market Estimates and Forecasts, By Technology (2021-2032) (USD Million)

9.4.5.2 China Copper Foil Market Estimates and Forecasts, By Application (2021-2032) (USD Million)

9.4.6 India

9.4.5.1 India Copper Foil Market Estimates and Forecasts, By Technology (2021-2032) (USD Million)

9.4.5.2 India Copper Foil Market Estimates and Forecasts, By Application (2021-2032) (USD Million)

9.4.5 Japan

9.4.5.1 Japan Copper Foil Market Estimates and Forecasts, By Technology (2021-2032) (USD Million)

9.4.5.2 Japan Copper Foil Market Estimates and Forecasts, By Application (2021-2032) (USD Million)

9.4.6 South Korea

9.4.6.1 South Korea Copper Foil Market Estimates and Forecasts, By Technology (2021-2032) (USD Million)

9.4.6.2 South Korea Copper Foil Market Estimates and Forecasts, By Application (2021-2032) (USD Million)

9.4.7 Singapore

9.4.7.1 Singapore Copper Foil Market Estimates and Forecasts, By Technology (2021-2032) (USD Million)

9.4.7.2 Singapore Copper Foil Market Estimates and Forecasts, By Application (2021-2032) (USD Million)

8.4.8 Australia

8.4.8.1 Australia Copper Foil Market Estimates and Forecasts, By Technology (2021-2032) (USD Million)

8.4.8.2 Australia Copper Foil Market Estimates and Forecasts, By Application (2021-2032) (USD Million)

9.4.9 Rest of Asia Pacific

9.4.9.1 Rest of Asia Pacific Copper Foil Market Estimates and Forecasts, By Technology (2021-2032) (USD Million)

9.4.9.2 Rest of Asia Pacific Copper Foil Market Estimates and Forecasts, By Application (2021-2032) (USD Million)

9.5 Middle East & Africa

9.5.1 Trends Analysis

9.5.2 Middle East & Africa Copper Foil Market Estimates and Forecasts, by Country (2021-2032) (USD Million)

9.5.3 Middle East & Africa Copper Foil Market Estimates and Forecasts, By Technology (2021-2032) (USD Million) 

9.5.4 Middle East & Africa Copper Foil Market Estimates and Forecasts, By Application (2021-2032) (USD Million)

9.5.5 UAE

9.5.5.1 UAE Copper Foil Market Estimates and Forecasts, By Technology (2021-2032) (USD Million)

9.5.5.2 UAE Copper Foil Market Estimates and Forecasts, By Application (2021-2032) (USD Million)

9.5.6 Saudi Arabia

9.5.6.1 Saudi Arabia Copper Foil Market Estimates and Forecasts, By Technology (2021-2032) (USD Million)

9.5.6.2 Saudi Arabia Copper Foil Market Estimates and Forecasts, By Application (2021-2032) (USD Million)

9.5.7 Qatar

9.5.7.1 Qatar Copper Foil Market Estimates and Forecasts, By Technology (2021-2032) (USD Million)

9.5.7.2 Qatar Copper Foil Market Estimates and Forecasts, By Application (2021-2032) (USD Million)

9.5.8 South Africa

9.5.8.1 South Africa Copper Foil Market Estimates and Forecasts, By Technology (2021-2032) (USD Million)

9.5.8.2 South Africa Copper Foil Market Estimates and Forecasts, By Application (2021-2032) (USD Million)

9.5.9 Middle East & Africa

9.5.9.1 Middle East & Africa Copper Foil Market Estimates and Forecasts, By Technology (2021-2032) (USD Million)

9.5.9.2 Middle East & Africa Copper Foil Market Estimates and Forecasts, By Application (2021-2032) (USD Million)

9.6 Latin America

9.6.1 Trends Analysis

9.6.2 Latin America Copper Foil Market Estimates and Forecasts, by Country (2021-2032) (USD Million)

9.6.3 Latin America Copper Foil Market Estimates and Forecasts, By Technology (2021-2032) (USD Million) 

9.6.4 Latin America Copper Foil Market Estimates and Forecasts, By Application (2021-2032) (USD Million)

9.6.5 Brazil

9.6.5.1 Brazil Copper Foil Market Estimates and Forecasts, By Technology (2021-2032) (USD Million)

9.6.5.2 Brazil Copper Foil Market Estimates and Forecasts, By Application (2021-2032) (USD Million)

9.6.6 Argentina

9.6.6.1 Argentina Copper Foil Market Estimates and Forecasts, By Technology (2021-2032) (USD Million)

9.6.6.2 Argentina Copper Foil Market Estimates and Forecasts, By Application (2021-2032) (USD Million)

9.6.7 Rest of Latin America

9.6.7.1 Rest of Latin America Copper Foil Market Estimates and Forecasts, By Technology (2021-2032) (USD Million)

9.6.7.2 Rest of Latin America Copper Foil Market Estimates and Forecasts, By Application (2021-2032) (USD Million)

10. Company Profiles

           10.1 Carbon Gold Ltd

                          10.1.1 Company Overview

10.1.2 Financial

10.1.3 Technology / Services Offered

10.1.4 SWOT Analysis

           10.2 CharGrow

                           10.2.1 Company Overview

10.2.2 Financial

10.2.3 Technology/ Services Offered

10.2.4 SWOT Analysis

10.3 Bio365

              10.3.1 Company Overview

10.3.2 Financial

10.3.3 Technology/ Services Offered

10.3.4 SWOT Analysis

10.4 The Natural Charcoal Company

             10.4.1 Company Overview

10.4.2 Financial

10.4.3 Technology/ Services Offered

10.4.4 SWOT Analysis

10.5 The Dorset Charcoal Company

             10.5.1 Company Overview

10.5.2 Financial

10.5.3 Technology/ Services Offered

10.5.4 SWOT Analysis

10.6 Swiss Biochar GmbH

             10.6.1 Company Overview

10.6.2 Financial

10.6.3 Technology/ Services Offered

10.6.4 SWOT Analysis

10.7 Engrow Carbon Energy Private Limited

             10.7.1 Company Overview

10.7.2 Financial

10.7.3 Technology/ Services Offered

10.7.4 SWOT Analysis

10.8 SoilFixer

             10.8.1 Company Overview

10.8.2 Financial

10.8.3 Technology/ Services Offered

10.8.4 SWOT Analysis

10.9 SymSoil

             10.9.1 Company Overview

10.9.2 Financial

10.9.3 Technology/ Services Offered

10.9.4 SWOT Analysis

10.10 Biochar Supreme LLC

             10.10.1 Company Overview

10.10.2 Financial

10.10.3 Technology/ Services Offered

10.10.4 SWOT Analysis

11. Use Cases and Best Practices

12. Conclusion

An accurate research report requires proper strategizing as well as implementation. There are multiple factors involved in the completion of good and accurate research report and selecting the best methodology to compete the research is the toughest part. Since the research reports we provide play a crucial role in any company’s decision-making process, therefore we at SNS Insider always believe that we should choose the best method which gives us results closer to reality. This allows us to reach at a stage wherein we can provide our clients best and accurate investment to output ratio.

Each report that we prepare takes a timeframe of 350-400 business hours for production. Starting from the selection of titles through a couple of in-depth brain storming session to the final QC process before uploading our titles on our website we dedicate around 350 working hours. The titles are selected based on their current market cap and the foreseen CAGR and growth.


The 5 steps process:

Step 1: Secondary Research:

Secondary Research or Desk Research is as the name suggests is a research process wherein, we collect data through the readily available information. In this process we use various paid and unpaid databases which our team has access to and gather data through the same. This includes examining of listed companies’ annual reports, Journals, SEC filling etc. Apart from this our team has access to various associations across the globe across different industries. Lastly, we have exchange relationships with various university as well as individual libraries.

Secondary Research

Step 2: Primary Research

When we talk about primary research, it is a type of study in which the researchers collect relevant data samples directly, rather than relying on previously collected data.  This type of research is focused on gaining content specific facts that can be sued to solve specific problems. Since the collected data is fresh and first hand therefore it makes the study more accurate and genuine.

We at SNS Insider have divided Primary Research into 2 parts.

Part 1 wherein we interview the KOLs of major players as well as the upcoming ones across various geographic regions. This allows us to have their view over the market scenario and acts as an important tool to come closer to the accurate market numbers. As many as 45 paid and unpaid primary interviews are taken from both the demand and supply side of the industry to make sure we land at an accurate judgement and analysis of the market.

This step involves the triangulation of data wherein our team analyses the interview transcripts, online survey responses and observation of on filed participants. The below mentioned chart should give a better understanding of the part 1 of the primary interview.

Primary Research

Part 2: In this part of primary research the data collected via secondary research and the part 1 of the primary research is validated with the interviews from individual consultants and subject matter experts.

Consultants are those set of people who have at least 12 years of experience and expertise within the industry whereas Subject Matter Experts are those with at least 15 years of experience behind their back within the same space. The data with the help of two main processes i.e., FGDs (Focused Group Discussions) and IDs (Individual Discussions). This gives us a 3rd party nonbiased primary view of the market scenario making it a more dependable one while collation of the data pointers.

Step 3: Data Bank Validation

Once all the information is collected via primary and secondary sources, we run that information for data validation. At our intelligence centre our research heads track a lot of information related to the market which includes the quarterly reports, the daily stock prices, and other relevant information. Our data bank server gets updated every fortnight and that is how the information which we collected using our primary and secondary information is revalidated in real time.

Data Bank Validation

Step 4: QA/QC Process

After all the data collection and validation our team does a final level of quality check and quality assurance to get rid of any unwanted or undesired mistakes. This might include but not limited to getting rid of the any typos, duplication of numbers or missing of any important information. The people involved in this process include technical content writers, research heads and graphics people. Once this process is completed the title gets uploader on our platform for our clients to read it.

Step 5: Final QC/QA Process:

This is the last process and comes when the client has ordered the study. In this process a final QA/QC is done before the study is emailed to the client. Since we believe in giving our clients a good experience of our research studies, therefore, to make sure that we do not lack at our end in any way humanly possible we do a final round of quality check and then dispatch the study to the client.

Key Segments: 

By Technology

  • Pyrolysis

  • Gasification

  • Others

By Application

  • Agriculture

  • Gardening

  • Turfs

  • Others

Request for Segment Customization as per your Business Requirement: Segment Customization Request

Regional Coverage: 

North America

  • US

  • Canada

  • Mexico

Europe

  • Germany

  • France

  • UK

  • Italy

  • Spain

  • Poland

  • Turkey

  • Rest of Europe

Asia Pacific

  • China

  • India

  • Japan

  • South Korea

  • Singapore

  • Australia

  • Rest of Asia Pacific

Middle East & Africa

  • UAE

  • Saudi Arabia

  • Qatar

  • South Africa

  • Rest of Middle East & Africa

Latin America

  • Brazil

  • Argentina

  • Rest of Latin America

Request for Country Level Research Report: Country Level Customization Request

Available Customization 

With the given market data, SNS Insider offers customization as per the company’s specific needs. The following customization options are available for the report: 

  • Detailed Volume Analysis 

  • Criss-Cross segment analysis (e.g. Product X Application) 

  • Competitive Product Benchmarking 

  • Geographic Analysis 

  • Additional countries in any of the regions 

  • Customized Data Representation 

  • Detailed analysis and profiling of additional market players


  •            5000 (33% Discount)


  •            8950 (40% Discount)


  •            3050 (23% Discount)

Start a Conversation

Hi! Click one of our member below to chat on Phone