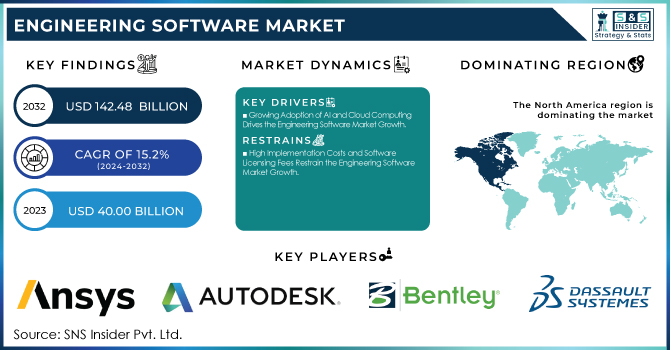
The Engineering Software Market Size was valued at USD 40.00 Billion in 2023 and is expected to reach USD 142.48 Billion by 2032 and grow at a CAGR of 15.2% over the forecast period 2024-2032. The Market is growing rapidly, driven by increased adoption in automotive, aerospace, and construction industries. AI, cloud computing, and digital twin technology advancements are transforming product design, simulation, and manufacturing. Companies are shifting to SaaS-based platforms, boosting demand for CAD, CAE, and PLM software. Rising R&D investments focus on AI-driven modeling, generative design, and real-time simulation. IoT, AR/VR, and data analytics are enhancing usability, while regulatory compliance is shaping software development. North America leads the market, but Asia-Pacific is the fastest-growing region. Major players like ANSYS, Autodesk, Siemens, and Dassault Systèmes are driving innovation, partnerships, and market expansion.
To get more information on Engineering Software Market - Request Free Sample Report
Key Drivers:
Growing Adoption of AI and Cloud Computing Drives the Engineering Software Market Growth
The increasing integration of AI, cloud computing, and digital twin technology is a key driver of the Engineering Software Market. AI-powered tools enhance design automation, real-time simulation, and predictive analysis, enabling engineers to optimize product development processes efficiently. Cloud-based engineering software provides scalability, remote collaboration, and cost-effectiveness, making it a preferred choice for businesses shifting to SaaS models. The growing adoption of Industry 4.0 and smart manufacturing is further accelerating the demand for advanced CAD, CAE, and PLM solutions. Additionally, AI-driven generative design and automation tools are transforming traditional engineering workflows, reducing time-to-market and improving innovation. Companies in sectors like automotive, aerospace, and construction are increasingly leveraging these technologies to improve efficiency and sustainability. As cloud-based platforms gain momentum, software providers are focusing on enhancing security, interoperability, and AI-powered automation features, ensuring sustained growth in the market.
Restraint:
High Implementation Costs and Software Licensing Fees Restrain the Engineering Software Market Growth
Small and medium-sized enterprises (SMEs) often struggle with the financial burden of purchasing and maintaining advanced engineering software solutions like CAD, CAE, and PLM systems. Perpetual and subscription-based licensing models demand substantial investment, especially for cloud-based solutions that involve recurring costs. Additionally, integration with existing legacy systems poses challenges, requiring businesses to invest in extensive training, customization, and IT infrastructure. The cost of upgrading software to remain compatible with evolving technologies adds to financial constraints. Companies must balance between adopting modern software and managing operational expenses. While vendors offer flexible pricing models, affordability remains a concern for businesses with budget limitations. This cost factor hinders market penetration, especially in emerging economies where cost-sensitive industries may hesitate to invest in high-end engineering solutions.
Opportunities:
Increasing Demand for Sustainable and Energy-Efficient Engineering Solutions Creates New Market Opportunities
Industries are prioritizing eco-friendly designs, lightweight materials, and energy-efficient product development, driving demand for advanced CAD and CAE software. Engineering software enables businesses to optimize resource utilization, minimize material waste, and reduce carbon footprints through simulation-driven design. The growing adoption of digital twins and AI-driven predictive analytics further enhances sustainable manufacturing processes. Government regulations promoting green technologies and carbon neutrality goals are pushing companies to integrate environmentally friendly engineering solutions. Additionally, the demand for smart infrastructure, renewable energy projects, and electric vehicles (EVs) is boosting investments in sustainable engineering software tools. Vendors are introducing AI-powered solutions that help companies achieve sustainability targets while optimizing efficiency. As industries embrace eco-friendly engineering practices, software providers focusing on sustainability-driven innovations can capitalize on this emerging market trend.
Challenges:
Cybersecurity Threats and Data Privacy Concerns Pose Challenges in the Engineering Software Market
The increasing reliance on cloud-based engineering software has raised concerns over cybersecurity threats, data privacy, and intellectual property protection. As companies store sensitive product designs, simulations, and proprietary data in cloud environments, the risk of cyberattacks, data breaches, and hacking attempts is growing. Industries such as aerospace, defense, and medical devices handle confidential engineering data, making them prime targets for cyber threats. Unauthorized access, software vulnerabilities, and lack of robust encryption mechanisms further amplify security risks. Regulatory compliance with data protection laws such as GDPR and industry-specific cybersecurity standards adds complexity for businesses adopting cloud-based solutions. Additionally, concerns over data sovereignty and third-party cloud service providers hinder cloud adoption in certain industries. To overcome these challenges, engineering software vendors must invest in advanced cybersecurity solutions, end-to-end encryption, multi-factor authentication, and secure cloud frameworks to ensure data integrity and user trust.
By End-Use
The Automotive segment dominated the Engineering Software Market in 2023, holding a 27% revenue share due to the growing demand for automated design, simulation, and manufacturing solutions. The adoption of Computer-Aided Design (CAD), Computer-Aided Engineering (CAE), and Product Lifecycle Management (PLM) software has surged as automakers focus on developing electric vehicles (EVs), autonomous driving technology, and lightweight materials.
In 2023, ANSYS launched an advanced simulation suite for autonomous vehicle safety testing, while PTC expanded its Windchill PLM platform to enhance supply chain collaboration in the automotive sector.
The Aerospace & Defense segment is set to experience the highest CAGR of 17.81% during the forecast period, driven by increasing defense budgets, next-generation aircraft development, and stringent regulatory requirements. The sector is heavily reliant on advanced engineering software for structural analysis, aerodynamics simulation, and digital manufacturing.
In 2023, Hexagon AB introduced an AI-powered CAE software suite for aerospace design optimization, while Dassault Systèmes enhanced its 3DEXPERIENCE platform to improve collaborative design and virtual testing for defense applications.
By Application
The Product Design & Testing segment dominated the Engineering Software Market in 2023, accounting for 33% of total revenue. Industries such as automotive, aerospace, electronics, and medical devices are heavily investing in CAD, CAE, and PLM software to optimize product innovation, reduce prototyping costs, and enhance testing efficiency. Siemens Digital Industries Software launched the NX X software in 2023, offering cloud-based collaborative product design and real-time testing simulations.
The Drafting & 3D Modeling segment is set to grow at a CAGR of 16.11% over the forecast period, driven by rising demand for digital design visualization, architectural modeling, and real-time rendering across multiple industries. The adoption of advanced 3D modeling tools in construction, automotive, and industrial design has surged due to the need for precision, automation, and faster project execution. In 2023, Autodesk introduced AutoCAD 2024 with AI-powered automation and cloud-based collaboration features, improving workflow efficiency for architects and engineers. Hexagon AB launched a new 3D modeling solution that integrates AI-driven automation and virtual reality (VR) capabilities for enhanced design accuracy.
By Component
The Software segment dominated the Engineering Software Market in 2023, accounting for 72% of total revenue, driven by increasing demand for CAD, CAE, CAM, and PLM solutions across industries like automotive, aerospace, construction, and healthcare. The shift toward AI-driven automation, cloud-based platforms, and digital twin technology has accelerated software adoption, enabling companies to enhance product design, real-time simulation, and manufacturing efficiency.
PTC upgraded its Creo software with integrated augmented reality (AR) and IoT capabilities, improving collaboration in smart manufacturing. As businesses digitize their engineering processes to reduce costs and enhance innovation, the software segment continues to dominate the market, driving investments in cloud, AI, and real-time simulation solutions for next-gen product development.
The Service segment is expected to grow at a CAGR of 16.18%, fueled by increasing demand for software implementation, customization, training, and support services. As industries adopt complex engineering software solutions, the need for consulting, system integration, and cloud migration services has risen significantly.
Additionally, ANSYS introduced a remote simulation support service, enabling engineers to run real-time computational fluid dynamics (CFD) and finite element analysis (FEA) simulations in the cloud. As businesses prioritize scalability, cybersecurity, and regulatory compliance, demand for managed services, SaaS integration, and AI-driven engineering support continue to surge.
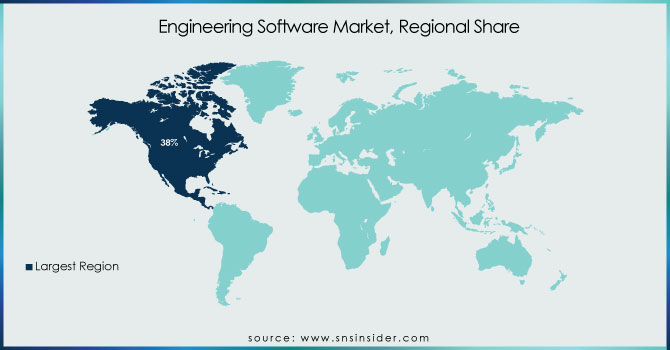
North America led the Engineering Software Market in 2023, accounting for an estimated 38% market share, driven by technological advancements, strong industrial infrastructure, and high adoption of AI-driven engineering tools. The presence of leading software providers such as Autodesk, PTC, ANSYS, and Dassault Systèmes has contributed to the region’s dominance. The automotive, aerospace, and construction industries in the U.S. and Canada are rapidly adopting CAD, CAE, and PLM software for product development and digital transformation.
For example, Tesla uses Siemens NX and ANSYS simulation software to optimize electric vehicle (EV) design and safety. Additionally, Boeing integrates Dassault Systèmes’ 3DEXPERIENCE platform for aircraft manufacturing and lifecycle management.
The Asia Pacific region is projected to grow at the highest CAGR of 17.5%, driven by rapid industrialization, government initiatives for digital transformation, and increasing adoption of cloud-based engineering software. Countries like China, India, Japan, and South Korea are experiencing a surge in demand for CAD, CAE, and CAM solutions across sectors such as automotive, electronics, and construction.
For instance, Huawei has invested heavily in AI-driven engineering design software, while BYD, a leading EV manufacturer, integrates PTC’s Creo and Siemens’ Teamcenter for product lifecycle management.
In Japan, Toyota and Honda are leveraging Autodesk’s generative design tools for lightweight vehicle engineering. With expanding cloud adoption, rising R&D investments, and strong government support, Asia Pacific is set to lead the future growth of the Engineering Software Market.
Get Customized Report as per Your Business Requirement - Enquiry Now
Some of the major players in the Engineering Software Market are:
ANSYS, Inc (ANSYS Mechanical, ANSYS Fluent)
Autodesk Inc. (AutoCAD, Fusion 360)
Bentley Systems, Incorporated (MicroStation, OpenRoads Designer)
Dassault Systèmes (CATIA, SOLIDWORKS)
ESI Group (VA One, ProCAST)
Siemens (NX, Solid Edge)
3D Systems Inc. (Geomagic Design X, 3DXpert)
PTC (Creo, Windchill)
Mastercam (Mastercam Mill, Mastercam Lathe)
Hexagon AB (MSC Nastran, Simufact)
ZWSOFT CO., LTD. (ZWCAD, ZW3D)
SAP SE (SAP ECTR, SAP PLM)
Aras (Aras Innovator, Aras Simulation Management)
Centric Software, Inc. (Centric PLM, Centric Visual Innovation Platform)
Oracle Corporation (Oracle Agile PLM, Oracle AutoVue)
ComplianceQuest (CQ EQMS, CQ PLM)
In November 2024, Ansys Inc. reported its third-quarter financial results, revealing a revenue of USD 601.9 million, a 31% increase compared to the same period in 2023. The company's GAAP diluted earnings per share stood at USD 1.46, up from USD 0.64 in the previous year. Net income reached USD 128.2 million, marking a 131% year-over-year growth. The gross margin improved to 88.5%, with operating cash flows of USD 174.2 million. Deferred revenue and backlog were reported at USD 1,463.8 million, indicating a strong outlook for future revenue.
In November 2024, Autodesk's stock price reached a 52-week high of USD 315.87, reflecting robust growth and strong market momentum. Over the past six months leading up to November 2024, the company's stock demonstrated a 27.76% return, underscoring its positive performance in the engineering software market.
| Report Attributes | Details |
|---|---|
| Market Size in 2023 | USD 40.0 Billion |
| Market Size by 2032 | USD 142.48 Billion |
| CAGR | CAGR of 15.2% From 2024 to 2032 |
| Base Year | 2023 |
| Forecast Period | 2024-2032 |
| Historical Data | 2020-2022 |
| Report Scope & Coverage | Market Size, Segments Analysis, Competitive Landscape, Regional Analysis, DROC & SWOT Analysis, Forecast Outlook |
| Key Segments | • By Component (Software [Computer-Aided Design (CAD) Software, Computer-Aided Manufacturing (CAM) Software, Computer-Aided Engineering (CAE) Software, Others], Services [Development Service, Training, Support & Maintenance]) • By Deployment (Cloud, On-Premises) • By Application (Design Automation, Product Design & Testing, Plant Design, Drafting & 3D Modelling, Others) • By End-Use (Automotive, Aerospace & Defense, Electronics, Medical Devices, Architecture, Engineering and Construction (AEC), Others) |
| Regional Analysis/Coverage | North America (US, Canada, Mexico), Europe (Eastern Europe [Poland, Romania, Hungary, Turkey, Rest of Eastern Europe] Western Europe] Germany, France, UK, Italy, Spain, Netherlands, Switzerland, Austria, Rest of Western Europe]), Asia Pacific (China, India, Japan, South Korea, Vietnam, Singapore, Australia, Rest of Asia Pacific), Middle East & Africa (Middle East [UAE, Egypt, Saudi Arabia, Qatar, Rest of Middle East], Africa [Nigeria, South Africa, Rest of Africa], Latin America (Brazil, Argentina, Colombia, Rest of Latin America) |
| Company Profiles | ANSYS, Inc., Autodesk Inc., Bentley Systems, Incorporated, Dassault Systèmes, ESI Group, Siemens, 3D Systems Inc., PTC, Mastercam, Hexagon AB, ZWSOFT CO., LTD., SAP SE, Aras, Centric Software, Inc., Oracle Corporation, ComplianceQuest. |
Ans: The Engineering Software Market is expected to grow at a CAGR of 15.2% during 2024-2032.
Ans: The Engineering Software Market size was USD 40.00 billion in 2023 and is expected to Reach USD 142.48 billion by 2032.
Ans: The major growth factor of the Engineering Software Market is the increasing adoption of AI-driven automation, cloud-based solutions, and digital twin technology across industries.
Ans: The Product Design & Testing segment dominated the Engineering Software Market.
Ans: North America dominated the Engineering Software Market in 2023.
Table Of Content
1. Introduction
1.1 Market Definition
1.2 Scope (Inclusion and Exclusions)
1.3 Research Assumptions
2. Executive Summary
2.1 Market Overview
2.2 Regional Synopsis
2.3 Competitive Summary
3. Research Methodology
3.1 Top-Down Approach
3.2 Bottom-up Approach
3.3. Data Validation
3.4 Primary Interviews
4. Market Dynamics Impact Analysis
4.1 Market Driving Factors Analysis
4.1.1 Drivers
4.1.2 Restraints
4.1.3 Opportunities
4.1.4 Challenges
4.2 PESTLE Analysis
4.3 Porter’s Five Forces Model
5. Statistical Insights and Trends Reporting
5.1 R&D Investment Trends, 2023
5.2 Growth in Subscription-Based Licensing, 2023
5.3 Regulatory Compliance Impact, 2023
5.4 Services Revenue Contribution
6. Competitive Landscape
6.1 List of Major Companies, By Region
6.2 Market Share Analysis, By Region
6.3 Product Benchmarking
6.3.1 Product specifications and features
6.3.2 Pricing
6.4 Strategic Initiatives
6.4.1 Marketing and promotional activities
6.4.2 Distribution and Supply Chain Strategies
6.4.3 Expansion plans and new product launches
6.4.4 Strategic partnerships and collaborations
6.5 Technological Advancements
6.6 Market Positioning and Branding
7. Engineering Software Market Segmentation, By Application
7.1 Chapter Overview
7.2 Design Automation
7.2.1 Design Automation Market Trends Analysis (2020-2032)
7.2.2 Design Automation Market Size Estimates and Forecasts to 2032 (USD Billion)
7.3 Product Design & Testing
7.3.1 Product Design & Testing Market Trends Analysis (2020-2032)
7.3.2 Product Design & Testing Market Size Estimates and Forecasts to 2032 (USD Billion)
7.4 Plant Design
7.4.1 Plant Design Market Trends Analysis (2020-2032)
7.4.2 Plant Design Market Size Estimates and Forecasts to 2032 (USD Billion)
7.5 Drafting & 3D Modelling
7.5.1 Drafting & 3D Modelling Market Trends Analysis (2020-2032)
7.5.2 Drafting & 3D Modelling Market Size Estimates and Forecasts to 2032 (USD Billion)
7.6 Others
7.6.1 Others Market Trends Analysis (2020-2032)
7.6.2 Others Market Size Estimates and Forecasts to 2032 (USD Billion)
8. Engineering Software Market Segmentation, By Component
8.1 Chapter Overview
8.2 Software
8.2.1 Software Market Trends Analysis (2020-2032)
8.2.2 Software Market Size Estimates and Forecasts to 2032 (USD Billion)
8.2.3 Computer-Aided Design (CAD) Software
8.2.3.1 Computer-Aided Design (CAD) Software Market Trends Analysis (2020-2032)
8.2.3.2 Computer-Aided Design (CAD) Software Market Size Estimates and Forecasts to 2032 (USD Billion)
8.2.4 Computer-Aided Manufacturing (CAM) Software
8.2.4.1 Computer-Aided Manufacturing (CAM) Software Market Trends Analysis (2020-2032)
8.2.4.2 Computer-Aided Manufacturing (CAM) Software Market Size Estimates and Forecasts to 2032 (USD Billion)
8.2.5 Computer-Aided Engineering (CAE) Software
8.2.5.1 Computer-Aided Engineering (CAE) Software Market Trends Analysis (2020-2032)
8.2.5.2 Computer-Aided Engineering (CAE) Software Market Size Estimates and Forecasts to 2032 (USD Billion)
8.2.6 Others
8.2.6.1 Others Market Trends Analysis (2020-2032)
8.2.6.2 Others Market Size Estimates and Forecasts to 2032 (USD Billion)
8.3 Services
8.3.1 Services Market Trends Analysis (2020-2032)
8.3.2 Services Market Size Estimates and Forecasts to 2032 (USD Billion)
8.3.3 Development Service
8.3.3.1 Development Service Market Trends Analysis (2020-2032)
8.3.3.2 Development Service Market Size Estimates and Forecasts to 2032 (USD Billion)
8.3.4 Training, Support & Maintenance
8.3.4.1 Training, Support & Maintenance Market Trends Analysis (2020-2032)
8.3.4.2 Training, Support & Maintenance Market Size Estimates and Forecasts to 2032 (USD Billion)
9. Engineering Software Market Segmentation, By Deployment
9.1 Chapter Overview
9.2 Cloud Based
9.2.1 Cloud-Based Market Trends Analysis (2020-2032)
9.2.2 Cloud-Based Market Size Estimates and Forecasts to 2032 (USD Billion)
9.3 On-premise
9.3.1 On-premise Market Trends Analysis (2020-2032)
9.3.2 On-premise Market Size Estimates and Forecasts to 2032 (USD Billion)
10. Engineering Software Market Segmentation, By End-Use
10.1 Chapter Overview
10.2 Automotive
10.2.1 Automotive Market Trends Analysis (2020-2032)
10.2.2 Automotive Market Size Estimates and Forecasts to 2032 (USD Billion)
10.3 Aerospace & Defense
10.3.1 Aerospace & Defense Market Trends Analysis (2020-2032)
10.3.2 Aerospace & Defense Market Size Estimates and Forecasts to 2032 (USD Billion)
10.4 Electronics
10.4.1 Electronics Market Trends Analysis (2020-2032)
10.4.2 Electronics Market Size Estimates and Forecasts to 2032 (USD Billion)
10.5 Medical Devices
10.5.1 Medical Devices Market Trends Analysis (2020-2032)
10.5.2 Medical Devices Market Size Estimates and Forecasts to 2032 (USD Billion)
10.6 Architecture, Engineering and Construction (AEC)
10.6.1 Architecture, Engineering and Construction (AEC) Market Trends Analysis (2020-2032)
10.6.2 Architecture, Engineering and Construction (AEC) Market Size Estimates and Forecasts to 2032 (USD Billion)
10.7 Others
10.7.1 Others Market Trends Analysis (2020-2032)
10.7.2 Others Market Size Estimates and Forecasts to 2032 (USD Billion)
11. Regional Analysis
11.1 Chapter Overview
11.2 North America
11.2.1 Trends Analysis
11.2.2 North America Engineering Software Market Estimates and Forecasts, by Country (2020-2032) (USD Billion)
11.2.3 North America Engineering Software Market Estimates and Forecasts, By Application (2020-2032) (USD Billion)
11.2.4 North America Engineering Software Market Estimates and Forecasts, By Component (2020-2032) (USD Billion)
11.2.5 North America Engineering Software Market Estimates and Forecasts, By Deployment (2020-2032) (USD Billion)
11.2.6 North America Engineering Software Market Estimates and Forecasts, By End-Use(2020-2032) (USD Billion)
11.2.7 USA
11.2.7.1 USA Engineering Software Market Estimates and Forecasts, By Application (2020-2032) (USD Billion)
11.2.7.2 USA Engineering Software Market Estimates and Forecasts, By Component (2020-2032) (USD Billion)
11.2.7.3 USA Engineering Software Market Estimates and Forecasts, By Deployment (2020-2032) (USD Billion)
11.2.7.4 USA Engineering Software Market Estimates and Forecasts, By End-Use(2020-2032) (USD Billion)
11.2.8 Canada
11.2.8.1 Canada Engineering Software Market Estimates and Forecasts, By Application (2020-2032) (USD Billion)
11.2.8.2 Canada Engineering Software Market Estimates and Forecasts, By Component (2020-2032) (USD Billion)
11.2.8.3 Canada Engineering Software Market Estimates and Forecasts, By Deployment (2020-2032) (USD Billion)
11.2.8.4 Canada Engineering Software Market Estimates and Forecasts, By End-Use (2020-2032) (USD Billion)
11.2.9 Mexico
11.2.9.1 Mexico Engineering Software Market Estimates and Forecasts, By Application (2020-2032) (USD Billion)
11.2.9.2 Mexico Engineering Software Market Estimates and Forecasts, By Component (2020-2032) (USD Billion)
11.2.9.3 Mexico Engineering Software Market Estimates and Forecasts, By Deployment (2020-2032) (USD Billion)
11.2.9.4 Mexico Engineering Software Market Estimates and Forecasts, By End-Use (2020-2032) (USD Billion)
11.3 Europe
11.3.1 Eastern Europe
11.3.1.1 Trends Analysis
11.3.1.2 Eastern Europe Engineering Software Market Estimates and Forecasts, by Country (2020-2032) (USD Billion)
11.3.1.3 Eastern Europe Engineering Software Market Estimates and Forecasts, By Application (2020-2032) (USD Billion)
11.3.1.4 Eastern Europe Engineering Software Market Estimates and Forecasts, By Component (2020-2032) (USD Billion)
11.3.1.5 Eastern Europe Engineering Software Market Estimates and Forecasts, By Deployment (2020-2032) (USD Billion)
11.3.1.6 Eastern Europe Engineering Software Market Estimates and Forecasts, By End-Use(2020-2032) (USD Billion)
11.3.1.7 Poland
11.3.1.7.1 Poland Engineering Software Market Estimates and Forecasts, By Application (2020-2032) (USD Billion)
11.3.1.7.2 Poland Engineering Software Market Estimates and Forecasts, By Component (2020-2032) (USD Billion)
11.3.1.7.3 Poland Engineering Software Market Estimates and Forecasts, By Deployment (2020-2032) (USD Billion)
11.3.1.7.4 Poland Engineering Software Market Estimates and Forecasts, By End-Use(2020-2032) (USD Billion)
11.3.1.8 Romania
11.3.1.8.1 Romania Engineering Software Market Estimates and Forecasts, By Application (2020-2032) (USD Billion)
11.3.1.8.2 Romania Engineering Software Market Estimates and Forecasts, By Component (2020-2032) (USD Billion)
11.3.1.8.3 Romania Engineering Software Market Estimates and Forecasts, By Deployment (2020-2032) (USD Billion)
11.3.1.8.4 Romania Engineering Software Market Estimates and Forecasts, By End-Use (2020-2032) (USD Billion)
11.3.1.9 Hungary
11.3.1.9.1 Hungary Engineering Software Market Estimates and Forecasts, By Application (2020-2032) (USD Billion)
11.3.1.9.2 Hungary Engineering Software Market Estimates and Forecasts, By Component (2020-2032) (USD Billion)
11.3.1.9.3 Hungary Engineering Software Market Estimates and Forecasts, By Deployment (2020-2032) (USD Billion)
11.3.1.9.4 Hungary Engineering Software Market Estimates and Forecasts, By End-Use (2020-2032) (USD Billion)
11.3.1.10 Turkey
11.3.1.10.1 Turkey Engineering Software Market Estimates and Forecasts, By Application (2020-2032) (USD Billion)
11.3.1.10.2 Turkey Engineering Software Market Estimates and Forecasts, By Component (2020-2032) (USD Billion)
11.3.1.10.3 Turkey Engineering Software Market Estimates and Forecasts, By Deployment (2020-2032) (USD Billion)
11.3.1.10.4 Turkey Engineering Software Market Estimates and Forecasts, By End-Use (2020-2032) (USD Billion)
11.3.1.11 Rest of Eastern Europe
11.3.1.11.1 Rest of Eastern Europe Engineering Software Market Estimates and Forecasts, By Application (2020-2032) (USD Billion)
11.3.1.11.2 Rest of Eastern Europe Engineering Software Market Estimates and Forecasts, By Component (2020-2032) (USD Billion)
11.3.1.11.3 Rest of Eastern Europe Engineering Software Market Estimates and Forecasts, By Deployment (2020-2032) (USD Billion)
11.3.1.11.4 Rest of Eastern Europe Engineering Software Market Estimates and Forecasts, By End-Use (2020-2032) (USD Billion)
11.3.2 Western Europe
11.3.2.1 Trends Analysis
11.3.2.2 Western Europe Engineering Software Market Estimates and Forecasts, by Country (2020-2032) (USD Billion)
11.3.2.3 Western Europe Engineering Software Market Estimates and Forecasts, By Application (2020-2032) (USD Billion)
11.3.2.4 Western Europe Engineering Software Market Estimates and Forecasts, By Component (2020-2032) (USD Billion)
11.3.2.5 Western Europe Engineering Software Market Estimates and Forecasts, By Deployment (2020-2032) (USD Billion)
11.3.2.6 Western Europe Engineering Software Market Estimates and Forecasts, By End-Use (2020-2032) (USD Billion)
11.3.2.7 Germany
11.3.2.7.1 Germany Engineering Software Market Estimates and Forecasts, By Application (2020-2032) (USD Billion)
11.3.2.7.2 Germany Engineering Software Market Estimates and Forecasts, By Component (2020-2032) (USD Billion)
11.3.2.7.3 Germany Engineering Software Market Estimates and Forecasts, By Deployment (2020-2032) (USD Billion)
11.3.2.7.4 Germany Engineering Software Market Estimates and Forecasts, By End-Use (2020-2032) (USD Billion)
11.3.2.8 France
11.3.2.8.1 France Engineering Software Market Estimates and Forecasts, By Application (2020-2032) (USD Billion)
11.3.2.8.2 France Engineering Software Market Estimates and Forecasts, By Component (2020-2032) (USD Billion)
11.3.2.8.3 France Engineering Software Market Estimates and Forecasts, By Deployment (2020-2032) (USD Billion)
11.3.2.8.4 France Engineering Software Market Estimates and Forecasts, By End-Use (2020-2032) (USD Billion)
11.3.2.9 UK
11.3.2.9.1 UK Engineering Software Market Estimates and Forecasts, By Application (2020-2032) (USD Billion)
11.3.2.9.2 UK Engineering Software Market Estimates and Forecasts, By Component (2020-2032) (USD Billion)
11.3.2.9.3 UK Engineering Software Market Estimates and Forecasts, By Deployment (2020-2032) (USD Billion)
11.3.2.9.4 UK Engineering Software Market Estimates and Forecasts, By End-Use (2020-2032) (USD Billion)
11.3.2.10 Italy
11.3.2.10.1 Italy Engineering Software Market Estimates and Forecasts, By Application (2020-2032) (USD Billion)
11.3.2.10.2 Italy Engineering Software Market Estimates and Forecasts, By Component (2020-2032) (USD Billion)
11.3.2.10.3 Italy Engineering Software Market Estimates and Forecasts, By Deployment (2020-2032) (USD Billion)
11.3.2.10.4 Italy Engineering Software Market Estimates and Forecasts, By End-Use (2020-2032) (USD Billion)
11.3.2.11 Spain
11.3.2.11.1 Spain Engineering Software Market Estimates and Forecasts, By Application (2020-2032) (USD Billion)
11.3.2.11.2 Spain Engineering Software Market Estimates and Forecasts, By Component (2020-2032) (USD Billion)
11.3.2.11.3 Spain Engineering Software Market Estimates and Forecasts, By Deployment (2020-2032) (USD Billion)
11.3.2.11.4 Spain Engineering Software Market Estimates and Forecasts, By End-Use (2020-2032) (USD Billion)
11.3.2.12 Netherlands
11.3.2.12.1 Netherlands Engineering Software Market Estimates and Forecasts, By Application (2020-2032) (USD Billion)
11.3.2.12.2 Netherlands Engineering Software Market Estimates and Forecasts, By Component (2020-2032) (USD Billion)
11.3.2.12.3 Netherlands Engineering Software Market Estimates and Forecasts, By Deployment (2020-2032) (USD Billion)
11.3.2.12.4 Netherlands Engineering Software Market Estimates and Forecasts, By End-Use (2020-2032) (USD Billion)
11.3.2.13 Switzerland
11.3.2.13.1 Switzerland Engineering Software Market Estimates and Forecasts, By Application (2020-2032) (USD Billion)
11.3.2.13.2 Switzerland Engineering Software Market Estimates and Forecasts, By Component (2020-2032) (USD Billion)
11.3.2.13.3 Switzerland Engineering Software Market Estimates and Forecasts, By Deployment (2020-2032) (USD Billion)
11.3.2.13.4 Switzerland Engineering Software Market Estimates and Forecasts, By End-Use (2020-2032) (USD Billion)
11.3.2.14 Austria
11.3.2.14.1 Austria Engineering Software Market Estimates and Forecasts, By Application (2020-2032) (USD Billion)
11.3.2.14.2 Austria Engineering Software Market Estimates and Forecasts, By Component (2020-2032) (USD Billion)
11.3.2.14.3 Austria Engineering Software Market Estimates and Forecasts, By Deployment (2020-2032) (USD Billion)
11.3.2.14.4 Austria Engineering Software Market Estimates and Forecasts, By End-Use (2020-2032) (USD Billion)
11.3.2.15 Rest of Western Europe
11.3.2.15.1 Rest of Western Europe Engineering Software Market Estimates and Forecasts, By Application (2020-2032) (USD Billion)
11.3.2.15.2 Rest of Western Europe Engineering Software Market Estimates and Forecasts, By Component (2020-2032) (USD Billion)
11.3.2.15.3 Rest of Western Europe Engineering Software Market Estimates and Forecasts, By Deployment (2020-2032) (USD Billion)
11.3.2.15.4 Rest of Western Europe Engineering Software Market Estimates and Forecasts, By End-Use (2020-2032) (USD Billion)
11.4 Asia Pacific
11.4.1 Trends Analysis
11.4.2 Asia Pacific Engineering Software Market Estimates and Forecasts, by Country (2020-2032) (USD Billion)
11.4.3 Asia Pacific Engineering Software Market Estimates and Forecasts, By Application (2020-2032) (USD Billion)
11.4.4 Asia Pacific Engineering Software Market Estimates and Forecasts, By Component (2020-2032) (USD Billion)
11.4.5 Asia Pacific Engineering Software Market Estimates and Forecasts, By Deployment (2020-2032) (USD Billion)
11.4.6 Asia Pacific Engineering Software Market Estimates and Forecasts, By End-Use (2020-2032) (USD Billion)
11.4.7 China
11.4.7.1 China Engineering Software Market Estimates and Forecasts, By Application (2020-2032) (USD Billion)
11.4.7.2 China Engineering Software Market Estimates and Forecasts, By Component (2020-2032) (USD Billion)
11.4.7.3 China Engineering Software Market Estimates and Forecasts, By Deployment (2020-2032) (USD Billion)
11.4.7.4 China Engineering Software Market Estimates and Forecasts, By End-Use (2020-2032) (USD Billion)
11.4.8 India
11.4.8.1 India Engineering Software Market Estimates and Forecasts, By Application (2020-2032) (USD Billion)
11.4.8.2 India Engineering Software Market Estimates and Forecasts, By Component (2020-2032) (USD Billion)
11.4.8.3 India Engineering Software Market Estimates and Forecasts, By Deployment (2020-2032) (USD Billion)
11.4.8.4 India Engineering Software Market Estimates and Forecasts, By End-Use (2020-2032) (USD Billion)
11.4.9 Japan
11.4.9.1 Japan Engineering Software Market Estimates and Forecasts, By Application (2020-2032) (USD Billion)
11.4.9.2 Japan Engineering Software Market Estimates and Forecasts, By Component (2020-2032) (USD Billion)
11.4.9.3 Japan Engineering Software Market Estimates and Forecasts, By Deployment (2020-2032) (USD Billion)
11.4.9.4 Japan Engineering Software Market Estimates and Forecasts, By End-Use (2020-2032) (USD Billion)
11.4.10 South Korea
11.4.10.1 South Korea Engineering Software Market Estimates and Forecasts, By Application (2020-2032) (USD Billion)
11.4.10.2 South Korea Engineering Software Market Estimates and Forecasts, By Component (2020-2032) (USD Billion)
11.4.10.3 South Korea Engineering Software Market Estimates and Forecasts, By Deployment (2020-2032) (USD Billion)
11.4.10.4 South Korea Engineering Software Market Estimates and Forecasts, By End-Use (2020-2032) (USD Billion)
11.4.11 Vietnam
11.4.11.1 Vietnam Engineering Software Market Estimates and Forecasts, By Application (2020-2032) (USD Billion)
11.4.11.2 Vietnam Engineering Software Market Estimates and Forecasts, By Component (2020-2032) (USD Billion)
11.4.11.3 Vietnam Engineering Software Market Estimates and Forecasts, By Deployment (2020-2032) (USD Billion)
11.4.11.4 Vietnam Engineering Software Market Estimates and Forecasts, By End-Use (2020-2032) (USD Billion)
11.4.12 Singapore
11.4.12.1 Singapore Engineering Software Market Estimates and Forecasts, By Application (2020-2032) (USD Billion)
11.4.12.2 Singapore Engineering Software Market Estimates and Forecasts, By Component (2020-2032) (USD Billion)
11.4.12.3 Singapore Engineering Software Market Estimates and Forecasts, By Deployment (2020-2032) (USD Billion)
11.4.12.4 Singapore Engineering Software Market Estimates and Forecasts, By End-Use (2020-2032) (USD Billion)
11.4.13 Australia
11.4.13.1 Australia Engineering Software Market Estimates and Forecasts, By Application (2020-2032) (USD Billion)
11.4.13.2 Australia Engineering Software Market Estimates and Forecasts, By Component (2020-2032) (USD Billion)
11.4.13.3 Australia Engineering Software Market Estimates and Forecasts, By Deployment (2020-2032) (USD Billion)
11.4.13.4 Australia Engineering Software Market Estimates and Forecasts, By End-Use (2020-2032) (USD Billion)
11.4.14 Rest of Asia Pacific
11.4.14.1 Rest of Asia Pacific Engineering Software Market Estimates and Forecasts, By Application (2020-2032) (USD Billion)
11.4.14.2 Rest of Asia Pacific Engineering Software Market Estimates and Forecasts, By Component (2020-2032) (USD Billion)
11.4.14.3 Rest of Asia Pacific Engineering Software Market Estimates and Forecasts, By Deployment (2020-2032) (USD Billion)
11.4.14.4 Rest of Asia Pacific Engineering Software Market Estimates and Forecasts, By End-Use (2020-2032) (USD Billion)
11.5 Middle East and Africa
11.5.1 Middle East
11.5.1.1 Trends Analysis
11.5.1.2 Middle East Engineering Software Market Estimates and Forecasts, by Country (2020-2032) (USD Billion)
11.5.1.3 Middle East Engineering Software Market Estimates and Forecasts, By Application (2020-2032) (USD Billion)
11.5.1.4 Middle East Engineering Software Market Estimates and Forecasts, By Component (2020-2032) (USD Billion)
11.5.1.5 Middle East Engineering Software Market Estimates and Forecasts, By Deployment (2020-2032) (USD Billion)
11.5.1.6 Middle East Engineering Software Market Estimates and Forecasts, By End-Use (2020-2032) (USD Billion)
11.5.1.7 UAE
11.5.1.7.1 UAE Engineering Software Market Estimates and Forecasts, By Application (2020-2032) (USD Billion)
11.5.1.7.2 UAE Engineering Software Market Estimates and Forecasts, By Component (2020-2032) (USD Billion)
11.5.1.7.3 UAE Engineering Software Market Estimates and Forecasts, By Deployment (2020-2032) (USD Billion)
11.5.1.7.4 UAE Engineering Software Market Estimates and Forecasts, By End-Use (2020-2032) (USD Billion)
11.5.1.8 Egypt
11.5.1.8.1 Egypt Engineering Software Market Estimates and Forecasts, By Application (2020-2032) (USD Billion)
11.5.1.8.2 Egypt Engineering Software Market Estimates and Forecasts, By Component (2020-2032) (USD Billion)
11.5.1.8.3 Egypt Engineering Software Market Estimates and Forecasts, By Deployment (2020-2032) (USD Billion)
11.5.1.8.4 Egypt Engineering Software Market Estimates and Forecasts, By End-Use (2020-2032) (USD Billion)
11.5.1.9 Saudi Arabia
11.5.1.9.1 Saudi Arabia Engineering Software Market Estimates and Forecasts, By Application (2020-2032) (USD Billion)
11.5.1.9.2 Saudi Arabia Engineering Software Market Estimates and Forecasts, By Component (2020-2032) (USD Billion)
11.5.1.9.3 Saudi Arabia Engineering Software Market Estimates and Forecasts, By Deployment (2020-2032) (USD Billion)
11.5.1.9.4 Saudi Arabia Engineering Software Market Estimates and Forecasts, By End-Use (2020-2032) (USD Billion)
11.5.1.10 Qatar
11.5.1.10.1 Qatar Engineering Software Market Estimates and Forecasts, By Application (2020-2032) (USD Billion)
11.5.1.10.2 Qatar Engineering Software Market Estimates and Forecasts, By Component (2020-2032) (USD Billion)
11.5.1.10.3 Qatar Engineering Software Market Estimates and Forecasts, By Deployment (2020-2032) (USD Billion)
11.5.1.10.4 Qatar Engineering Software Market Estimates and Forecasts, By End-Use (2020-2032) (USD Billion)
11.5.1.11 Rest of Middle East
11.5.1.11.1 Rest of Middle East Engineering Software Market Estimates and Forecasts, By Application (2020-2032) (USD Billion)
11.5.1.11.2 Rest of Middle East Engineering Software Market Estimates and Forecasts, By Component (2020-2032) (USD Billion)
11.5.1.11.3 Rest of Middle East Engineering Software Market Estimates and Forecasts, By Deployment (2020-2032) (USD Billion)
11.5.1.11.4 Rest of Middle East Engineering Software Market Estimates and Forecasts, By End-Use (2020-2032) (USD Billion)
11.5.2 Africa
11.5.2.1 Trends Analysis
11.5.2.2 Africa Engineering Software Market Estimates and Forecasts, by Country (2020-2032) (USD Billion)
11.5.2.3 Africa Engineering Software Market Estimates and Forecasts, By Application (2020-2032) (USD Billion)
11.5.2.4 Africa Engineering Software Market Estimates and Forecasts, By Component (2020-2032) (USD Billion)
11.5.2.5 Africa Engineering Software Market Estimates and Forecasts, By Deployment (2020-2032) (USD Billion)
11.5.2.6 Africa Engineering Software Market Estimates and Forecasts, By End-Use (2020-2032) (USD Billion)
11.5.2.7 South Africa
11.5.2.7.1 South Africa Engineering Software Market Estimates and Forecasts, By Application (2020-2032) (USD Billion)
11.5.2.7.2 South Africa Engineering Software Market Estimates and Forecasts, By Component (2020-2032) (USD Billion)
11.5.2.7.3 South Africa Engineering Software Market Estimates and Forecasts, By Deployment (2020-2032) (USD Billion)
11.5.2.7.4 South Africa Engineering Software Market Estimates and Forecasts, By End-Use (2020-2032) (USD Billion)
11.5.2.8 Nigeria
11.5.2.8.1 Nigeria Engineering Software Market Estimates and Forecasts, By Application (2020-2032) (USD Billion)
11.5.2.8.2 Nigeria Engineering Software Market Estimates and Forecasts, By Component (2020-2032) (USD Billion)
11.5.2.8.3 Nigeria Engineering Software Market Estimates and Forecasts, By Deployment (2020-2032) (USD Billion)
11.5.2.8.4 Nigeria Engineering Software Market Estimates and Forecasts, By End-Use (2020-2032) (USD Billion)
11.5.2.9 Rest of Africa
11.5.2.9.1 Rest of Africa Engineering Software Market Estimates and Forecasts, By Application (2020-2032) (USD Billion)
11.5.2.9.2 Rest of Africa Engineering Software Market Estimates and Forecasts, By Component (2020-2032) (USD Billion)
11.5.2.9.3 Rest of Africa Engineering Software Market Estimates and Forecasts, By Deployment (2020-2032) (USD Billion)
11.5.2.9.4 Rest of Africa Engineering Software Market Estimates and Forecasts, By End-Use (2020-2032) (USD Billion)
11.6 Latin America
11.6.1 Trends Analysis
11.6.2 Latin America Engineering Software Market Estimates and Forecasts, by Country (2020-2032) (USD Billion)
11.6.3 Latin America Engineering Software Market Estimates and Forecasts, By Application (2020-2032) (USD Billion)
11.6.4 Latin America Engineering Software Market Estimates and Forecasts, By Component (2020-2032) (USD Billion)
11.6.5 Latin America Engineering Software Market Estimates and Forecasts, By Deployment (2020-2032) (USD Billion)
11.6.6 Latin America Engineering Software Market Estimates and Forecasts, By End-Use (2020-2032) (USD Billion)
11.6.7 Brazil
11.6.7.1 Brazil Engineering Software Market Estimates and Forecasts, By Application (2020-2032) (USD Billion)
11.6.7.2 Brazil Engineering Software Market Estimates and Forecasts, By Component (2020-2032) (USD Billion)
11.6.7.3 Brazil Engineering Software Market Estimates and Forecasts, By Deployment (2020-2032) (USD Billion)
11.6.7.4 Brazil Engineering Software Market Estimates and Forecasts, By End-Use (2020-2032) (USD Billion)
11.6.8 Argentina
11.6.8.1 Argentina Engineering Software Market Estimates and Forecasts, By Application (2020-2032) (USD Billion)
11.6.8.2 Argentina Engineering Software Market Estimates and Forecasts, By Component (2020-2032) (USD Billion)
11.6.8.3 Argentina Engineering Software Market Estimates and Forecasts, By Deployment (2020-2032) (USD Billion)
11.6.8.4 Argentina Engineering Software Market Estimates and Forecasts, By End-Use (2020-2032) (USD Billion)
11.6.9 Colombia
11.6.9.1 Colombia Engineering Software Market Estimates and Forecasts, By Application (2020-2032) (USD Billion)
11.6.9.2 Colombia Engineering Software Market Estimates and Forecasts, By Component (2020-2032) (USD Billion)
11.6.9.3 Colombia Engineering Software Market Estimates and Forecasts, By Deployment (2020-2032) (USD Billion)
11.6.9.4 Colombia Engineering Software Market Estimates and Forecasts, By End-Use (2020-2032) (USD Billion)
11.6.10 Rest of Latin America
11.6.10.1 Rest of Latin America Engineering Software Market Estimates and Forecasts, By Application (2020-2032) (USD Billion)
11.6.10.2 Rest of Latin America Engineering Software Market Estimates and Forecasts, By Component (2020-2032) (USD Billion)
11.6.10.3 Rest of Latin America Engineering Software Market Estimates and Forecasts, By Deployment (2020-2032) (USD Billion)
11.6.10.4 Rest of Latin America Engineering Software Market Estimates and Forecasts, By End-Use (2020-2032) (USD Billion)
12. Company Profiles
12.1 ANSYS, Inc
12.1.1 Company Overview
12.1.2 Financial
12.1.3 Products/ Services Offered
12.1.4 SWOT Analysis
12.2 Autodesk Inc.
12.2.1 Company Overview
12.2.2 Financial
12.2.3 Products/ Services Offered
12.2.4 SWOT Analysis
12.3 Bentley Systems, Incorporated
12.3.1 Company Overview
12.3.2 Financial
12.3.3 Products/ Services Offered
12.3.4 SWOT Analysis
12.4 Dassault Systems
12.4.1 Company Overview
12.4.2 Financial
12.4.3 Products/ Services Offered
12.4.4 SWOT Analysis
12.5 ESI Group
12.5.1 Company Overview
12.5.2 Financial
12.5.3 Products/ Services Offered
12.5.4 SWOT Analysis
12.6 Siemens
12.6.1 Company Overview
12.6.2 Financial
12.6.3 Products/ Services Offered
12.6.4 SWOT Analysis
12.7 3D Systems Inc.
12.7.1 Company Overview
12.7.2 Financial
12.7.3 Products/ Services Offered
12.7.4 SWOT Analysis
12.8 PTC
12.8.1 Company Overview
12.8.2 Financial
12.8.3 Products/ Services Offered
12.8.4 SWOT Analysis
12.9 Mastercam
12.9.1 Company Overview
12.9.2 Financial
12.9.3 Products/ Services Offered
12.9.4 SWOT Analysis
12.10 Hexagon AB
12.10.1 Company Overview
12.10.2 Financial
12.10.3 Products/ Services Offered
12.10.4 SWOT Analysis
13. Use Cases and Best Practices
14. Conclusion
An accurate research report requires proper strategizing as well as implementation. There are multiple factors involved in the completion of good and accurate research report and selecting the best methodology to compete the research is the toughest part. Since the research reports we provide play a crucial role in any company’s decision-making process, therefore we at SNS Insider always believe that we should choose the best method which gives us results closer to reality. This allows us to reach at a stage wherein we can provide our clients best and accurate investment to output ratio.
Each report that we prepare takes a timeframe of 350-400 business hours for production. Starting from the selection of titles through a couple of in-depth brain storming session to the final QC process before uploading our titles on our website we dedicate around 350 working hours. The titles are selected based on their current market cap and the foreseen CAGR and growth.
The 5 steps process:
Step 1: Secondary Research:
Secondary Research or Desk Research is as the name suggests is a research process wherein, we collect data through the readily available information. In this process we use various paid and unpaid databases which our team has access to and gather data through the same. This includes examining of listed companies’ annual reports, Journals, SEC filling etc. Apart from this our team has access to various associations across the globe across different industries. Lastly, we have exchange relationships with various university as well as individual libraries.

Step 2: Primary Research
When we talk about primary research, it is a type of study in which the researchers collect relevant data samples directly, rather than relying on previously collected data. This type of research is focused on gaining content specific facts that can be sued to solve specific problems. Since the collected data is fresh and first hand therefore it makes the study more accurate and genuine.
We at SNS Insider have divided Primary Research into 2 parts.
Part 1 wherein we interview the KOLs of major players as well as the upcoming ones across various geographic regions. This allows us to have their view over the market scenario and acts as an important tool to come closer to the accurate market numbers. As many as 45 paid and unpaid primary interviews are taken from both the demand and supply side of the industry to make sure we land at an accurate judgement and analysis of the market.
This step involves the triangulation of data wherein our team analyses the interview transcripts, online survey responses and observation of on filed participants. The below mentioned chart should give a better understanding of the part 1 of the primary interview.

Part 2: In this part of primary research the data collected via secondary research and the part 1 of the primary research is validated with the interviews from individual consultants and subject matter experts.
Consultants are those set of people who have at least 12 years of experience and expertise within the industry whereas Subject Matter Experts are those with at least 15 years of experience behind their back within the same space. The data with the help of two main processes i.e., FGDs (Focused Group Discussions) and IDs (Individual Discussions). This gives us a 3rd party nonbiased primary view of the market scenario making it a more dependable one while collation of the data pointers.
Step 3: Data Bank Validation
Once all the information is collected via primary and secondary sources, we run that information for data validation. At our intelligence centre our research heads track a lot of information related to the market which includes the quarterly reports, the daily stock prices, and other relevant information. Our data bank server gets updated every fortnight and that is how the information which we collected using our primary and secondary information is revalidated in real time.

Step 4: QA/QC Process
After all the data collection and validation our team does a final level of quality check and quality assurance to get rid of any unwanted or undesired mistakes. This might include but not limited to getting rid of the any typos, duplication of numbers or missing of any important information. The people involved in this process include technical content writers, research heads and graphics people. Once this process is completed the title gets uploader on our platform for our clients to read it.
Step 5: Final QC/QA Process:
This is the last process and comes when the client has ordered the study. In this process a final QA/QC is done before the study is emailed to the client. Since we believe in giving our clients a good experience of our research studies, therefore, to make sure that we do not lack at our end in any way humanly possible we do a final round of quality check and then dispatch the study to the client.
Key Segments:
By Component
Software
Computer-Aided Design (CAD) Software
Computer-Aided Manufacturing (CAM) Software
Computer-Aided Engineering (CAE) Software
Others
Services
Development Service
Training, Support & Maintenance
By Deployment
Cloud
On-Premises
By Application
Design Automation
Product Design & Testing
Plant Design
Drafting & 3D Modelling
Others
By End-Use
Automotive
Aerospace & Defense
Electronics
Medical Devices
Architecture, Engineering and Construction (AEC)
Others
Request for Segment Customization as per your Business Requirement: Segment Customization Request
Regional Coverage:
North America
US
Canada
Mexico
Europe
Eastern Europe
Poland
Romania
Hungary
Turkey
Rest of Eastern Europe
Western Europe
Germany
France
UK
Italy
Spain
Netherlands
Switzerland
Austria
Rest of Western Europe
Asia Pacific
China
India
Japan
South Korea
Vietnam
Singapore
Australia
Rest of Asia Pacific
Middle East & Africa
Middle East
UAE
Egypt
Saudi Arabia
Qatar
Rest of Middle East
Africa
Nigeria
South Africa
Rest of Africa
Latin America
Brazil
Argentina
Colombia
Rest of Latin America
Request for Country Level Research Report: Country Level Customization Request
Available Customization
With the given market data, SNS Insider offers customization as per the company’s specific needs. The following customization options are available for the report:
Detailed Volume Analysis
Criss-Cross segment analysis (e.g. Product X Application)
Competitive Product Benchmarking
Geographic Analysis
Additional countries in any of the regions
Customized Data Representation
Detailed analysis and profiling of additional market players
The Smart Luggage Market was valued at USD 2.38 billion in 2023 and is expected to reach USD 9.22 billion by 2032, growing at a CAGR of 16.28% over the forecast period 2024-2032.
The Business Intelligence (BI) software Market size was valued at USD 35.85 billion in 2023 and will grow to USD 112.4 billion and CAGR of 13.6 % by 2032.
The Legal Services Market Size was valued at USD 977.75 billion in 2023 and is expected to reach USD 1418.99 billion by 2032 and grow at a CAGR of 4.3% by 2032.
The AI Training Dataset Market, valued at USD 2.23 billion in 2023 is expected to reach USD 14.67 billion by 2032, growing at a CAGR of 23.28% over 2024-2032.
The DevSecOps Market Size was valued at USD 6.3 billion in 2023, projected to reach USD 45.93 billion by 2032 and grow at a CAGR of 24.7% by 2024-2032.
The DRaaS Market size was valued at USD 10.3 billion in 2023 and will grow to USD 47.9 billion by 2031 and grow at a CAGR of 21.2 % by 2032.

Hi! Click one of our member below to chat on Phone
© 2025 All Rights Reserved by SNS Insider Pvt Ltd


