Get More Information on Engineered Stone Market - Request Sample Report
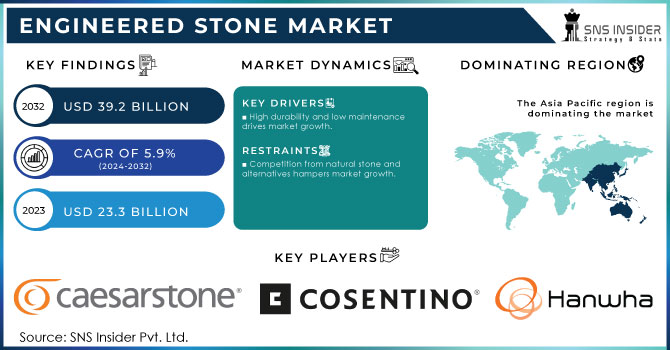
The Engineered Stone Market Size was valued at USD 23.3 Billion in 2023. It is expected to grow to USD 39.2 Billion by 2032 and grow at a CAGR of 5.9% over the forecast period of 2024-2032.
The general expansion of the construction industry, especially in developing countries, is one of the factors that boost the demand for engineered stone. Due to rapid urbanization and the growing disposable income of the citizens of the Asia-Pacific, for instance, a plethora of residential and commercial construction projects are currently being launched throughout the region. Correspondingly, more people are in need of stylish and reliable materials to use at their homes and or their workplaces. As a result, greater demand for engineered stone is observed and companies focused on launching new products
In 2023, Caesarstone began introducing a distinctive type of surface with Quartz and Antimicrobial Technology, which incorporates means of preventing bacterial contamination and, hence, is perfect for use in kitchens and bathrooms. Along with the general trend of producing smart home materials, i.e. finding smart solutions to facilitate and automate working processes, which resulted in a 40% increase in demand for smart materials, as suggested in a 2022 report by the U.S. Department of Housing and Urban Development, the identified pattern shapes the growth of the market.
By introducing smart technologies into the process of manufacturing engineered stones, one creates a product that, in addition to aesthetic qualities, serves the needs of modern consumers and the demands to be met by the market. Such factors are likely to fuel the market on a global scale concomitant with the expansion in construction activities across residential, commercial & infrastructure sectors and quartz-based engineered stone gaining popularity. Furthermore, the rising demand for artificial alternatives that are not only attractive but durable as well in comparison with natural stone coupled with the increasing use of green building materials is expected to have a positive impact on the market.
The trend of using engineered stone for sustainable architecture has gained momentum, as the social movement for greener and more sustainable building practices in line with achieving LEED certification is growing worldwide. Thus, in 2021, Cosentino Group introduced the Silestone Eco line, which consists of engineered stone with regulator admixtures. Being manufactured with the use of recycled materials, including post-consumer glass, Silestone Eco reduces waste and complies with sustainability requirements.
As a result, the product has become a favorite among architects and builders aiming at green building initiatives and LEED certification. In 2022, Diresco introduced Bio-UV as another example of engineered stone that emphasizes green marketing, as it is made with bio-resins and complies with the general tendency of green marketing regulation. Thus, the presented products reflect the increasing number of efforts of the key players aimed to satisfy customer demand and meet the rapidly developing regulatory requirements in this sphere of construction.
Drivers
High durability and low maintenance drives market growth.
The major trend is the increased use of engineered stone in construction. Its popularity is based on the high value of such stone which is appreciated by homebuilders, especially those choosing low-maintenance and durable materials. It is said to be highly resistant to different issues, such as stains, scratches, and heat, making it ideal for countertops and flooring in homes and other buildings. In this regard, a relevant trend related to new development is Cosentino Group’s launch of the Silestone HybriQ+ technology in 2022. It shows that new developments serve, and this development is no exception as it increases the stone’s strength and introduces certain aspects of sustainability.
It implements new high-recycled materials in the engineered stone that makes the technology less detrimental to the environment and increases the material’s resistance to wear and tear. Here, one should note that the new development is likely to have a higher cost that will place it into a different product class. While the demand for engineered stone is bound to increase, such a product can be viewed as premium, and the eco-friendly characteristics are going to be especially valuable in terms of modern-day construction. A U.S. government construction report claims that there is a noticeable trend toward the use of engineered materials, such as stone, that are less demanding in terms of maintenance and can be used for longer periods reducing long-term costs for construction and homebuilding.
Restraint
Competition from natural stone and alternatives hampers market growth.
Natural stones have always been the distinct choice for anyone who seeks to maintain an organic, raw, and often exclusive look. The premium construction and interior design segments have naturally embraced the product, turning it into a powerful opponent for all possible alternatives. As a result, the market is now supplied with more affordable types of ceramic tiles, laminates, and other engineered surfaces, and concrete surfaces containing stone particles and other materials combined to resemble natural and engineered stone in appearance and, to some extent, in the durability features alike. Such products attract customer and builder attention in terms of budgets, and that is even more so on residential projects, where it is crucial to save costs. Lastly, natural stones present a historical value and are therefore seen as a timeless and never-fake solution for those who are excited about traditional aesthetics.
By Product
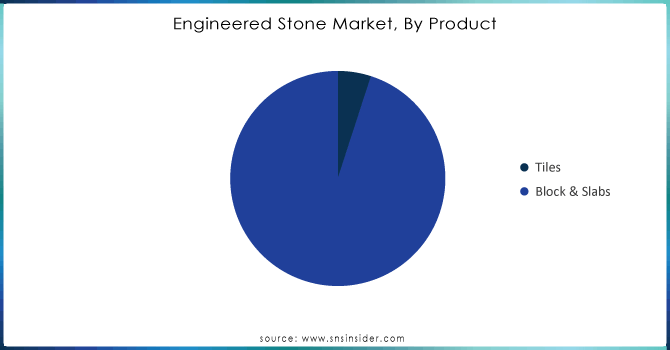
The blocks & slabs segment held the largest market share around 95% in 2023. This is due to the ease of installation and care. Unlike natural stones, they are almost not subject to stains from most of foods, including oil, wine, and other beverages usually used without coatings, which makes them ideal for kitchens. Engineered blocks and slabs can be made very large, and they are suitable for wet areas, such as bathrooms, swimming pools, showers, and bathtubs, as they are non-porous. The desire to outwardly improve the interior of the premises with the help of beautiful countertops will also contribute to the growth of demand over the reporting period.
Need any customization research on Engineered Stone Market- Enquiry Now
By Application
The countertops segment held the largest market share around 65% in 2023. This demand can be accredited to the product’s stain-resistant properties. Engineered stone slabs are relatively cheaper than natural stones and provide a greater choice regarding shape, design, color, and texture. Engineered stones contain polymeric resins that are not UV stable, leading to the stone becoming off-color and the degradation of the resin binder. In addition, continuous exposure to UV rays will cause the binding materials to harden over time which results in a reduced flexural strength. Engineered stones are thus, not fit for outdoor uses.
The flooring application is anticipated to grow at a CAGR of 4.7% over the forecast period. Engineered stone flooring is gaining popularity in home kitchens, bathrooms, and below-grade basements, owing to its water resistance and non-porous nature. In addition to this, it is used in heavily used flooring areas for its higher wear resistance. The other segment includes wall & exterior coverings, and furnishing items, such as chairs and tabletops. The products are used because of their superior aesthetics, durability, and water & stain resistance properties in the furnishing accessories market.
Regional Analysis
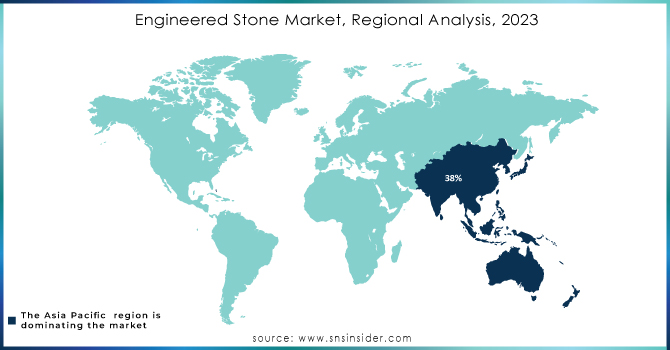
Asia Pacific held the largest market share around 38% in 2023. Rapid urbanization and increasing infrastructure investments have been observed in countries such as China, India, and Southeast Asian nations. The construction of buildings has been increasing in both residential and commercial contexts. Engineered stone has been preferred due to its high performance, durability, and aesthetic appeal due to the rising disposal incomes and evolving preferences among consumers. Moreover, the change in preferences from traditional to modern designs with luxurious interiors has been leading to the adoption of engineered stone for various applications such as kitchen countertops, wall cladding, and flooring. Secondly, manufacturing shifted to the region because of the easy availability of raw materials, and production costs are low in the region, and there is further scope for expanding production capacity. Hence Asia-Pacific can be considered a key player in large-scale manufactured production of engineered stone. Several governments and related bodies have announced large funding projects for urban housing and infrastructure, which has further been fueling the growth of the market in Asia-Pacific.
Caesarstone Ltd. (Caesarstone Quartz)
Cosentino S.A. (Silestone)
Dupont (Corian Quartz)
LG Hausys Ltd. (HI-MACS)
Compac (Compac Quartz)
Hanwha L&C (HanStone Quartz)
Vicostone (Vicostone Quartz)
Cambria (Cambria Quartz)
Technistone (Technistone Quartz)
Quartzforms (Quartzforms)
Stone Italiana S.p.A. (Stone Italiana Quartz)
Samsung Radianz (Radianz Quartz)
Pental Surfaces (PentalQuartz)
Diresco (Diresco Quartz)
Santa Margherita (Santa Margherita Quartz)
MSI Surfaces (Q Quartz)
Belenco Quartz Surfaces (Belenco Quartz)
Quarella (Quarella Quartz)
Levantina (Levantina Quartz)
Lotte Chemical Corporation (Staron Quartz)
In 2023, Cosentino introduced a new series of sustainable engineered stone under its Silestone Sunlit Days collection. This collection is the first of its kind to be carbon-neutral, addressing the growing environmental concerns in the market. The company emphasized its focus on sustainability by using recycled materials in production.
In 2023, Diresco, known for its bio-UV engineered stone, introduced a new series of engineered surfaces using biopolymer resins, positioning itself as a leader in eco-friendly engineered stone production. The development highlighted the increasing market shift towards bio-based materials in the construction industry.
Report Attributes | Details |
---|---|
Market Size in 2023 | US$ 23.3 Billion |
Market Size by 2032 | US$ 39.2 Billion |
CAGR | CAGR of 5.9% From 2024 to 2032 |
Base Year | 2023 |
Forecast Period | 2024-2032 |
Historical Data | 2020-2022 |
Report Scope & Coverage | Market Size, Segments Analysis, Competitive Landscape, Regional Analysis, DROC & SWOT Analysis, Forecast Outlook |
Key Segments | • By Product (Tiles, Block & Slabs) • By Application (Countertops, Flooring, and Others) |
Regional Analysis/Coverage | North America (US, Canada, Mexico), Europe (Eastern Europe [Poland, Romania, Hungary, Turkey, Rest of Eastern Europe] Western Europe [Germany, France, UK, Italy, Spain, Netherlands, Switzerland, Austria, Rest of Western Europe]), Asia Pacific (China, India, Japan, South Korea, Vietnam, Singapore, Australia, Rest of Asia Pacific), Middle East & Africa (Middle East [UAE, Egypt, Saudi Arabia, Qatar, Rest of Middle East], Africa [Nigeria, South Africa, Rest of Africa], Latin America (Brazil, Argentina, Colombia, Rest of Latin America) |
Company Profiles | Caesarstone Ltd., Cosentino S.A., Dupont, LG Hausys Ltd., Compac, Hanwha L&C, Vicostone, Cambria, Technistone, Quartzforms, Stone Italiana S.p.A., Samsung Radianz, Pental Surfaces, Diresco, Santa Margherita, MSI Surfaces, Belenco Quartz Surfaces, Quarella, Levantina, Lotte Chemical Corporation. and Others |
Key Drivers | • High durability and low maintenance drives market growth. |
RESTRAINTS | • Competition from natural stone and alternatives hampers market growth. |
Ans: The Engineered Stone Market was valued at USD 23.3 billion in 2023.
Ans: The expected CAGR of the global Engineered Stone Market during the forecast period is 5.9%.
Ans: The countertops segment grows rapidly in the Engineered Stone Market from 2024-2032.
Ans: Factors collaboration with architects and designers are the opportunity for Engineered Stone Market.
Ans: The U.S. led the Engineered Stone Market in North America region with the highest revenue share in 2023.
Table of Content
1. Introduction
1.1 Market Definition
1.2 Scope (Inclusion and Exclusions)
1.3 Research Assumptions
2. Executive Summary
2.1 Market Overview
2.2 Regional Synopsis
2.3 Competitive Summary
3. Research Methodology
3.1 Top-Down Approach
3.2 Bottom-up Approach
3.3. Data Validation
3.4 Primary Interviews
4. Market Dynamics Impact Analysis
3.1 Market Driving Factors Analysis
3.1.2 Drivers
3.1.2 Restraints
3.1.3 Opportunities
3.1.4 Challenges
3.2 PESTLE Analysis
3.3 Porter’s Five Forces Model
5. Statistical Insights and Trends Reporting
5.1 Production Capacity and Utilization, by Country, by Type, 2023
5.2 Feedstock Prices, by Country, by Type, 2023
5.3 Regulatory Impact, by l Country, by Type, 2023.
5.4 Environmental Metrics: Emissions Data, Waste Management Practices, and Sustainability Initiatives, by Region
5.5 Innovation and R&D, by Type 2023
6. Competitive Landscape
6.1 List of Major Companies, By Region
6.2 Market Share Analysis, By Region
6.3 Product Benchmarking
6.3.1 Product specifications and features
6.3.2 Pricing
6.4 Strategic Initiatives
6.4.1 Marketing and promotional activities
6.4.2 Distribution and supply chain strategies
6.4.3 Expansion plans and new Product launches
6.4.4 Strategic partnerships and collaborations
6.5 Technological Advancements
6.6 Market Positioning and Branding
7. Engineered Stone Market Segmentation, by Product
7.1 Chapter Overview
7.2 Tiles
7.2.1 Tiles Market Trends Analysis (2020-2032)
7.2.2 Tiles Market Size Estimates and Forecasts to 2032 (USD Billion)
7.3 Block & Slabs
7.3.1 Block & Slabs Market Trends Analysis (2020-2032)
7.3.2 Block & Slabs Market Size Estimates and Forecasts to 2032 (USD Billion)
8. Engineered Stone Market Segmentation, by Application
8.1 Chapter Overview
8.2 Countertops
8.2.1 Countertops Market Trends Analysis (2020-2032)
8.2.2 Countertops Market Size Estimates and Forecasts to 2032 (USD Billion)
8.3 Flooring
8.3.1 Flooring Market Trends Analysis (2020-2032)
8.3.2 Flooring Market Size Estimates and Forecasts to 2032 (USD Billion)
8.4 Others
8.4.1 Others Market Trends Analysis (2020-2032)
8.4.2 Others Market Size Estimates and Forecasts to 2032 (USD Billion)
9. Regional Analysis
9.1 Chapter Overview
9.2 North America
9.2.1 Trends Analysis
9.2.2 North America Engineered Stone Market Estimates and Forecasts, by Country (2020-2032) (USD Billion)
9.2.3 North America Engineered Stone Market Estimates and Forecasts, by Product (2020-2032) (USD Billion)
9.2.4 North America Engineered Stone Market Estimates and Forecasts, by Application (2020-2032) (USD Billion)
9.2.5 USA
9.2.5.1 USA Engineered Stone Market Estimates and Forecasts, by Product (2020-2032) (USD Billion)
9.2.5.2 USA Engineered Stone Market Estimates and Forecasts, by Application (2020-2032) (USD Billion)
9.2.6 Canada
9.2.6.1 Canada Engineered Stone Market Estimates and Forecasts, by Product (2020-2032) (USD Billion)
9.2.6.2 Canada Engineered Stone Market Estimates and Forecasts, by Application (2020-2032) (USD Billion)
9.2.7 Mexico
9.2.7.1 Mexico Engineered Stone Market Estimates and Forecasts, by Product (2020-2032) (USD Billion)
9.2.7.2 Mexico Engineered Stone Market Estimates and Forecasts, by Application (2020-2032) (USD Billion)
9.3 Europe
9.3.1 Eastern Europe
9.3.1.1 Trends Analysis
9.3.1.2 Eastern Europe Engineered Stone Market Estimates and Forecasts, by Country (2020-2032) (USD Billion)
9.3.1.3 Eastern Europe Engineered Stone Market Estimates and Forecasts, by Product (2020-2032) (USD Billion)
9.3.1.4 Eastern Europe Engineered Stone Market Estimates and Forecasts, by Application (2020-2032) (USD Billion)
9.3.1.5 Poland
9.3.1.5.1 Poland Engineered Stone Market Estimates and Forecasts, by Product (2020-2032) (USD Billion)
9.3.1.5.2 Poland Engineered Stone Market Estimates and Forecasts, by Application (2020-2032) (USD Billion)
9.3.1.6 Romania
9.3.1.6.1 Romania Engineered Stone Market Estimates and Forecasts, by Product (2020-2032) (USD Billion)
9.3.1.6.2 Romania Engineered Stone Market Estimates and Forecasts, by Application (2020-2032) (USD Billion)
9.3.1.7 Hungary
9.3.1.7.1 Hungary Engineered Stone Market Estimates and Forecasts, by Product (2020-2032) (USD Billion)
9.3.1.7.2 Hungary Engineered Stone Market Estimates and Forecasts, by Application (2020-2032) (USD Billion)
9.3.1.8 Turkey
9.3.1.8.1 Turkey Engineered Stone Market Estimates and Forecasts, by Product (2020-2032) (USD Billion)
9.3.1.8.2 Turkey Engineered Stone Market Estimates and Forecasts, by Application (2020-2032) (USD Billion)
9.3.1.9 Rest of Eastern Europe
9.3.1.9.1 Rest of Eastern Europe Engineered Stone Market Estimates and Forecasts, by Product (2020-2032) (USD Billion)
9.3.1.9.2 Rest of Eastern Europe Engineered Stone Market Estimates and Forecasts, by Application (2020-2032) (USD Billion)
9.3.2 Western Europe
9.3.2.1 Trends Analysis
9.3.2.2 Western Europe Engineered Stone Market Estimates and Forecasts, by Country (2020-2032) (USD Billion)
9.3.2.3 Western Europe Engineered Stone Market Estimates and Forecasts, by Product (2020-2032) (USD Billion)
9.3.2.4 Western Europe Engineered Stone Market Estimates and Forecasts, by Application (2020-2032) (USD Billion)
9.3.2.5 Germany
9.3.2.5.1 Germany Engineered Stone Market Estimates and Forecasts, by Product (2020-2032) (USD Billion)
9.3.2.5.2 Germany Engineered Stone Market Estimates and Forecasts, by Application (2020-2032) (USD Billion)
9.3.2.6 France
9.3.2.6.1 France Engineered Stone Market Estimates and Forecasts, by Product (2020-2032) (USD Billion)
9.3.2.6.2 France Engineered Stone Market Estimates and Forecasts, by Application (2020-2032) (USD Billion)
9.3.2.7 UK
9.3.2.7.1 UK Engineered Stone Market Estimates and Forecasts, by Product (2020-2032) (USD Billion)
9.3.2.7.2 UK Engineered Stone Market Estimates and Forecasts, by Application (2020-2032) (USD Billion)
9.3.2.8 Italy
9.3.2.8.1 Italy Engineered Stone Market Estimates and Forecasts, by Product (2020-2032) (USD Billion)
9.3.2.8.2 Italy Engineered Stone Market Estimates and Forecasts, by Application (2020-2032) (USD Billion)
9.3.2.9 Spain
9.3.2.9.1 Spain Engineered Stone Market Estimates and Forecasts, by Product (2020-2032) (USD Billion)
9.3.2.9.2 Spain Engineered Stone Market Estimates and Forecasts, by Application (2020-2032) (USD Billion)
9.3.2.10 Netherlands
9.3.2.10.1 Netherlands Engineered Stone Market Estimates and Forecasts, by Product (2020-2032) (USD Billion)
9.3.2.10.2 Netherlands Engineered Stone Market Estimates and Forecasts, by Application (2020-2032) (USD Billion)
9.3.2.11 Switzerland
9.3.2.11.1 Switzerland Engineered Stone Market Estimates and Forecasts, by Product (2020-2032) (USD Billion)
9.3.2.11.2 Switzerland Engineered Stone Market Estimates and Forecasts, by Application (2020-2032) (USD Billion)
9.3.2.12 Austria
9.3.2.12.1 Austria Engineered Stone Market Estimates and Forecasts, by Product (2020-2032) (USD Billion)
9.3.2.12.2 Austria Engineered Stone Market Estimates and Forecasts, by Application (2020-2032) (USD Billion)
9.3.2.13 Rest of Western Europe
9.3.2.13.1 Rest of Western Europe Engineered Stone Market Estimates and Forecasts, by Product (2020-2032) (USD Billion)
9.3.2.13.2 Rest of Western Europe Engineered Stone Market Estimates and Forecasts, by Application (2020-2032) (USD Billion)
9.4 Asia Pacific
9.4.1 Trends Analysis
9.4.2 Asia Pacific Engineered Stone Market Estimates and Forecasts, by Country (2020-2032) (USD Billion)
9.4.3 Asia Pacific Engineered Stone Market Estimates and Forecasts, by Product (2020-2032) (USD Billion)
9.4.4 Asia Pacific Engineered Stone Market Estimates and Forecasts, by Application (2020-2032) (USD Billion)
9.4.5 China
9.4.5.1 China Engineered Stone Market Estimates and Forecasts, by Product (2020-2032) (USD Billion)
9.4.5.2 China Engineered Stone Market Estimates and Forecasts, by Application (2020-2032) (USD Billion)
9.4.6 India
9.4.5.1 India Engineered Stone Market Estimates and Forecasts, by Product (2020-2032) (USD Billion)
9.4.5.2 India Engineered Stone Market Estimates and Forecasts, by Application (2020-2032) (USD Billion)
9.4.5 Japan
9.4.5.1 Japan Engineered Stone Market Estimates and Forecasts, by Product (2020-2032) (USD Billion)
9.4.5.2 Japan Engineered Stone Market Estimates and Forecasts, by Application (2020-2032) (USD Billion)
9.4.6 South Korea
9.4.6.1 South Korea Engineered Stone Market Estimates and Forecasts, by Product (2020-2032) (USD Billion)
9.4.6.2 South Korea Engineered Stone Market Estimates and Forecasts, by Application (2020-2032) (USD Billion)
9.4.7 Vietnam
9.4.7.1 Vietnam Engineered Stone Market Estimates and Forecasts, by Product (2020-2032) (USD Billion)
9.2.7.2 Vietnam Engineered Stone Market Estimates and Forecasts, by Application (2020-2032) (USD Billion)
9.4.8 Singapore
9.4.8.1 Singapore Engineered Stone Market Estimates and Forecasts, by Product (2020-2032) (USD Billion)
9.4.8.2 Singapore Engineered Stone Market Estimates and Forecasts, by Application (2020-2032) (USD Billion)
9.4.9 Australia
9.4.9.1 Australia Engineered Stone Market Estimates and Forecasts, by Product (2020-2032) (USD Billion)
9.4.9.2 Australia Engineered Stone Market Estimates and Forecasts, by Application (2020-2032) (USD Billion)
9.4.10 Rest of Asia Pacific
9.4.10.1 Rest of Asia Pacific Engineered Stone Market Estimates and Forecasts, by Product (2020-2032) (USD Billion)
9.4.10.2 Rest of Asia Pacific Engineered Stone Market Estimates and Forecasts, by Application (2020-2032) (USD Billion)
9.5 Middle East and Africa
9.5.1 Middle East
9.5.1.1 Trends Analysis
9.5.1.2 Middle East Engineered Stone Market Estimates and Forecasts, by Country (2020-2032) (USD Billion)
9.5.1.3 Middle East Engineered Stone Market Estimates and Forecasts, by Product (2020-2032) (USD Billion)
9.5.1.4 Middle East Engineered Stone Market Estimates and Forecasts, by Application (2020-2032) (USD Billion)
9.5.1.5 UAE
9.5.1.5.1 UAE Engineered Stone Market Estimates and Forecasts, by Product (2020-2032) (USD Billion)
9.5.1.5.2 UAE Engineered Stone Market Estimates and Forecasts, by Application (2020-2032) (USD Billion)
9.5.1.6 Egypt
9.5.1.6.1 Egypt Engineered Stone Market Estimates and Forecasts, by Product (2020-2032) (USD Billion)
9.5.1.6.2 Egypt Engineered Stone Market Estimates and Forecasts, by Application (2020-2032) (USD Billion)
9.5.1.7 Saudi Arabia
9.5.1.7.1 Saudi Arabia Engineered Stone Market Estimates and Forecasts, by Product (2020-2032) (USD Billion)
9.5.1.7.2 Saudi Arabia Engineered Stone Market Estimates and Forecasts, by Application (2020-2032) (USD Billion)
9.5.1.8 Qatar
9.5.1.8.1 Qatar Engineered Stone Market Estimates and Forecasts, by Product (2020-2032) (USD Billion)
9.5.1.8.2 Qatar Engineered Stone Market Estimates and Forecasts, by Application (2020-2032) (USD Billion)
9.5.1.9 Rest of Middle East
9.5.1.9.1 Rest of Middle East Engineered Stone Market Estimates and Forecasts, by Product (2020-2032) (USD Billion)
9.5.1.9.2 Rest of Middle East Engineered Stone Market Estimates and Forecasts, by Application (2020-2032) (USD Billion)
9.5.2 Africa
9.5.2.1 Trends Analysis
9.5.2.2 Africa Engineered Stone Market Estimates and Forecasts, by Country (2020-2032) (USD Billion)
9.5.2.3 Africa Engineered Stone Market Estimates and Forecasts, by Product (2020-2032) (USD Billion)
9.5.2.4 Africa Engineered Stone Market Estimates and Forecasts, by Application (2020-2032) (USD Billion)
9.5.2.5 South Africa
9.5.2.5.1 South Africa Engineered Stone Market Estimates and Forecasts, by Product (2020-2032) (USD Billion)
9.5.2.5.2 South Africa Engineered Stone Market Estimates and Forecasts, by Application (2020-2032) (USD Billion)
9.5.2.6 Nigeria
9.5.2.6.1 Nigeria Engineered Stone Market Estimates and Forecasts, by Product (2020-2032) (USD Billion)
9.5.2.6.2 Nigeria Engineered Stone Market Estimates and Forecasts, by Application (2020-2032) (USD Billion)
9.6 Latin America
9.6.1 Trends Analysis
9.6.2 Latin America Engineered Stone Market Estimates and Forecasts, by Country (2020-2032) (USD Billion)
9.6.3 Latin America Engineered Stone Market Estimates and Forecasts, by Product (2020-2032) (USD Billion)
9.6.4 Latin America Engineered Stone Market Estimates and Forecasts, by Application (2020-2032) (USD Billion)
9.6.5 Brazil
9.6.5.1 Brazil Engineered Stone Market Estimates and Forecasts, by Product (2020-2032) (USD Billion)
9.6.5.2 Brazil Engineered Stone Market Estimates and Forecasts, by Application (2020-2032) (USD Billion)
9.6.6 Argentina
9.6.6.1 Argentina Engineered Stone Market Estimates and Forecasts, by Product (2020-2032) (USD Billion)
9.6.6.2 Argentina Engineered Stone Market Estimates and Forecasts, by Application (2020-2032) (USD Billion)
9.6.7 Colombia
9.6.7.1 Colombia Engineered Stone Market Estimates and Forecasts, by Product (2020-2032) (USD Billion)
9.6.7.2 Colombia Engineered Stone Market Estimates and Forecasts, by Application (2020-2032) (USD Billion)
9.6.8 Rest of Latin America
9.6.8.1 Rest of Latin America Engineered Stone Market Estimates and Forecasts, by Product (2020-2032) (USD Billion)
9.6.8.2 Rest of Latin America Engineered Stone Market Estimates and Forecasts, by Application (2020-2032) (USD Billion)
10. Company Profiles
10.1 Caesarstone Ltd.
10.1.1 Company Overview
10.1.2 Financial
10.1.3 Products/ Services Offered
10.1.4 SWOT Analysis
10.2 Cosentino S.A.
10.2.1 Company Overview
10.2.2 Financial
10.2.3 Products/ Services Offered
10.2.4 SWOT Analysis
10.3 Dupont
10.3.1 Company Overview
10.3.2 Financial
10.3.3 Products/ Services Offered
10.3.4 SWOT Analysis
10.4 LG Hausys Ltd.
10.4.1 Company Overview
10.4.2 Financial
10.4.3 Products/ Services Offered
10.4.4 SWOT Analysis
10.5 Compac
10.5.1 Company Overview
10.5.2 Financial
10.5.3 Products/ Services Offered
10.5.4 SWOT Analysis
10.6 Huntsman Corporation
10.6.1 Company Overview
10.6.2 Financial
10.6.3 Products/ Services Offered
10.6.4 SWOT Analysis
10.7 Hanwha L&C
10.7.1 Company Overview
10.7.2 Financial
10.7.3 Products/ Services Offered
10.7.4 SWOT Analysis
10.8 Vicostone
10.8.1 Company Overview
10.8.2 Financial
10.8.3 Products/ Services Offered
10.8.4 SWOT Analysis
10.9 Cambria
10.9.1 Company Overview
10.9.2 Financial
10.9.3 Products/ Services Offered
10.9.4 SWOT Analysis
10.10 Technistone
10.10.1 Company Overview
10.10.2 Financial
10.10.3 Products/ Services Offered
10.10.4 SWOT Analysis
11. Use Cases and Best Practices
12. Conclusio
An accurate research report requires proper strategizing as well as implementation. There are multiple factors involved in the completion of good and accurate research report and selecting the best methodology to compete the research is the toughest part. Since the research reports we provide play a crucial role in any company’s decision-making process, therefore we at SNS Insider always believe that we should choose the best method which gives us results closer to reality. This allows us to reach at a stage wherein we can provide our clients best and accurate investment to output ratio.
Each report that we prepare takes a timeframe of 350-400 business hours for production. Starting from the selection of titles through a couple of in-depth brain storming session to the final QC process before uploading our titles on our website we dedicate around 350 working hours. The titles are selected based on their current market cap and the foreseen CAGR and growth.
The 5 steps process:
Step 1: Secondary Research:
Secondary Research or Desk Research is as the name suggests is a research process wherein, we collect data through the readily available information. In this process we use various paid and unpaid databases which our team has access to and gather data through the same. This includes examining of listed companies’ annual reports, Journals, SEC filling etc. Apart from this our team has access to various associations across the globe across different industries. Lastly, we have exchange relationships with various university as well as individual libraries.
Step 2: Primary Research
When we talk about primary research, it is a type of study in which the researchers collect relevant data samples directly, rather than relying on previously collected data. This type of research is focused on gaining content specific facts that can be sued to solve specific problems. Since the collected data is fresh and first hand therefore it makes the study more accurate and genuine.
We at SNS Insider have divided Primary Research into 2 parts.
Part 1 wherein we interview the KOLs of major players as well as the upcoming ones across various geographic regions. This allows us to have their view over the market scenario and acts as an important tool to come closer to the accurate market numbers. As many as 45 paid and unpaid primary interviews are taken from both the demand and supply side of the industry to make sure we land at an accurate judgement and analysis of the market.
This step involves the triangulation of data wherein our team analyses the interview transcripts, online survey responses and observation of on filed participants. The below mentioned chart should give a better understanding of the part 1 of the primary interview.
Part 2: In this part of primary research the data collected via secondary research and the part 1 of the primary research is validated with the interviews from individual consultants and subject matter experts.
Consultants are those set of people who have at least 12 years of experience and expertise within the industry whereas Subject Matter Experts are those with at least 15 years of experience behind their back within the same space. The data with the help of two main processes i.e., FGDs (Focused Group Discussions) and IDs (Individual Discussions). This gives us a 3rd party nonbiased primary view of the market scenario making it a more dependable one while collation of the data pointers.
Step 3: Data Bank Validation
Once all the information is collected via primary and secondary sources, we run that information for data validation. At our intelligence centre our research heads track a lot of information related to the market which includes the quarterly reports, the daily stock prices, and other relevant information. Our data bank server gets updated every fortnight and that is how the information which we collected using our primary and secondary information is revalidated in real time.
Step 4: QA/QC Process
After all the data collection and validation our team does a final level of quality check and quality assurance to get rid of any unwanted or undesired mistakes. This might include but not limited to getting rid of the any typos, duplication of numbers or missing of any important information. The people involved in this process include technical content writers, research heads and graphics people. Once this process is completed the title gets uploader on our platform for our clients to read it.
Step 5: Final QC/QA Process:
This is the last process and comes when the client has ordered the study. In this process a final QA/QC is done before the study is emailed to the client. Since we believe in giving our clients a good experience of our research studies, therefore, to make sure that we do not lack at our end in any way humanly possible we do a final round of quality check and then dispatch the study to the client.
Key Segments:
By Product
Tiles
Block & Slabs
By Application
Countertops
Flooring
Others
Request for Segment Customization as per your Business Requirement: Segment Customization Request
Regional Coverage:
North America
US
Canada
Mexico
Europe
Eastern Europe
Poland
Romania
Hungary
Turkey
Rest of Eastern Europe
Western Europe
Germany
France
UK
Italy
Spain
Netherlands
Switzerland
Austria
Rest of Western Europe
Asia Pacific
China
India
Japan
South Korea
Vietnam
Singapore
Australia
Rest of Asia Pacific
Middle East & Africa
Middle East
UAE
Egypt
Saudi Arabia
Qatar
Rest of Middle East
Africa
Nigeria
South Africa
Rest of Africa
Latin America
Brazil
Argentina
Colombia
Rest of Latin America
Request for Country Level Research Report: Country Level Customization Request
Available Customization
With the given market data, SNS Insider offers customization as per the company’s specific needs. The following customization options are available for the report:
Product Analysis
Criss-Cross segment analysis (e.g. Product X Application)
Product Matrix which gives a detailed comparison of product portfolio of each company
Geographic Analysis
Additional countries in any of the regions
Company Information
Detailed analysis and profiling of additional market players (Up to five)
Scrap Metal Recycling Market Size was valued at USD 523.5 Billion in 2023 and will reach USD 856.2 Billion by 2032, growing at a CAGR of 5.7% by 2024-2032.
The Water Treatment Chemicals Market Size was valued at USD 46.7 billion in 2023, and is expected to reach USD 94.2 billion by 2032, and grow at a CAGR of 8.1% over the forecast period 2024-2032.
The Industrial Filtration Market size was USD 35.37 billion in 2023 and is expected to Reach USD 54.35 billion by 2032 and grow at a CAGR of 5.61% over the forecast period of 2024-2032.
The Pyridine Market Size was valued at USD 726.0 million in 2023 and is expected to reach USD 1142.4 million by 2032 and grow at a CAGR of 5.2% over the forecast period 2024-2032.
Smart Textiles Market Size was valued at USD 2.97 billion in 2022, and expected to reach USD 16.51 billion by 2030, and grow at a CAGR of 23.9% over the forecast period 2023-2030.
The Self-Healing Materials Market Size was valued at USD 1.9 billion in 2023, and is expected to reach USD 13.7 Billion by 2032, and grow at a CAGR of 24.6% over the forecast period 2024-2032.
Hi! Click one of our member below to chat on Phone