Get more information on Engineered Plastics Market - Request Sample Report
The Engineered Plastics Market Size was valued at USD 114.80 billion in 2023 and is expected to reach USD 190.68 billion by 2032 and grow at a CAGR of 5.80% over the forecast period 2024-2032.
The electrical and electronics industry is a major driver for the engineered plastics market. It also majorly drives the market due to its remarkable insulating properties, flame retardance, and high durability, making it a more suitable product inside an electronic gadget. For consumer electronics, smart devices, and electrical components where safety and performance are a prime concern engineered plastics are the best selection.
Recent developments highlight the growing demand in this sector. For instance, in 2023, companies like BASF and SABIC introduced new high-performance engineered plastics tailored for electrical applications, such as fiber optics and electrical connectors. These materials offer improved heat resistance and mechanical strength, essential for modern electronic devices.
Moreover, ongoing developments in engineered plastics have greatly improved the manufacturing of high-performance grades with exceptional strength, heat resistance, and chemical stability. These improvements are essential for sectors such as aerospace, defense, and industrial machinery, where materials experience extreme conditions. Advanced engineered plastics like PEEK and PPS have been created to endure extreme temperatures and harsh conditions, making them perfect for aircraft parts, military gear, and heavy machinery.
In 2024, BASF launched a new type of Ultramid Advanced N, a high-performance polyamide created for application in electronics and electrical parts. This new grade provides improved heat resistance and mechanical stability, meeting the growing need for long-lasting and secure materials in the fast-expanding electronics industry.
Market Dynamics:
Drivers:
Advancements in Medical applications drive the market growth.
Rising demand from the engineered plastics market due to increasing acceptance in medical applications, fueled by its biocompatibility as well as sterilizability and stiffness that are indispensable for the manufacture of medical devices. The U.S. Food and Drug Administration has approved the use of various engineered plastics such as Polyether Ether Ketone and medical-grade polycarbonate for the safety, and performance they offer to medical devices developed using them. For instance, in 2023, One major new offering was a PEEK-based material specially tailored for making 3D printing medical implant parts which helps in personalized implants and reduces the manufacturing time.
Furthermore, rising R&D activities on healthcare innovation and the global scenario of COVID-19 have resulted in more productive research aiming for better facilities which in turn is fastening adoption from biomedical applications. Advanced materials have been emphasized by the U.S. Department of Health and Human Services, the role of advanced materials in improving patient outcomes, emphasizing their growing importance in modern healthcare systems.
Restraints:
Fluctuation in the cost of raw materials restrains market growth.
Changes in the price of raw materials greatly inhibit the expansion of the engineered plastics industry. Crude oil, a key ingredient for numerous plastics, can experience fluctuating prices because of geopolitical tensions, disruptions in the supply chain, and shifts in global demand. These fluctuations in prices may raise manufacturing expenses, posing challenges for manufacturers in keeping pricing and profitability stable. Consequently, growth in the market is limited, particularly in sectors such as automotive and electronics, which rely on cost-effectiveness to stay competitive. This fluctuation also affects extended agreements and financial strategy, posing additional obstacles to market stability.
By Type
Acrylonitrile Butadiene Styrene segments held the largest market share market around 42.45% in 2023. Its exceptional balance of properties, including outstanding impact resistance, excellent chemical compatibility, and facile processing, has propelled it to the forefront. ABS's ability to maintain dimensional stability under various conditions further enhances its appeal. As a result, it finds extensive application across sectors such as automotive, electronics, appliances, and construction. Moreover, it is tough, chemical resistant, easy to process, and dimensionally stable for a wide range of applications. The presence of these characteristics, combined with the superiority it represents at low cost have positioned ABS as a leading engineering plastic across other demand and use. Thus, it boosts the demand in the market
By End-Use Industries
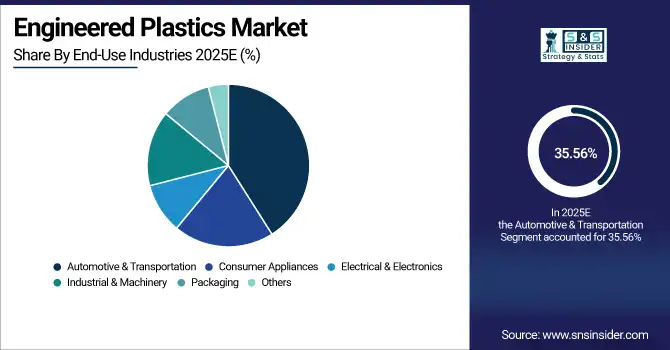
The automotive & transportation held the largest market share around 35.56% in 2023. because they are used in massive quantities to improve a multitude of automobile performance, safety, and fuel efficiency attributes. These are made of engineered plastics like polycarbonate and polyamide due to their lightweight nature that helps in cutting down the weight of an entire vehicle therefore giving rise to better fuel efficiency. In addition, they provide a combination of high strength and stiffness with low weight at competitive cost performance plus features including improved durability or impact resistance compared to incumbent solutions as well as production benefits such as extra design flexibility all key advantages for automotive components from interior panels and bumpers through to under-the-hood parts.
Get Customized Report as per your Business Requirement - Request For Customized Report
Regional Analysis:
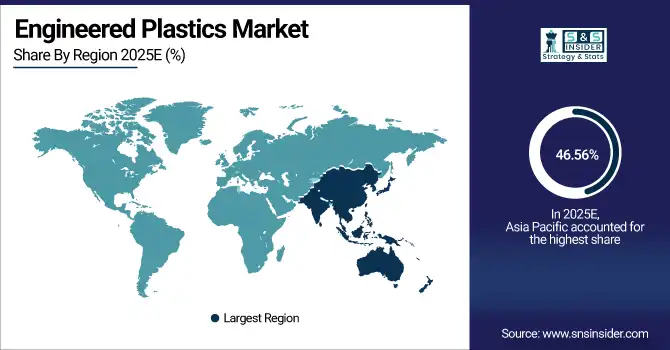
Asia Pacific held the highest market share in the engineered plastics market at about 46.56% in 2023. The leading market in the engineered plastics market is followed by Asia-Pacific due to the robust industrial base as well as rapid economic growth. The leading contributors, however, driven by their large automotive, electronics, and construction sectors— will be countries like China, India, or Japan. This region holds significant strength in manufacturing and technology development, which makes it the largest hub for engineered plastics production & consumption. The rapid urbanization and infrastructure development in China also drive demand for these materials, while the growth of the automotive and electronics industries is a factor in widening market opportunities in India. The relatively low production costs in the region, as well as supportive government policies on industrial growth and innovation, ensure that it commands a competitive edge within the global marketplace. Asia-Pacific region's strength in both industrial demand, economic growth, and strategic investments makes the biggest contribution towards driving the engineered plastics market.
The key players are SABIC (Saudi Arabia), LANXESS AG (Germany), Covestro AG (Germany), BASF SE (Germany), Mitsubishi Chemical Holdings Corporation (Japan), Celanese Corporation (US), Evonik Industries AG (Germany), The Dow Chemical Company (US), Solvay S.A. (Belgium), LG Chem Ltd. and other players.
Report Attributes | Details |
---|---|
Market Size in 2023 | US$ 114.80 Billion |
Market Size by 2032 | US$ 190.68 Billion |
CAGR | CAGR of 5.80% From 2024 to 2032 |
Base Year | 2023 |
Forecast Period | 2024-2032 |
Historical Data | 2020-2022 |
Report Scope & Coverage | Market Size, Segments Analysis, Competitive Landscape, Regional Analysis, DROC & SWOT Analysis, Forecast Outlook |
Key Segments | • By type (Acrylonitrile Butadiene Styrene, Polyamide, Polycarbonate, Thermoplastic Polyester, Polyacetal, Fluoropolymer, Others) • By end-use industries (Automotive & Transportation, Consumer Appliances, Electrical & Electronics, Industrial & Machinery, Packaging, Others) |
Regional Analysis/Coverage | North America (USA, Canada, Mexico), Europe (Germany, UK, France, Italy, Spain, Netherlands, Rest of Europe), Asia-Pacific (Japan, South Korea, China, India, Australia, Rest of Asia-Pacific), The Middle East & Africa (Israel, UAE, South Africa, Rest of Middle East & Africa), Latin America (Brazil, Argentina, Rest of Latin America) |
Company Profiles | SABIC (Saudi Arabia), LANXESS AG (Germany), Covestro AG (Germany), BASF SE (Germany), Mitsubishi Chemical Holdings Corporation (Japan), Celanese Corporation (US), Evonik Industries AG (Germany), The Dow Chemical Company (US), Solvay S.A. (Belgium), LG Chem Ltd. |
Key Drivers | • Advancements in medical applications drive the market growth. |
RESTRAINTS | • Fluctuation in the cost of raw materials restrains market growth. |
Ans: Engineered Plastics Market Size was valued at USD 114.80 billion in 2023, and is expected to reach USD 190.68 billion by 2032, and grow at a CAGR of 5.80% over the forecast period 2024-2032.
Ans: Due to the shifting consumer trends and tastes, multinational corporations are searching for possibilities to expand, which is made feasible by increased funding and investments. The businesses are welcoming mergers and acquisitions and other forms of expansion that will boost the market share of engineering plastic over the current forecast period, which will conclude in 2028.
Ans: SABIC (Saudi Arabia), LANXESS AG (Germany)Covestro AG (Germany), BASF SE (Germany), Mitsubishi Chemical Holdings Corporation (Japan), Celanese Corporation (US), Evonik Industries AG (Germany), The Dow Chemical Company (US), Solvay S.A. (Belgium), LG Chem Ltd. (South Korea) are the major key players of Engineered Plastics Market.
Ans: Manufacturers, Consultant, aftermarket players, association, Research institute, private and universities libraries, suppliers and distributors of the product.
Ans: Primary or secondary type of research done by this reports.
Table of Content
1. Introduction
1.1 Market Definition
1.2 Scope (Inclusion and Exclusions)
1.3 Research Assumptions
2. Executive Summary
2.1 Market Overview
2.2 Regional Synopsis
2.3 Competitive Summary
3. Research Methodology
3.1 Top-Down Approach
3.2 Bottom-up Approach
3.3. Data Validation
3.4 Primary Interviews
4. Market Dynamics Impact Analysis
4.1 Market Driving Factors Analysis
4.1.2 Drivers
4.1.2 Restraints
4.1.3 Opportunities
4.1.4 Challenges
4.2 PESTLE Analysis
4.3 Porter’s Five Forces Model
5. Statistical Insights and Trends Reporting
5.1 Production Capacity and Utilization, by Country, by Type, 2023
5.2 Feedstock Prices, by Country, by Type, 2023
5.3 Regulatory Impact, by Country, by Type, 2023.
5.4 Environmental Metrics: Emissions Data, Waste Management Practices, and Sustainability Initiatives, by Region
5.5 Innovation and R&D, by Type 2023
6. Competitive Landscape
6.1 List of Major Companies, By Region
6.2 Market Share Analysis, By Region
6.3 Product Benchmarking
6.3.1 Product specifications and features
6.3.2 Pricing
6.4 Strategic Initiatives
6.4.1 Marketing and promotional activities
6.4.2 Distribution and supply chain strategies
6.4.3 Expansion plans and new Type launches
6.4.4 Strategic partnerships and collaborations
6.5 Technological Advancements
6.6 Market Positioning and Branding
7. Engineered Plastics Market Segmentation, by Type
7.1 Chapter Overview
7.2 Acrylonitrile Butadiene Styrene
7.2.1 Acrylonitrile Butadiene Styrene Market Trends Analysis (2020-2032)
7.2.2 Acrylonitrile Butadiene Styrene Market Size Estimates and Forecasts to 2032 (USD Billion)
7.3 Polyamide
7.3.1 Polyamide Market Trends Analysis (2020-2032)
7.3.2 Polyamide Market Size Estimates and Forecasts to 2032 (USD Billion)
7.4 Polycarbonate
7.4.1 Polycarbonate Market Trends Analysis (2020-2032)
7.4.2 Polycarbonate Market Size Estimates and Forecasts to 2032 (USD Billion)
7.5 Thermoplastic Polyester
7.5.1 Thermoplastic Polyester Market Trends Analysis (2020-2032)
7.5.2 Thermoplastic Polyester Market Size Estimates and Forecasts to 2032 (USD Billion)
7.6 Polyacetal
7.6.1 Polyacetal Market Trends Analysis (2020-2032)
7.6.2 Polyacetal Market Size Estimates and Forecasts to 2032 (USD Billion)
7.7 Fluoropolymer
7.7.1 Fluoropolymer Market Trends Analysis (2020-2032)
7.7.2 FluoropolymerMarket Size Estimates and Forecasts to 2032 (USD Billion)
7.8 Others
7.8.1 Others Market Trends Analysis (2020-2032)
7.8.2 Others Market Size Estimates and Forecasts to 2032 (USD Billion)
8. Engineered Plastics Market Segmentation, by End-Use Industries
8.1 Chapter Overview
8.2 Automotive & Transportation
8.2.1 Automotive & Transportation Market Trends Analysis (2020-2032)
8.2.2 Automotive & Transportation Market Size Estimates and Forecasts to 2032 (USD Billion)
8.3 Consumer Appliances
8.3.1 Consumer Appliances Market Trends Analysis (2020-2032)
8.3.2 Consumer Appliances Market Size Estimates and Forecasts to 2032 (USD Billion)
8.4 Electrical & Electronics
8.4.1 Electrical & Electronics Market Trends Analysis (2020-2032)
8.4.2 Electrical & Electronics Market Size Estimates and Forecasts to 2032 (USD Billion)
8.5 Industrial & Machinery
8.5.1 Industrial & Machinery Market Trends Analysis (2020-2032)
8.5.2 Industrial & Machinery Market Size Estimates and Forecasts to 2032 (USD Billion)
8.6 Packaging
8.6.1 Packaging Market Trends Analysis (2020-2032)
8.6.2 Packaging Market Size Estimates and Forecasts to 2032 (USD Billion)
8.7 Others
8.7.1 Others Market Trends Analysis (2020-2032)
8.7.2 Others Market Size Estimates and Forecasts to 2032 (USD Billion)
9. Regional Analysis
9.1 Chapter Overview
9.2 North America
9.2.1 Trends Analysis
9.2.2 North America Engineered Plastics Market Estimates and Forecasts, by Country (2020-2032) (USD Billion)
9.2.3 North America Engineered Plastics Market Estimates and Forecasts, by Type (2020-2032) (USD Billion)
9.2.4 North America Engineered Plastics Market Estimates and Forecasts, by End-Use Industries (2020-2032) (USD Billion)
9.2.5 USA
9.2.5.1 USA Engineered Plastics Market Estimates and Forecasts, by Type (2020-2032) (USD Billion)
9.2.5.2 USA Engineered Plastics Market Estimates and Forecasts, by End-Use Industries (2020-2032) (USD Billion)
9.2.6 Canada
9.2.6.1 Canada Engineered Plastics Market Estimates and Forecasts, by Type (2020-2032) (USD Billion)
9.2.6.2 Canada Engineered Plastics Market Estimates and Forecasts, by End-Use Industries (2020-2032) (USD Billion)
9.2.7 Mexico
9.2.7.1 Mexico Engineered Plastics Market Estimates and Forecasts, by Type (2020-2032) (USD Billion)
9.2.7.2 Mexico Engineered Plastics Market Estimates and Forecasts, by End-Use Industries (2020-2032) (USD Billion)
9.3 Europe
9.3.1 Eastern Europe
9.3.1.1 Trends Analysis
9.3.1.2 Eastern Europe Engineered Plastics Market Estimates and Forecasts, by Country (2020-2032) (USD Billion)
9.3.1.3 Eastern Europe Engineered Plastics Market Estimates and Forecasts, by Type (2020-2032) (USD Billion)
9.3.1.4 Eastern Europe Engineered Plastics Market Estimates and Forecasts, by End-Use Industries (2020-2032) (USD Billion)
9.3.1.5 Poland
9.3.1.5.1 Poland Engineered Plastics Market Estimates and Forecasts, by Type (2020-2032) (USD Billion)
9.3.1.5.2 Poland Engineered Plastics Market Estimates and Forecasts, by End-Use Industries (2020-2032) (USD Billion)
9.3.1.6 Romania
9.3.1.6.1 Romania Engineered Plastics Market Estimates and Forecasts, by Type (2020-2032) (USD Billion)
9.3.1.6.2 Romania Engineered Plastics Market Estimates and Forecasts, by End-Use Industries (2020-2032) (USD Billion)
9.3.1.7 Hungary
9.3.1.7.1 Hungary Engineered Plastics Market Estimates and Forecasts, by Type (2020-2032) (USD Billion)
9.3.1.7.2 Hungary Engineered Plastics Market Estimates and Forecasts, by End-Use Industries (2020-2032) (USD Billion)
9.3.1.8 Turkey
9.3.1.8.1 Turkey Engineered Plastics Market Estimates and Forecasts, by Type (2020-2032) (USD Billion)
9.3.1.8.2 Turkey Engineered Plastics Market Estimates and Forecasts, by End-Use Industries (2020-2032) (USD Billion)
9.3.1.9 Rest of Eastern Europe
9.3.1.9.1 Rest of Eastern Europe Engineered Plastics Market Estimates and Forecasts, by Type (2020-2032) (USD Billion)
9.3.1.9.2 Rest of Eastern Europe Engineered Plastics Market Estimates and Forecasts, by End-Use Industries (2020-2032) (USD Billion)
9.3.2 Western Europe
9.3.2.1 Trends Analysis
9.3.2.2 Western Europe Engineered Plastics Market Estimates and Forecasts, by Country (2020-2032) (USD Billion)
9.3.2.3 Western Europe Engineered Plastics Market Estimates and Forecasts, by Type (2020-2032) (USD Billion)
9.3.2.4 Western Europe Engineered Plastics Market Estimates and Forecasts, by End-Use Industries (2020-2032) (USD Billion)
9.3.2.5 Germany
9.3.2.5.1 Germany Engineered Plastics Market Estimates and Forecasts, by Type (2020-2032) (USD Billion)
9.3.2.5.2 Germany Engineered Plastics Market Estimates and Forecasts, by End-Use Industries (2020-2032) (USD Billion)
9.3.2.6 France
9.3.2.6.1 France Engineered Plastics Market Estimates and Forecasts, by Type (2020-2032) (USD Billion)
9.3.2.6.2 France Engineered Plastics Market Estimates and Forecasts, by End-Use Industries (2020-2032) (USD Billion)
9.3.2.7 UK
9.3.2.7.1 UK Engineered Plastics Market Estimates and Forecasts, by Type (2020-2032) (USD Billion)
9.3.2.7.2 UK Engineered Plastics Market Estimates and Forecasts, by End-Use Industries (2020-2032) (USD Billion)
9.3.2.8 Italy
9.3.2.8.1 Italy Engineered Plastics Market Estimates and Forecasts, by Type (2020-2032) (USD Billion)
9.3.2.8.2 Italy Engineered Plastics Market Estimates and Forecasts, by End-Use Industries (2020-2032) (USD Billion)
9.3.2.9 Spain
9.3.2.9.1 Spain Engineered Plastics Market Estimates and Forecasts, by Type (2020-2032) (USD Billion)
9.3.2.9.2 Spain Engineered Plastics Market Estimates and Forecasts, by End-Use Industries (2020-2032) (USD Billion)
9.3.2.10 Netherlands
9.3.2.10.1 Netherlands Engineered Plastics Market Estimates and Forecasts, by Type (2020-2032) (USD Billion)
9.3.2.10.2 Netherlands Engineered Plastics Market Estimates and Forecasts, by End-Use Industries (2020-2032) (USD Billion)
9.3.2.11 Switzerland
9.3.2.11.1 Switzerland Engineered Plastics Market Estimates and Forecasts, by Type (2020-2032) (USD Billion)
9.3.2.11.2 Switzerland Engineered Plastics Market Estimates and Forecasts, by End-Use Industries (2020-2032) (USD Billion)
9.3.2.12 Austria
9.3.2.12.1 Austria Engineered Plastics Market Estimates and Forecasts, by Type (2020-2032) (USD Billion)
9.3.2.12.2 Austria Engineered Plastics Market Estimates and Forecasts, by End-Use Industries (2020-2032) (USD Billion)
9.3.2.13 Rest of Western Europe
9.3.2.13.1 Rest of Western Europe Engineered Plastics Market Estimates and Forecasts, by Type (2020-2032) (USD Billion)
9.3.2.13.2 Rest of Western Europe Engineered Plastics Market Estimates and Forecasts, by End-Use Industries (2020-2032) (USD Billion)
9.4 Asia Pacific
9.4.1 Trends Analysis
9.4.2 Asia Pacific Engineered Plastics Market Estimates and Forecasts, by Country (2020-2032) (USD Billion)
9.4.3 Asia Pacific Engineered Plastics Market Estimates and Forecasts, by Type (2020-2032) (USD Billion)
9.4.4 Asia Pacific Engineered Plastics Market Estimates and Forecasts, by End-Use Industries (2020-2032) (USD Billion)
9.4.5 China
9.4.5.1 China Engineered Plastics Market Estimates and Forecasts, by Type (2020-2032) (USD Billion)
9.4.5.2 China Engineered Plastics Market Estimates and Forecasts, by End-Use Industries (2020-2032) (USD Billion)
9.4.6 India
9.4.5.1 India Engineered Plastics Market Estimates and Forecasts, by Type (2020-2032) (USD Billion)
9.4.5.2 India Engineered Plastics Market Estimates and Forecasts, by End-Use Industries (2020-2032) (USD Billion)
9.4.5 Japan
9.4.5.1 Japan Engineered Plastics Market Estimates and Forecasts, by Type (2020-2032) (USD Billion)
9.4.5.2 Japan Engineered Plastics Market Estimates and Forecasts, by End-Use Industries (2020-2032) (USD Billion)
9.4.6 South Korea
9.4.6.1 South Korea Engineered Plastics Market Estimates and Forecasts, by Type (2020-2032) (USD Billion)
9.4.6.2 South Korea Engineered Plastics Market Estimates and Forecasts, by End-Use Industries (2020-2032) (USD Billion)
9.4.7 Vietnam
9.4.7.1 Vietnam Engineered Plastics Market Estimates and Forecasts, by Type (2020-2032) (USD Billion)
9.2.7.2 Vietnam Engineered Plastics Market Estimates and Forecasts, by End-Use Industries (2020-2032) (USD Billion)
9.4.8 Singapore
9.4.8.1 Singapore Engineered Plastics Market Estimates and Forecasts, by Type (2020-2032) (USD Billion)
9.4.8.2 Singapore Engineered Plastics Market Estimates and Forecasts, by End-Use Industries (2020-2032) (USD Billion)
9.4.9 Australia
9.4.9.1 Australia Engineered Plastics Market Estimates and Forecasts, by Type (2020-2032) (USD Billion)
9.4.9.2 Australia Engineered Plastics Market Estimates and Forecasts, by End-Use Industries (2020-2032) (USD Billion)
9.4.10 Rest of Asia Pacific
9.4.10.1 Rest of Asia Pacific Engineered Plastics Market Estimates and Forecasts, by Type (2020-2032) (USD Billion)
9.4.10.2 Rest of Asia Pacific Engineered Plastics Market Estimates and Forecasts, by End-Use Industries (2020-2032) (USD Billion)
9.5 Middle East and Africa
9.5.1 Middle East
9.5.1.1 Trends Analysis
9.5.1.2 Middle East Engineered Plastics Market Estimates and Forecasts, by Country (2020-2032) (USD Billion)
9.5.1.3 Middle East Engineered Plastics Market Estimates and Forecasts, by Type (2020-2032) (USD Billion)
9.5.1.4 Middle East Engineered Plastics Market Estimates and Forecasts, by End-Use Industries (2020-2032) (USD Billion)
9.5.1.5 UAE
9.5.1.5.1 UAE Engineered Plastics Market Estimates and Forecasts, by Type (2020-2032) (USD Billion)
9.5.1.5.2 UAE Engineered Plastics Market Estimates and Forecasts, by End-Use Industries (2020-2032) (USD Billion)
9.5.1.6 Egypt
9.5.1.6.1 Egypt Engineered Plastics Market Estimates and Forecasts, by Type (2020-2032) (USD Billion)
9.5.1.6.2 Egypt Engineered Plastics Market Estimates and Forecasts, by End-Use Industries (2020-2032) (USD Billion)
9.5.1.7 Saudi Arabia
9.5.1.7.1 Saudi Arabia Engineered Plastics Market Estimates and Forecasts, by Type (2020-2032) (USD Billion)
9.5.1.7.2 Saudi Arabia Engineered Plastics Market Estimates and Forecasts, by End-Use Industries (2020-2032) (USD Billion)
9.5.1.8 Qatar
9.5.1.8.1 Qatar Engineered Plastics Market Estimates and Forecasts, by Type (2020-2032) (USD Billion)
9.5.1.8.2 Qatar Engineered Plastics Market Estimates and Forecasts, by End-Use Industries (2020-2032) (USD Billion)
9.5.1.9 Rest of Middle East
9.5.1.9.1 Rest of Middle East Engineered Plastics Market Estimates and Forecasts, by Type (2020-2032) (USD Billion)
9.5.1.9.2 Rest of Middle East Engineered Plastics Market Estimates and Forecasts, by End-Use Industries (2020-2032) (USD Billion)
9.5.2 Africa
9.5.2.1 Trends Analysis
9.5.2.2 Africa Engineered Plastics Market Estimates and Forecasts, by Country (2020-2032) (USD Billion)
9.5.2.3 Africa Engineered Plastics Market Estimates and Forecasts, by Type (2020-2032) (USD Billion)
9.5.2.4 Africa Engineered Plastics Market Estimates and Forecasts, by End-Use Industries (2020-2032) (USD Billion)
9.5.2.5 South Africa
9.5.2.5.1 South Africa Engineered Plastics Market Estimates and Forecasts, by Type (2020-2032) (USD Billion)
9.5.2.5.2 South Africa Engineered Plastics Market Estimates and Forecasts, by End-Use Industries (2020-2032) (USD Billion)
9.5.2.6 Nigeria
9.5.2.6.1 Nigeria Engineered Plastics Market Estimates and Forecasts, by Type (2020-2032) (USD Billion)
9.5.2.6.2 Nigeria Engineered Plastics Market Estimates and Forecasts, by End-Use Industries (2020-2032) (USD Billion)
9.5.2.7 Rest of Africa
9.5.2.7.1 Rest of Africa Engineered Plastics Market Estimates and Forecasts, by Component (2020-2032) (USD Billion)
9.5.2.7.2 Rest of Africa Engineered Plastics Market Estimates and Forecasts, by Technology (2020-2032) (USD Billion)
9.6 Latin America
9.6.1 Trends Analysis
9.6.2 Latin America Engineered Plastics Market Estimates and Forecasts, by Country (2020-2032) (USD Billion)
9.6.3 Latin America Engineered Plastics Market Estimates and Forecasts, by Type (2020-2032) (USD Billion)
9.6.4 Latin America Engineered Plastics Market Estimates and Forecasts, by End-Use Industries (2020-2032) (USD Billion)
9.6.5 Brazil
9.6.5.1 Brazil Engineered Plastics Market Estimates and Forecasts, by Type (2020-2032) (USD Billion)
9.6.5.2 Brazil Engineered Plastics Market Estimates and Forecasts, by End-Use Industries (2020-2032) (USD Billion)
9.6.6 Argentina
9.6.6.1 Argentina Engineered Plastics Market Estimates and Forecasts, by Type (2020-2032) (USD Billion)
9.6.6.2 Argentina Engineered Plastics Market Estimates and Forecasts, by End-Use Industries (2020-2032) (USD Billion)
9.6.7 Colombia
9.6.7.1 Colombia Engineered Plastics Market Estimates and Forecasts, by Type (2020-2032) (USD Billion)
9.6.7.2 Colombia Engineered Plastics Market Estimates and Forecasts, by End-Use Industries (2020-2032) (USD Billion)
9.6.8 Rest of Latin America
9.6.8.1 Rest of Latin America Engineered Plastics Market Estimates and Forecasts, by Type (2020-2032) (USD Billion)
9.6.8.2 Rest of Latin America Engineered Plastics Market Estimates and Forecasts, by End-Use Industries (2020-2032) (USD Billion)
10. Company Profiles
10.1 SABIC
10.1.1 Company Overview
10.1.2 Financial
10.1.3 Products/ Services Offered
10.1.4 SWOT Analysis
10.2 LANXESS AG
10.2.1 Company Overview
10.2.2 Financial
10.2.3 Products/ Services Offered
10.2.4 SWOT Analysis
10.3 Covestro AG
10.3.1 Company Overview
10.3.2 Financial
10.3.3 Products/ Services Offered
10.3.4 SWOT Analysis
10.4 , BASF SE
10.4.1 Company Overview
10.4.2 Financial
10.4.3 Products/ Services Offered
10.4.4 SWOT Analysis
10.5 Mitsubishi Chemical Holdings Corporation
10.5.1 Company Overview
10.5.2 Financial
10.5.3 Products/ Services Offered
10.5.4 SWOT Analysis
10.6 Celanese Corporation
10.6.1 Company Overview
10.6.2 Financial
10.6.3 Products/ Services Offered
10.6.4 SWOT Analysis
10.7 Evonik Industries AG
10.7.1 Company Overview
10.7.2 Financial
10.7.3 Products/ Services Offered
10.7.4 SWOT Analysis
10.8 The Dow Chemical Company
10.8.1 Company Overview
10.8.2 Financial
10.8.3 Products/ Services Offered
10.8.4 SWOT Analysis
10.9 Solvay S.A.
10.9.1 Company Overview
10.9.2 Financial
10.9.3 Products/ Services Offered
10.9.4 SWOT Analysis
10.10 LG Chem Ltd.
10.10.1 Company Overview
10.10.2 Financial
10.10.3 Products/ Services Offered
10.10.4 SWOT Analysis
11. Use Cases and Best Practices
12. Conclusion
An accurate research report requires proper strategizing as well as implementation. There are multiple factors involved in the completion of good and accurate research report and selecting the best methodology to compete the research is the toughest part. Since the research reports we provide play a crucial role in any company’s decision-making process, therefore we at SNS Insider always believe that we should choose the best method which gives us results closer to reality. This allows us to reach at a stage wherein we can provide our clients best and accurate investment to output ratio.
Each report that we prepare takes a timeframe of 350-400 business hours for production. Starting from the selection of titles through a couple of in-depth brain storming session to the final QC process before uploading our titles on our website we dedicate around 350 working hours. The titles are selected based on their current market cap and the foreseen CAGR and growth.
The 5 steps process:
Step 1: Secondary Research:
Secondary Research or Desk Research is as the name suggests is a research process wherein, we collect data through the readily available information. In this process we use various paid and unpaid databases which our team has access to and gather data through the same. This includes examining of listed companies’ annual reports, Journals, SEC filling etc. Apart from this our team has access to various associations across the globe across different industries. Lastly, we have exchange relationships with various university as well as individual libraries.
Step 2: Primary Research
When we talk about primary research, it is a type of study in which the researchers collect relevant data samples directly, rather than relying on previously collected data. This type of research is focused on gaining content specific facts that can be sued to solve specific problems. Since the collected data is fresh and first hand therefore it makes the study more accurate and genuine.
We at SNS Insider have divided Primary Research into 2 parts.
Part 1 wherein we interview the KOLs of major players as well as the upcoming ones across various geographic regions. This allows us to have their view over the market scenario and acts as an important tool to come closer to the accurate market numbers. As many as 45 paid and unpaid primary interviews are taken from both the demand and supply side of the industry to make sure we land at an accurate judgement and analysis of the market.
This step involves the triangulation of data wherein our team analyses the interview transcripts, online survey responses and observation of on filed participants. The below mentioned chart should give a better understanding of the part 1 of the primary interview.
Part 2: In this part of primary research the data collected via secondary research and the part 1 of the primary research is validated with the interviews from individual consultants and subject matter experts.
Consultants are those set of people who have at least 12 years of experience and expertise within the industry whereas Subject Matter Experts are those with at least 15 years of experience behind their back within the same space. The data with the help of two main processes i.e., FGDs (Focused Group Discussions) and IDs (Individual Discussions). This gives us a 3rd party nonbiased primary view of the market scenario making it a more dependable one while collation of the data pointers.
Step 3: Data Bank Validation
Once all the information is collected via primary and secondary sources, we run that information for data validation. At our intelligence centre our research heads track a lot of information related to the market which includes the quarterly reports, the daily stock prices, and other relevant information. Our data bank server gets updated every fortnight and that is how the information which we collected using our primary and secondary information is revalidated in real time.
Step 4: QA/QC Process
After all the data collection and validation our team does a final level of quality check and quality assurance to get rid of any unwanted or undesired mistakes. This might include but not limited to getting rid of the any typos, duplication of numbers or missing of any important information. The people involved in this process include technical content writers, research heads and graphics people. Once this process is completed the title gets uploader on our platform for our clients to read it.
Step 5: Final QC/QA Process:
This is the last process and comes when the client has ordered the study. In this process a final QA/QC is done before the study is emailed to the client. Since we believe in giving our clients a good experience of our research studies, therefore, to make sure that we do not lack at our end in any way humanly possible we do a final round of quality check and then dispatch the study to the client.
Key Segments:
By Type
Acrylonitrile Butadiene Styrene
Polyamide
Polycarbonate
Thermoplastic Polyester
Polyacetal
Others
By End-Use Industries
Acrylonitrile Butadiene Styrene
Polyamide
Polycarbonate
Thermoplastic Polyester
Polyacetal
Fluoropolymer
Others
Request for Segment Customization as per your Business Requirement: Segment Customization Request
Regional Coverage:
North America
US
Canada
Mexico
Europe
Eastern Europe
Poland
Romania
Hungary
Turkey
Rest of Eastern Europe
Western Europe
Germany
France
UK
Italy
Spain
Netherlands
Switzerland
Austria
Rest of Western Europe
Asia Pacific
China
India
Japan
South Korea
Vietnam
Singapore
Australia
Rest of Asia Pacific
Middle East & Africa
Middle East
UAE
Egypt
Saudi Arabia
Qatar
Rest of Middle East
Africa
Nigeria
South Africa
Rest of Africa
Latin America
Brazil
Argentina
Colombia
Rest of Latin America
Request for Country Level Research Report: Country Level Customization Request
Available Customization
With the given market data, SNS Insider offers customization as per the company’s specific needs. The following customization options are available for the report:
Product Analysis
Criss-Cross segment analysis (e.g. Product X Application)
Product Matrix which gives a detailed comparison of the product portfolio of each company
Geographic Analysis
Additional countries in any of the regions
Company Information
Detailed analysis and profiling of additional market players (Up to five)
The Membranes Market size was valued at USD 7.3 Billion in 2023. It is expected to grow to USD 14.2 Billion by 2032 and grow at a CAGR of 7.7% over the forecast period of 2024-2032.
Explore the Argan Oil Market, focusing on its use in cosmetics, personal care, and food industries. Learn about key trends, rising demand for natural ingredients, and how argan oil's skin, hair, and health benefits are driving its growth in the global mar
The Bromine Market Size was valued at USD 3.7 billion in 2023 and is expected to reach USD 5.4 billion by 2032 and grow at a CAGR of 4.2% over the forecast period 2024-2032.
The Color Cosmetics Market Size was valued at USD 76.8 billion in 2023, and is expected to reach USD 128.7 billion by 2032, and grow at a CAGR of 5.9% over the forecast period 2024-2032.
The Industrial Evaporators Market Size was valued at USD 20.4 billion in 2023 and is expected to reach USD 32.60 billion by 2032 and grow at a CAGR of 5.35% over the forecast period 2024-2032.
The Anti-wear Additives Market Size was valued at USD 736.5 million in 2023, and is expected to reach USD 911.5 million by 2031, and grow at a CAGR of 2.7% over the forecast period 2024-2031.
Hi! Click one of our member below to chat on Phone