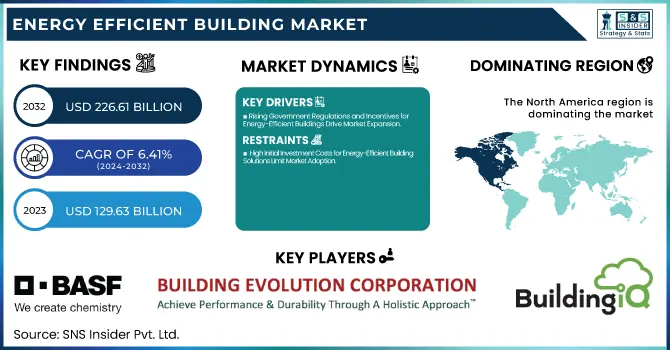
The Energy Efficient Building Market size was valued at USD 129.63 billion in 2023 and is expected to reach USD 226.61 billion by 2032, growing at a CAGR of 6.41% over the forecast period 2024-2032.
The energy-efficient building market is experiencing significant growth, driven by increasing environmental concerns, stringent government regulations, and rising awareness of sustainable construction. The adoption of advanced insulation materials, energy management systems, and smart technologies is reshaping the industry. Companies are investing heavily in innovative solutions to enhance building efficiency, reduce energy consumption, and lower carbon emissions. ABB partnered with the World Green Building Council in January 2024 to accelerate the development of energy-efficient buildings across Europe, emphasizing the role of digitalization and automation in sustainable construction. Johnson Controls has been expanding its portfolio of energy-efficient HVAC systems to cater to the growing demand for smart building solutions. Saint-Gobain and Kingspan Group are introducing high-performance insulation materials to improve energy efficiency in both commercial and residential buildings. Owens Corning and Rockwool International A/S are focusing on advanced thermal insulation solutions to minimize energy loss. India is making significant strides in energy-efficient housing, as highlighted in October 2024, with passive design techniques and sustainable materials being integrated into large-scale residential projects. Additionally, in January 2025, a $35 million fund was announced to support developers in building and renovating energy-efficient rental housing, further encouraging sustainable development.
Technological advancements and collaborative efforts are shaping the future of energy-efficient buildings. Schneider Electric and Honeywell are leading advancements in building automation and smart energy management systems, optimizing energy consumption through AI-driven solutions. High-performance buildings are gaining traction, as noted in an October 2024 report, where the adoption of smart energy systems and intelligent design is driving sustainability in urban development. In December 2023, a study highlighted the importance of sustainable designs in minimizing energy consumption, reinforcing the need for innovative strategies in commercial and residential projects. Covestro AG and BASF SE are investing in energy-efficient coatings and polyurethane insulation materials to enhance thermal performance. Europe is strengthening its commitment to energy efficiency, as seen in a January 2025 report detailing how energy-efficient buildings are crucial to achieving long-term sustainability goals. The momentum is further supported by organizations such as the UNDP, which, in December 2024, outlined six key lessons for future smart energy-efficient buildings, emphasizing data-driven decision-making and integrated renewable energy solutions. Dow Inc. and Knauf Insulation are also playing a key role in developing advanced insulation products that contribute to overall energy savings. With continuous investments in technology and policy support, the market is poised to accelerate the transition toward sustainable and energy-efficient infrastructure.
Drivers
Rising Government Regulations and Incentives for Energy-Efficient Buildings Drive Market Expansion
Growing awareness among consumers and businesses about energy efficiency and its impact on sustainability is driving demand for energy-efficient buildings. Businesses are increasingly adopting green building solutions to achieve sustainability targets and reduce operational costs. Large corporations, including Johnson Controls, Schneider Electric, and Honeywell, are integrating smart building management systems to optimize energy use and minimize waste. The rising popularity of net-zero energy buildings, which generate as much energy as they consume, is further propelling the market. Consumers are also prioritizing energy-efficient homes equipped with smart thermostats, LED lighting, and high-performance insulation. The trend of green leasing, where tenants seek energy-efficient properties to reduce their carbon footprint, is becoming prevalent in the commercial real estate sector. This shift toward sustainability is significantly contributing to the expansion of the energy-efficient building market.
Increasing Consumer Awareness and Corporate Sustainability Goals Fuel Market Growth
Restraints
High Initial Investment Costs for Energy-Efficient Building Solutions Limit Market Adoption
One of the major barriers to the widespread adoption of energy-efficient buildings is the high upfront cost associated with energy-efficient materials, smart building technologies, and renewable energy systems. Advanced insulation materials, energy-efficient HVAC systems, and automated energy management solutions often require significant capital investment, making them less accessible to small-scale developers and homeowners. While long-term energy savings offset these costs, many stakeholders hesitate due to budget constraints and limited access to financing options. Retrofitting existing buildings with energy-efficient upgrades can also be costly, deterring property owners from investing in green renovations. Additionally, integrating smart technologies requires skilled labor and technical expertise, further adding to implementation expenses. The high initial investment remains a challenge, slowing the rate of adoption in price-sensitive markets.
Opportunities
Expansion of Green Building Initiatives and Net-Zero Energy Construction Drives Market Growth
The increasing emphasis on green building certifications and net-zero energy construction presents significant growth opportunities for the energy-efficient building market. Countries worldwide are implementing sustainability targets that encourage the development of net-zero buildings, which generate as much energy as they consume. Certifications such as LEED, BREEAM, and WELL Building Standard promote the use of energy-efficient materials, smart energy management systems, and renewable energy integration. Governments are also supporting green infrastructure projects through incentives and subsidies, creating a favorable market environment. Leading companies such as Kingspan Group, Rockwool International A/S, and Saint-Gobain S.A. are focusing on developing next-generation insulation and energy-efficient materials to align with these initiatives. The growing shift toward net-zero energy buildings will drive demand for innovative energy-efficient solutions.
Challenge
Complexity of Retrofitting Existing Buildings with Energy-Efficient Technologies Creates Implementation Challenges
Retrofitting existing buildings with energy-efficient technologies presents significant challenges due to structural limitations, high costs, and technical complexities. Older buildings often lack the infrastructure to support advanced insulation, smart energy management systems, and renewable energy integration. Retrofitting requires extensive modifications, such as upgrading HVAC systems, replacing inefficient windows, and installing smart lighting and automation systems. These upgrades can be disruptive, requiring temporary displacement of occupants and additional labor-intensive processes. Moreover, ensuring compatibility between legacy systems and new technologies adds complexity to retrofitting projects. Companies such as Honeywell and Johnson Controls are developing tailored retrofitting solutions, but widespread adoption remains slow due to logistical hurdles and cost constraints. Addressing these challenges is crucial to accelerating the transition toward energy-efficient buildings.
By Type
HVAC dominated the energy-efficient building market in 2023 with a market share of 35%. The heating, ventilation, and air conditioning (HVAC) systems play a crucial role in maintaining indoor comfort while consuming a significant amount of energy. The increasing emphasis on energy efficiency has driven the development and adoption of advanced HVAC technologies that reduce energy consumption and improve operational efficiency. Modern HVAC systems incorporate features such as variable refrigerant flow, smart thermostats, and advanced control systems that optimize energy usage according to occupancy and environmental conditions. For instance, smart thermostats allow users to set temperature schedules that align with their daily routines, significantly reducing energy waste when buildings are unoccupied. Additionally, energy recovery ventilators enhance indoor air quality while minimizing energy loss. Government incentives and regulations encouraging the installation of energy-efficient HVAC systems further contribute to their popularity. As businesses and homeowners seek to lower energy bills and minimize their carbon footprint, the demand for high-efficiency HVAC solutions continues to grow, solidifying HVAC's position as the leading segment in the energy-efficient building market.
By Material
Polyisocyanurate (PIR) dominated the energy-efficient building market in 2023 with a market share of 25%. PIR insulation is known for its exceptional thermal performance and is widely used in various building applications, including roofs, walls, and floors. One of the key advantages of PIR insulation is its high R-value, which indicates superior resistance to heat flow, making it an ideal choice for improving the energy efficiency of buildings. With energy codes becoming increasingly stringent, builders and architects are opting for PIR as it helps meet and exceed these standards. The lightweight and easy-to-install nature of PIR also simplifies construction processes and reduces labor costs. Additionally, PIR insulation is often used in commercial applications, where energy efficiency is a primary concern due to the high energy demands of large buildings. Recent innovations in PIR technology, such as the development of more environmentally friendly formulations, have further enhanced its appeal. As the market for energy-efficient buildings continues to expand, the demand for PIR insulation is expected to grow, reinforcing its dominant position in the materials segment.
By End-use
Commercial buildings dominated the energy-efficient building market in 2023 with a market share of 45%. The commercial sector, encompassing office buildings, retail spaces, and industrial facilities, represents a significant portion of energy consumption globally. As energy prices rise and environmental awareness increases, businesses are increasingly prioritizing energy-efficient practices to reduce costs and enhance their sustainability profiles. Many commercial buildings are being retrofitted with energy-efficient technologies such as LED lighting, advanced HVAC systems, and smart building management systems that monitor and optimize energy usage. These upgrades not only contribute to lower operating costs but also improve occupant comfort and productivity. Additionally, regulatory pressures and government incentives aimed at promoting energy efficiency further drive the adoption of sustainable practices in the commercial sector. Companies are recognizing that energy-efficient buildings can also enhance their marketability and brand reputation, making them more attractive to tenants and investors. As a result, the commercial end-use segment continues to lead the energy-efficient building market, reflecting a growing commitment to sustainability and resource conservation in the business community.
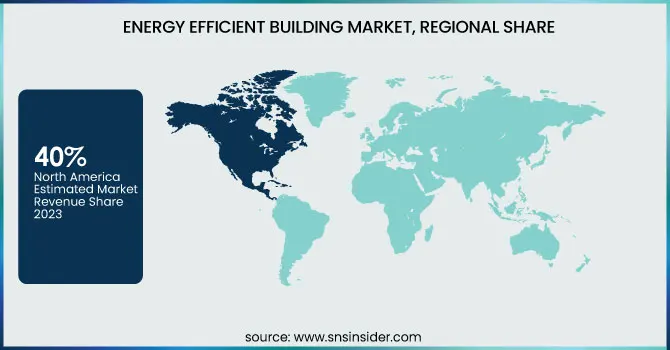
In 2023, North America dominated the energy-efficient building market in 2023 with a market share of 40%. This dominance can be attributed to the strong regulatory frameworks, growing environmental awareness, and the presence of key players in the region. The United States, in particular, has implemented stringent building codes that require commercial and residential buildings to adhere to energy efficiency standards, driving the demand for energy-efficient solutions. For example, the U.S. Green Building Council’s LEED (Leadership in Energy and Environmental Design) certification has become a benchmark for energy-efficient buildings, incentivizing both new constructions and retrofitting of existing buildings. Additionally, Canada has set ambitious goals for reducing carbon emissions, with programs such as the Canadian Green Building Council’s Zero Carbon Building program encouraging the use of energy-efficient materials and systems. The market is further bolstered by government incentives, rebates, and tax credits for adopting energy-efficient technologies. Moreover, the growing trend of sustainable buildings among corporate offices and industrial facilities has contributed to North America's dominant market share. These initiatives, alongside technological advancements in energy-efficient HVAC systems, lighting, and insulation, have solidified North America's position as the leader in the energy-efficient building market.
On the other hand, Asia-Pacific was the fastest growing region in the energy-efficient building market in 2023, with a CAGR of 9%. The rapid urbanization and industrialization in countries like China, India, and Japan are driving the growth of energy-efficient buildings in the region. In China, the government has made significant strides in promoting energy efficiency through its “13th Five-Year Plan for Ecological and Environmental Protection,” which includes measures to improve the energy performance of buildings. The country is investing heavily in green building projects and retrofitting existing structures to meet new energy standards. India, too, has seen a rise in energy-efficient buildings, particularly with the introduction of its Energy Conservation Building Code (ECBC) and initiatives like the Smart Cities Mission, which emphasizes sustainability. Japan’s commitment to reducing carbon emissions has led to the widespread adoption of energy-efficient building technologies. As a result, the Asia-Pacific region is experiencing robust growth in energy-efficient buildings, driven by both government policies and an increasing awareness among consumers and businesses about the environmental and economic benefits of energy-efficient buildings. With governments across the region prioritizing green building practices, the market is expected to continue growing at a rapid pace in the coming years.
Fastest Growing Region in 2023:
Asia-Pacific emerged as the fastest growing region in the energy-efficient building market in 2023, with a CAGR of 9%. The rapid urbanization and industrialization in countries like China, India, and Japan are driving the growth of energy-efficient buildings in the region. In China, the government has made significant strides in promoting energy efficiency through its “13th Five-Year Plan for Ecological and Environmental Protection,” which includes measures to improve the energy performance of buildings. The country is investing heavily in green building projects and retrofitting existing structures to meet new energy standards. India, too, has seen a rise in energy-efficient buildings, particularly with the introduction of its Energy Conservation Building Code (ECBC) and initiatives like the Smart Cities Mission, which emphasizes sustainability. Japan’s commitment to reducing carbon emissions has led to the widespread adoption of energy-efficient building technologies. As a result, the Asia-Pacific region is experiencing robust growth in energy-efficient buildings, driven by both government policies and an increasing awareness among consumers and businesses about the environmental and economic benefits of energy-efficient buildings. With governments across the region prioritizing green building practices, the market is expected to continue growing at a rapid pace in the coming years.
ABB Group (Building Automation Systems, Energy Management Solutions)
Ameresco Inc (Energy Efficiency Services, Renewable Energy Solutions)
Architectural Energy Corporation (Energy Modeling Software, Building Performance Analysis Tools)
BASF SE (Insulation Materials, Energy-efficient Coatings)
Building Evolution Corporation (Energy Management Systems, Energy Efficiency Consulting Services)
Building IQ (Building Energy Optimization Software, Smart Building Solutions)
Cleantech Group (Clean Energy Solutions, Sustainability Consulting)
Covestro AG (Polyurethane Insulation Materials, Energy-efficient Coatings)
Dow Inc. (Thermal Insulation Products, Building Energy Management Solutions)
EnerNOC (Energy Management Software, Demand Response Solutions)
Energy Panel Structures (Energy-efficient Wall Systems, Insulated Panel Systems)
Fletcher Building (Building Insulation Materials, Energy-efficient Construction Solutions)
GAF Materials Corporation (Roofing Insulation, Energy-efficient Roofing Systems)
Honeywell (Building Automation Systems, Energy Management Solutions)
Johnson Controls (HVAC Systems, Building Automation Solutions)
Johnson Controls, Inc. (Energy-efficient HVAC Systems, Building Management Systems)
Kingspan Group (Insulation Products, High-performance Building Materials)
Knauf Insulation (Mineral Wool Insulation, Thermal Insulation Products)
Rockwool International A/S (Stone Wool Insulation, Acoustic Insulation Products)
Saint-Gobain S.A. (Insulation Materials, Energy-efficient Building Products)
December 2024: ABB partnered with the World Green Building Council to promote sustainable energy-efficient buildings across Europe, focusing on advancing energy-saving technologies and solutions.
December 2023: Saint-Gobain S.A. reached an agreement with SOPREMA to sell 75% of its stake in the polyisocyanurate (PIR) insulation business in the UK under the Celotex brand. SOPREMA, a European manufacturer, specializes in PIR insulation.
July 2023: Kingspan Insulated Panels North America introduced QuadCore Technology as the standard for all its panels used in cold storage. This advanced insulation core offers a leading R-value of R-9.0 per inch, significantly improving thermal efficiency compared to high-quality PIR and PUR, with up to 60% better performance.
Report Attributes | Details |
---|---|
Market Size in 2023 | US$ 129.63 Billion |
Market Size by 2032 | US$ 226.61 Billion |
CAGR | CAGR of 6.41% From 2024 to 2032 |
Base Year | 2023 |
Forecast Period | 2024-2032 |
Historical Data | 2020-2022 |
Report Scope & Coverage | Market Size, Segments Analysis, Competitive Landscape, Regional Analysis, DROC & SWOT Analysis, Forecast Outlook |
Key Segments | •By Type (HVAC, Lighting, Building Controls, Water Efficiency, Water Heating, Building Envelope, Others) •By Material (Glass Wool, Mineral Wool, Expanded Polystyrene (EPS), Extruded Polystyrene (XPS), Cellulose, Polyisocyanurate (PIR), Polyurethane (PUR), Others) •By End-Use (Residential, Commercial, Industrial) |
Regional Analysis/Coverage | North America (US, Canada, Mexico), Europe (Eastern Europe [Poland, Romania, Hungary, Turkey, Rest of Eastern Europe] Western Europe] Germany, France, UK, Italy, Spain, Netherlands, Switzerland, Austria, Rest of Western Europe]), Asia Pacific (China, India, Japan, South Korea, Vietnam, Singapore, Australia, Rest of Asia Pacific), Middle East & Africa (Middle East [UAE, Egypt, Saudi Arabia, Qatar, Rest of Middle East], Africa [Nigeria, South Africa, Rest of Africa], Latin America (Brazil, Argentina, Colombia, Rest of Latin America) |
Company Profiles | Saint-Gobain S.A., Owens Corning, Johns Manville, Kingspan Group, Rockwool International A/S, BASF SE, Dow Inc., Honeywell, Johnson Controls, Schneider Electric and other key players |
Key Drivers | •Rising Government Regulations and Incentives for Energy-Efficient Buildings Drive Market Expansion •Increasing Consumer Awareness and Corporate Sustainability Goals Fuel Market Growth |
RESTRAINTS | •High Initial Investment Costs for Energy-Efficient Building Solutions Limit Market Adoption |
Ans: The energy-efficient building market was valued at USD 129.63 billion in 2023.
Ans: The Energy Efficient Building Market is expected to reach USD 226.61 billion by 2032, growing at a CAGR of 6.41%.
Ans: Increasing environmental concerns, government regulations, and the adoption of smart technologies are key growth drivers.
Ans: The commercial building sector led the market, accounting for 45% of the market share.
Ans: North America dominated the market.
Table of Contents
1. Introduction
1.1 Market Definition
1.2 Scope (Inclusion and Exclusions)
1.3 Research Assumptions
2. Executive Summary
2.1 Market Overview
2.2 Regional Synopsis
2.3 Competitive Summary
3. Research Methodology
3.1 Top-Down Approach
3.2 Bottom-up Approach
3.3. Data Validation
3.4 Primary Interviews
4. Market Dynamics Impact Analysis
4.1 Market Driving Factors Analysis
4.1.1 Drivers
4.1.2 Restraints
4.1.3 Opportunities
4.1.4 Challenges
4.2 PESTLE Analysis
4.3 Porter’s Five Forces Model
5. Statistical Insights and Trends Reporting
5.1 Sustainability Certifications and Standards
5.2 Investment Trends in Energy-Efficient Buildings
5.3 Cost-Benefit Analysis of Energy-Efficient Solutions
5.4 Funding and Investment Opportunities
6. Competitive Landscape
6.1 List of Major Companies, By Region
6.2 Market Share Analysis, By Region
6.3 Product Benchmarking
6.3.1 Product specifications and features
6.3.2 Pricing
6.4 Strategic Initiatives
6.4.1 Marketing and promotional activities
6.4.2 Distribution and supply chain strategies
6.4.3 Expansion plans and new product launches
6.4.4 Strategic partnerships and collaborations
6.5 Technological Advancements
6.6 Market Positioning and Branding
7. Energy Efficient Building Market Segmentation, by Type
7.1 Chapter Overview
7.2 HVAC
7.2.1 HVAC Market Trends Analysis (2020-2032)
7.2.2 HVAC Market Size Estimates and Forecasts to 2032 (USD Billion)
7.3 Lighting
7.3.1 Lighting Market Trends Analysis (2020-2032)
7.3.2 Lighting Market Size Estimates and Forecasts to 2032 (USD Billion)
7.4 Building Controls
7.4.1 Building Controls Market Trends Analysis (2020-2032)
7.4.2 Building Controls Market Size Estimates and Forecasts to 2032 (USD Billion)
7.5 Water Efficiency
7.5.1 Water Efficiency Market Trends Analysis (2020-2032)
7.5.2 Water Efficiency Market Size Estimates and Forecasts to 2032 (USD Billion)
7.6 Water Heating
7.6.1 Water Heating Market Trends Analysis (2020-2032)
7.6.2 Water Heating Market Size Estimates and Forecasts to 2032 (USD Billion)
7.7 Building Envelope
7.7.1 Building Envelope Market Trends Analysis (2020-2032)
7.7.2 Building Envelope Market Size Estimates and Forecasts to 2032 (USD Billion)
7.8 Others
7.8.1 Others Market Trends Analysis (2020-2032)
7.8.2 Others Market Size Estimates and Forecasts to 2032 (USD Billion)
8. Energy Efficient Building Market Segmentation, by Material
8.1 Chapter Overview
8.2 Glass Wool
8.2.1 Glass Wool Market Trends Analysis (2020-2032)
8.2.2 Glass Wool Market Size Estimates and Forecasts to 2032 (USD Billion)
8.3 Mineral Wool
8.3.1 Mineral Wool Market Trends Analysis (2020-2032)
8.3.2 Mineral Wool Market Size Estimates and Forecasts to 2032 (USD Billion)
8.4 Expanded Polystyrene (EPS)
8.4.1 Expanded Polystyrene (EPS) Market Trends Analysis (2020-2032)
8.4.2 Expanded Polystyrene (EPS) Market Size Estimates and Forecasts to 2032 (USD Billion)
8.5 Extruded Polystyrene (XPS)
8.5.1 Extruded Polystyrene (XPS) Market Trends Analysis (2020-2032)
8.5.2 Extruded Polystyrene (XPS) Market Size Estimates and Forecasts to 2032 (USD Billion)
8.6 Cellulose
8.6.1 Cellulose Market Trends Analysis (2020-2032)
8.6.2 Cellulose Market Size Estimates and Forecasts to 2032 (USD Billion)
8.7 Polyisocyanurate (PIR)
8.7.1 Polyisocyanurate (PIR) Market Trends Analysis (2020-2032)
8.7.2 Polyisocyanurate (PIR) Market Size Estimates and Forecasts to 2032 (USD Billion)
8.8 Polyurethane (PUR)
8.8.1 Polyurethane (PUR) Market Trends Analysis (2020-2032)
8.8.2 Polyurethane (PUR) Market Size Estimates and Forecasts to 2032 (USD Billion)
8.9 Others
8.9.1 Others Market Trends Analysis (2020-2032)
8.9.2 Others Market Size Estimates and Forecasts to 2032 (USD Billion)
9. Energy Efficient Building Market Segmentation, by End-use
9.1 Chapter Overview
9.2 Residential
9.2.1 Residential Market Trends Analysis (2020-2032)
9.2.2 Residential Market Size Estimates and Forecasts to 2032 (USD Billion)
9.3 Commercial
9.3.1 Commercial Market Trends Analysis (2020-2032)
9.3.2 Commercial Market Size Estimates and Forecasts to 2032 (USD Billion)
9.4 Industrial
9.4.1 Industrial Market Trends Analysis (2020-2032)
9.4.2 Industrial Market Size Estimates and Forecasts to 2032 (USD Billion)
10. Regional Analysis
10.1 Chapter Overview
10.2 North America
10.2.1 Trends Analysis
10.2.2 North America Energy Efficient Building Market Estimates and Forecasts, by Country (2020-2032) (USD Billion)
10.2.3 North America Energy Efficient Building Market Estimates and Forecasts, by Type (2020-2032) (USD Billion)
10.2.4 North America Energy Efficient Building Market Estimates and Forecasts, by Material (2020-2032) (USD Billion)
10.2.5 North America Energy Efficient Building Market Estimates and Forecasts, by End-use (2020-2032) (USD Billion)
10.2.6 USA
10.2.6.1 USA Energy Efficient Building Market Estimates and Forecasts, by Type (2020-2032) (USD Billion)
10.2.6.2 USA Energy Efficient Building Market Estimates and Forecasts, by Material (2020-2032) (USD Billion)
10.2.6.3 USA Energy Efficient Building Market Estimates and Forecasts, by End-use (2020-2032) (USD Billion)
10.2.7 Canada
10.2.7.1 Canada Energy Efficient Building Market Estimates and Forecasts, by Type (2020-2032) (USD Billion)
10.2.7.2 Canada Energy Efficient Building Market Estimates and Forecasts, by Material (2020-2032) (USD Billion)
10.2.7.3 Canada Energy Efficient Building Market Estimates and Forecasts, by End-use (2020-2032) (USD Billion)
10.2.8 Mexico
10.2.8.1 Mexico Energy Efficient Building Market Estimates and Forecasts, by Type (2020-2032) (USD Billion)
10.2.8.2 Mexico Energy Efficient Building Market Estimates and Forecasts, by Material (2020-2032) (USD Billion)
10.2.8.3 Mexico Energy Efficient Building Market Estimates and Forecasts, by End-use (2020-2032) (USD Billion)
10.3 Europe
10.3.1 Eastern Europe
10.3.1.1 Trends Analysis
10.3.1.2 Eastern Europe Energy Efficient Building Market Estimates and Forecasts, by Country (2020-2032) (USD Billion)
10.3.1.3 Eastern Europe Energy Efficient Building Market Estimates and Forecasts, by Type (2020-2032) (USD Billion)
10.3.1.4 Eastern Europe Energy Efficient Building Market Estimates and Forecasts, by Material (2020-2032) (USD Billion)
10.3.1.5 Eastern Europe Energy Efficient Building Market Estimates and Forecasts, by End-use (2020-2032) (USD Billion)
10.3.1.6 Poland
10.3.1.6.1 Poland Energy Efficient Building Market Estimates and Forecasts, by Type (2020-2032) (USD Billion)
10.3.1.6.2 Poland Energy Efficient Building Market Estimates and Forecasts, by Material (2020-2032) (USD Billion)
10.3.1.6.3 Poland Energy Efficient Building Market Estimates and Forecasts, by End-use (2020-2032) (USD Billion)
10.3.1.7 Romania
10.3.1.7.1 Romania Energy Efficient Building Market Estimates and Forecasts, by Type (2020-2032) (USD Billion)
10.3.1.7.2 Romania Energy Efficient Building Market Estimates and Forecasts, by Material (2020-2032) (USD Billion)
10.3.1.7.3 Romania Energy Efficient Building Market Estimates and Forecasts, by End-use (2020-2032) (USD Billion)
10.3.1.8 Hungary
10.3.1.8.1 Hungary Energy Efficient Building Market Estimates and Forecasts, by Type (2020-2032) (USD Billion)
10.3.1.8.2 Hungary Energy Efficient Building Market Estimates and Forecasts, by Material (2020-2032) (USD Billion)
10.3.1.8.3 Hungary Energy Efficient Building Market Estimates and Forecasts, by End-use (2020-2032) (USD Billion)
10.3.1.9 Turkey
10.3.1.9.1 Turkey Energy Efficient Building Market Estimates and Forecasts, by Type (2020-2032) (USD Billion)
10.3.1.9.2 Turkey Energy Efficient Building Market Estimates and Forecasts, by Material (2020-2032) (USD Billion)
10.3.1.9.3 Turkey Energy Efficient Building Market Estimates and Forecasts, by End-use (2020-2032) (USD Billion)
10.3.1.10 Rest of Eastern Europe
10.3.1.10.1 Rest of Eastern Europe Energy Efficient Building Market Estimates and Forecasts, by Type (2020-2032) (USD Billion)
10.3.1.10.2 Rest of Eastern Europe Energy Efficient Building Market Estimates and Forecasts, by Material (2020-2032) (USD Billion)
10.3.1.10.3 Rest of Eastern Europe Energy Efficient Building Market Estimates and Forecasts, by End-use (2020-2032) (USD Billion)
10.3.2 Western Europe
10.3.2.1 Trends Analysis
10.3.2.2 Western Europe Energy Efficient Building Market Estimates and Forecasts, by Country (2020-2032) (USD Billion)
10.3.2.3 Western Europe Energy Efficient Building Market Estimates and Forecasts, by Type (2020-2032) (USD Billion)
10.3.2.4 Western Europe Energy Efficient Building Market Estimates and Forecasts, by Material (2020-2032) (USD Billion)
10.3.2.5 Western Europe Energy Efficient Building Market Estimates and Forecasts, by End-use (2020-2032) (USD Billion)
10.3.2.6 Germany
10.3.2.6.1 Germany Energy Efficient Building Market Estimates and Forecasts, by Type (2020-2032) (USD Billion)
10.3.2.6.2 Germany Energy Efficient Building Market Estimates and Forecasts, by Material (2020-2032) (USD Billion)
10.3.2.6.3 Germany Energy Efficient Building Market Estimates and Forecasts, by End-use (2020-2032) (USD Billion)
10.3.2.7 France
10.3.2.7.1 France Energy Efficient Building Market Estimates and Forecasts, by Type (2020-2032) (USD Billion)
10.3.2.7.2 France Energy Efficient Building Market Estimates and Forecasts, by Material (2020-2032) (USD Billion)
10.3.2.7.3 France Energy Efficient Building Market Estimates and Forecasts, by End-use (2020-2032) (USD Billion)
10.3.2.8 UK
10.3.2.8.1 UK Energy Efficient Building Market Estimates and Forecasts, by Type (2020-2032) (USD Billion)
10.3.2.8.2 UK Energy Efficient Building Market Estimates and Forecasts, by Material (2020-2032) (USD Billion)
10.3.2.8.3 UK Energy Efficient Building Market Estimates and Forecasts, by End-use (2020-2032) (USD Billion)
10.3.2.9 Italy
10.3.2.9.1 Italy Energy Efficient Building Market Estimates and Forecasts, by Type (2020-2032) (USD Billion)
10.3.2.9.2 Italy Energy Efficient Building Market Estimates and Forecasts, by Material (2020-2032) (USD Billion)
10.3.2.9.3 Italy Energy Efficient Building Market Estimates and Forecasts, by End-use (2020-2032) (USD Billion)
10.3.2.10 Spain
10.3.2.10.1 Spain Energy Efficient Building Market Estimates and Forecasts, by Type (2020-2032) (USD Billion)
10.3.2.10.2 Spain Energy Efficient Building Market Estimates and Forecasts, by Material (2020-2032) (USD Billion)
10.3.2.10.3 Spain Energy Efficient Building Market Estimates and Forecasts, by End-use (2020-2032) (USD Billion)
10.3.2.11 Netherlands
10.3.2.11.1 Netherlands Energy Efficient Building Market Estimates and Forecasts, by Type (2020-2032) (USD Billion)
10.3.2.11.2 Netherlands Energy Efficient Building Market Estimates and Forecasts, by Material (2020-2032) (USD Billion)
10.3.2.11.3 Netherlands Energy Efficient Building Market Estimates and Forecasts, by End-use (2020-2032) (USD Billion)
10.3.2.12 Switzerland
10.3.2.12.1 Switzerland Energy Efficient Building Market Estimates and Forecasts, by Type (2020-2032) (USD Billion)
10.3.2.12.2 Switzerland Energy Efficient Building Market Estimates and Forecasts, by Material (2020-2032) (USD Billion)
10.3.2.12.3 Switzerland Energy Efficient Building Market Estimates and Forecasts, by End-use (2020-2032) (USD Billion)
10.3.2.13 Austria
10.3.2.13.1 Austria Energy Efficient Building Market Estimates and Forecasts, by Type (2020-2032) (USD Billion)
10.3.2.13.2 Austria Energy Efficient Building Market Estimates and Forecasts, by Material (2020-2032) (USD Billion)
10.3.2.13.3 Austria Energy Efficient Building Market Estimates and Forecasts, by End-use (2020-2032) (USD Billion)
10.3.2.14 Rest of Western Europe
10.3.2.14.1 Rest of Western Europe Energy Efficient Building Market Estimates and Forecasts, by Type (2020-2032) (USD Billion)
10.3.2.14.2 Rest of Western Europe Energy Efficient Building Market Estimates and Forecasts, by Material (2020-2032) (USD Billion)
10.3.2.14.3 Rest of Western Europe Energy Efficient Building Market Estimates and Forecasts, by End-use (2020-2032) (USD Billion)
10.4 Asia Pacific
10.4.1 Trends Analysis
10.4.2 Asia Pacific Energy Efficient Building Market Estimates and Forecasts, by Country (2020-2032) (USD Billion)
10.4.3 Asia Pacific Energy Efficient Building Market Estimates and Forecasts, by Type (2020-2032) (USD Billion)
10.4.4 Asia Pacific Energy Efficient Building Market Estimates and Forecasts, by Material (2020-2032) (USD Billion)
10.4.5 Asia Pacific Energy Efficient Building Market Estimates and Forecasts, by End-use (2020-2032) (USD Billion)
10.4.6 China
10.4.6.1 China Energy Efficient Building Market Estimates and Forecasts, by Type (2020-2032) (USD Billion)
10.4.6.2 China Energy Efficient Building Market Estimates and Forecasts, by Material (2020-2032) (USD Billion)
10.4.6.3 China Energy Efficient Building Market Estimates and Forecasts, by End-use (2020-2032) (USD Billion)
10.4.7 India
10.4.7.1 India Energy Efficient Building Market Estimates and Forecasts, by Type (2020-2032) (USD Billion)
10.4.7.2 India Energy Efficient Building Market Estimates and Forecasts, by Material (2020-2032) (USD Billion)
10.4.7.3 India Energy Efficient Building Market Estimates and Forecasts, by End-use (2020-2032) (USD Billion)
10.4.8 Japan
10.4.8.1 Japan Energy Efficient Building Market Estimates and Forecasts, by Type (2020-2032) (USD Billion)
10.4.8.2 Japan Energy Efficient Building Market Estimates and Forecasts, by Material (2020-2032) (USD Billion)
10.4.8.3 Japan Energy Efficient Building Market Estimates and Forecasts, by End-use (2020-2032) (USD Billion)
10.4.9 South Korea
10.4.9.1 South Korea Energy Efficient Building Market Estimates and Forecasts, by Type (2020-2032) (USD Billion)
10.4.9.2 South Korea Energy Efficient Building Market Estimates and Forecasts, by Material (2020-2032) (USD Billion)
10.4.9.3 South Korea Energy Efficient Building Market Estimates and Forecasts, by End-use (2020-2032) (USD Billion)
10.4.10 Vietnam
10.4.10.1 Vietnam Energy Efficient Building Market Estimates and Forecasts, by Type (2020-2032) (USD Billion)
10.4.10.2 Vietnam Energy Efficient Building Market Estimates and Forecasts, by Material (2020-2032) (USD Billion)
10.4.10.3 Vietnam Energy Efficient Building Market Estimates and Forecasts, by End-use (2020-2032) (USD Billion)
10.4.11 Singapore
10.4.11.1 Singapore Energy Efficient Building Market Estimates and Forecasts, by Type (2020-2032) (USD Billion)
10.4.11.2 Singapore Energy Efficient Building Market Estimates and Forecasts, by Material (2020-2032) (USD Billion)
10.4.11.3 Singapore Energy Efficient Building Market Estimates and Forecasts, by End-use (2020-2032) (USD Billion)
10.4.12 Australia
10.4.12.1 Australia Energy Efficient Building Market Estimates and Forecasts, by Type (2020-2032) (USD Billion)
10.4.12.2 Australia Energy Efficient Building Market Estimates and Forecasts, by Material (2020-2032) (USD Billion)
10.4.12.3 Australia Energy Efficient Building Market Estimates and Forecasts, by End-use (2020-2032) (USD Billion)
10.4.13 Rest of Asia Pacific
10.4.13.1 Rest of Asia Pacific Energy Efficient Building Market Estimates and Forecasts, by Type (2020-2032) (USD Billion)
10.4.13.2 Rest of Asia Pacific Energy Efficient Building Market Estimates and Forecasts, by Material (2020-2032) (USD Billion)
10.4.13.3 Rest of Asia Pacific Energy Efficient Building Market Estimates and Forecasts, by End-use (2020-2032) (USD Billion)
10.5 Middle East and Africa
10.5.1 Middle East
10.5.1.1 Trends Analysis
10.5.1.2 Middle East Energy Efficient Building Market Estimates and Forecasts, by Country (2020-2032) (USD Billion)
10.5.1.3 Middle East Energy Efficient Building Market Estimates and Forecasts, by Type (2020-2032) (USD Billion)
10.5.1.4 Middle East Energy Efficient Building Market Estimates and Forecasts, by Material (2020-2032) (USD Billion)
10.5.1.5 Middle East Energy Efficient Building Market Estimates and Forecasts, by End-use (2020-2032) (USD Billion)
10.5.1.6 UAE
10.5.1.6.1 UAE Energy Efficient Building Market Estimates and Forecasts, by Type (2020-2032) (USD Billion)
10.5.1.6.2 UAE Energy Efficient Building Market Estimates and Forecasts, by Material (2020-2032) (USD Billion)
10.5.1.6.3 UAE Energy Efficient Building Market Estimates and Forecasts, by End-use (2020-2032) (USD Billion)
10.5.1.7 Egypt
10.5.1.7.1 Egypt Energy Efficient Building Market Estimates and Forecasts, by Type (2020-2032) (USD Billion)
10.5.1.7.2 Egypt Energy Efficient Building Market Estimates and Forecasts, by Material (2020-2032) (USD Billion)
10.5.1.7.3 Egypt Energy Efficient Building Market Estimates and Forecasts, by End-use (2020-2032) (USD Billion)
10.5.1.8 Saudi Arabia
10.5.1.8.1 Saudi Arabia Energy Efficient Building Market Estimates and Forecasts, by Type (2020-2032) (USD Billion)
10.5.1.8.2 Saudi Arabia Energy Efficient Building Market Estimates and Forecasts, by Material (2020-2032) (USD Billion)
10.5.1.8.3 Saudi Arabia Energy Efficient Building Market Estimates and Forecasts, by End-use (2020-2032) (USD Billion)
10.5.1.9 Qatar
10.5.1.9.1 Qatar Energy Efficient Building Market Estimates and Forecasts, by Type (2020-2032) (USD Billion)
10.5.1.9.2 Qatar Energy Efficient Building Market Estimates and Forecasts, by Material (2020-2032) (USD Billion)
10.5.1.9.3 Qatar Energy Efficient Building Market Estimates and Forecasts, by End-use (2020-2032) (USD Billion)
10.5.1.10 Rest of Middle East
10.5.1.10.1 Rest of Middle East Energy Efficient Building Market Estimates and Forecasts, by Type (2020-2032) (USD Billion)
10.5.1.10.2 Rest of Middle East Energy Efficient Building Market Estimates and Forecasts, by Material (2020-2032) (USD Billion)
10.5.1.10.3 Rest of Middle East Energy Efficient Building Market Estimates and Forecasts, by End-use (2020-2032) (USD Billion)
10.5.2 Africa
10.5.2.1 Trends Analysis
10.5.2.2 Africa Energy Efficient Building Market Estimates and Forecasts, by Country (2020-2032) (USD Billion)
10.5.2.3 Africa Energy Efficient Building Market Estimates and Forecasts, by Type (2020-2032) (USD Billion)
10.5.2.4 Africa Energy Efficient Building Market Estimates and Forecasts, by Material (2020-2032) (USD Billion)
10.5.2.5 Africa Energy Efficient Building Market Estimates and Forecasts, by End-use (2020-2032) (USD Billion)
10.5.2.6 South Africa
10.5.2.6.1 South Africa Energy Efficient Building Market Estimates and Forecasts, by Type (2020-2032) (USD Billion)
10.5.2.6.2 South Africa Energy Efficient Building Market Estimates and Forecasts, by Material (2020-2032) (USD Billion)
10.5.2.6.3 South Africa Energy Efficient Building Market Estimates and Forecasts, by End-use (2020-2032) (USD Billion)
10.5.2.7 Nigeria
10.5.2.7.1 Nigeria Energy Efficient Building Market Estimates and Forecasts, by Type (2020-2032) (USD Billion)
10.5.2.7.2 Nigeria Energy Efficient Building Market Estimates and Forecasts, by Material (2020-2032) (USD Billion)
10.5.2.7.3 Nigeria Energy Efficient Building Market Estimates and Forecasts, by End-use (2020-2032) (USD Billion)
10.5.2.8 Rest of Africa
10.5.2.8.1 Rest of Africa Energy Efficient Building Market Estimates and Forecasts, by Type (2020-2032) (USD Billion)
10.5.2.8.2 Rest of Africa Energy Efficient Building Market Estimates and Forecasts, by Material (2020-2032) (USD Billion)
10.5.2.8.3 Rest of Africa Energy Efficient Building Market Estimates and Forecasts, by End-use (2020-2032) (USD Billion)
10.6 Latin America
10.6.1 Trends Analysis
10.6.2 Latin America Energy Efficient Building Market Estimates and Forecasts, by Country (2020-2032) (USD Billion)
10.6.3 Latin America Energy Efficient Building Market Estimates and Forecasts, by Type (2020-2032) (USD Billion)
10.6.4 Latin America Energy Efficient Building Market Estimates and Forecasts, by Material (2020-2032) (USD Billion)
10.6.5 Latin America Energy Efficient Building Market Estimates and Forecasts, by End-use (2020-2032) (USD Billion)
10.6.6 Brazil
10.6.6.1 Brazil Energy Efficient Building Market Estimates and Forecasts, by Type (2020-2032) (USD Billion)
10.6.6.2 Brazil Energy Efficient Building Market Estimates and Forecasts, by Material (2020-2032) (USD Billion)
10.6.6.3 Brazil Energy Efficient Building Market Estimates and Forecasts, by End-use (2020-2032) (USD Billion)
10.6.7 Argentina
10.6.7.1 Argentina Energy Efficient Building Market Estimates and Forecasts, by Type (2020-2032) (USD Billion)
10.6.7.2 Argentina Energy Efficient Building Market Estimates and Forecasts, by Material (2020-2032) (USD Billion)
10.6.7.3 Argentina Energy Efficient Building Market Estimates and Forecasts, by End-use (2020-2032) (USD Billion)
10.6.8 Colombia
10.6.8.1 Colombia Energy Efficient Building Market Estimates and Forecasts, by Type (2020-2032) (USD Billion)
10.6.8.2 Colombia Energy Efficient Building Market Estimates and Forecasts, by Material (2020-2032) (USD Billion)
10.6.8.3 Colombia Energy Efficient Building Market Estimates and Forecasts, by End-use (2020-2032) (USD Billion)
10.6.9 Rest of Latin America
10.6.9.1 Rest of Latin America Energy Efficient Building Market Estimates and Forecasts, by Type (2020-2032) (USD Billion)
10.6.9.2 Rest of Latin America Energy Efficient Building Market Estimates and Forecasts, by Material (2020-2032) (USD Billion)
10.6.9.3 Rest of Latin America Energy Efficient Building Market Estimates and Forecasts, by End-use (2020-2032) (USD Billion)
11. Company Profiles
11.1 Saint-Gobain S.A.
11.1.1 Company Overview
11.1.2 Financial
11.1.3 Products/ Services Offered
11.1.4 SWOT Analysis
11.2 Owens Corning
11.2.1 Company Overview
11.2.2 Financial
11.2.3 Products/ Services Offered
11.2.4 SWOT Analysis
11.3 Johns Manville
11.3.1 Company Overview
11.3.2 Financial
11.3.3 Products/ Services Offered
11.3.4 SWOT Analysis
11.4 Kingspan Group
11.4.1 Company Overview
11.4.2 Financial
11.4.3 Products/ Services Offered
11.4.4 SWOT Analysis
11.5 Rockwool International A/S
11.5.1 Company Overview
11.5.2 Financial
11.5.3 Products/ Services Offered
11.5.4 SWOT Analysis
11.6 BASF SE
11.6.1 Company Overview
11.6.2 Financial
11.6.3 Products/ Services Offered
11.6.4 SWOT Analysis
11.7 Dow Inc.
11.7.1 Company Overview
11.7.2 Financial
11.7.3 Products/ Services Offered
11.7.4 SWOT Analysis
11.8 Honeywell
11.8.1 Company Overview
11.8.2 Financial
11.8.3 Products/ Services Offered
11.8.4 SWOT Analysis
11.9 Johnson Controls
11.9.1 Company Overview
11.9.2 Financial
11.9.3 Products/ Services Offered
11.9.4 SWOT Analysis
11.10 Schneider Electric
11.10.1 Company Overview
11.10.2 Financial
11.10.3 Products/ Services Offered
11.10.4 SWOT Analysis
12. Use Cases and Best Practices
13. Conclusion
An accurate research report requires proper strategizing as well as implementation. There are multiple factors involved in the completion of good and accurate research report and selecting the best methodology to compete the research is the toughest part. Since the research reports we provide play a crucial role in any company’s decision-making process, therefore we at SNS Insider always believe that we should choose the best method which gives us results closer to reality. This allows us to reach at a stage wherein we can provide our clients best and accurate investment to output ratio.
Each report that we prepare takes a timeframe of 350-400 business hours for production. Starting from the selection of titles through a couple of in-depth brain storming session to the final QC process before uploading our titles on our website we dedicate around 350 working hours. The titles are selected based on their current market cap and the foreseen CAGR and growth.
The 5 steps process:
Step 1: Secondary Research:
Secondary Research or Desk Research is as the name suggests is a research process wherein, we collect data through the readily available information. In this process we use various paid and unpaid databases which our team has access to and gather data through the same. This includes examining of listed companies’ annual reports, Journals, SEC filling etc. Apart from this our team has access to various associations across the globe across different industries. Lastly, we have exchange relationships with various university as well as individual libraries.
Step 2: Primary Research
When we talk about primary research, it is a type of study in which the researchers collect relevant data samples directly, rather than relying on previously collected data. This type of research is focused on gaining content specific facts that can be sued to solve specific problems. Since the collected data is fresh and first hand therefore it makes the study more accurate and genuine.
We at SNS Insider have divided Primary Research into 2 parts.
Part 1 wherein we interview the KOLs of major players as well as the upcoming ones across various geographic regions. This allows us to have their view over the market scenario and acts as an important tool to come closer to the accurate market numbers. As many as 45 paid and unpaid primary interviews are taken from both the demand and supply side of the industry to make sure we land at an accurate judgement and analysis of the market.
This step involves the triangulation of data wherein our team analyses the interview transcripts, online survey responses and observation of on filed participants. The below mentioned chart should give a better understanding of the part 1 of the primary interview.
Part 2: In this part of primary research the data collected via secondary research and the part 1 of the primary research is validated with the interviews from individual consultants and subject matter experts.
Consultants are those set of people who have at least 12 years of experience and expertise within the industry whereas Subject Matter Experts are those with at least 15 years of experience behind their back within the same space. The data with the help of two main processes i.e., FGDs (Focused Group Discussions) and IDs (Individual Discussions). This gives us a 3rd party nonbiased primary view of the market scenario making it a more dependable one while collation of the data pointers.
Step 3: Data Bank Validation
Once all the information is collected via primary and secondary sources, we run that information for data validation. At our intelligence centre our research heads track a lot of information related to the market which includes the quarterly reports, the daily stock prices, and other relevant information. Our data bank server gets updated every fortnight and that is how the information which we collected using our primary and secondary information is revalidated in real time.
Step 4: QA/QC Process
After all the data collection and validation our team does a final level of quality check and quality assurance to get rid of any unwanted or undesired mistakes. This might include but not limited to getting rid of the any typos, duplication of numbers or missing of any important information. The people involved in this process include technical content writers, research heads and graphics people. Once this process is completed the title gets uploader on our platform for our clients to read it.
Step 5: Final QC/QA Process:
This is the last process and comes when the client has ordered the study. In this process a final QA/QC is done before the study is emailed to the client. Since we believe in giving our clients a good experience of our research studies, therefore, to make sure that we do not lack at our end in any way humanly possible we do a final round of quality check and then dispatch the study to the client.
Key Segments:
By Type
HVAC
Lighting
Building Controls
Water Efficiency
Water Heating
Building Envelope
Others
By Material
Glass Wool
Mineral Wool
Expanded Polystyrene (EPS)
Extruded Polystyrene (XPS)
Cellulose
Polyisocyanurate (PIR)
Polyurethane (PUR)
Others
By End-use
Residential
Commercial
Industrial
Request for Segment Customization as per your Business Requirement: Segment Customization Request
Regional Coverage:
North America
US
Canada
Mexico
Europe
Eastern Europe
Poland
Romania
Hungary
Turkey
Rest of Eastern Europe
Western Europe
Germany
France
UK
Italy
Spain
Netherlands
Switzerland
Austria
Rest of Western Europe
Asia Pacific
China
India
Japan
South Korea
Vietnam
Singapore
Australia
Rest of Asia Pacific
Middle East & Africa
Middle East
UAE
Egypt
Saudi Arabia
Qatar
Rest of Middle East
Africa
Nigeria
South Africa
Rest of Africa
Latin America
Brazil
Argentina
Colombia
Rest of Latin America
Request for Country Level Research Report: Country Level Customization Request
Available Customization
With the given market data, SNS Insider offers customization as per the company’s specific needs. The following customization options are available for the report:
Product Analysis
Criss-Cross segment analysis (e.g. Product X Application)
Product Matrix which gives a detailed comparison of product portfolio of each company
Geographic Analysis
Additional countries in any of the regions
Company Information
Detailed analysis and profiling of additional market players (Up to five)
The Insulating Glass Window Market Size was valued at USD 12.5 Billion in 2023 and is expected to reach USD 22.7 Billion by 2032 and grow at a CAGR of 6.9% over the forecast period 2024-2032.
The Calcium Hypochlorite Market was valued at USD 780.3 million in 2023 and is expected to reach USD 2006.2 million by 2032, at a CAGR of 11.1% from 2024-2032.
The Food Grade Lubricants Market size was valued at USD 3.90 Billion in 2023 and is expected to reach USD 7.48 Billion by 2032 and grow at a CAGR of 7.67% over the forecast period of 2024-2032
Green Building Materials Market was USD 371.25 billion in 2023 and is expected to Reach USD 1020.53 billion by 2032, growing at a CAGR of 11.89% by 2024-2032.
The Isoparaffin Solvents Market Size was USD 870 Million in 2023 and will Reach to USD 1185.7 Million by 2032 and grow at a CAGR of 3.5% by of 2024-2032.
The Cellulosic Fire Protection Intumescent Coatings Market size was USD 599 Bn in 2023 & will reach $823.5 Bn by 2032 with a CAGR of 3.6% by 2024 to 2032.
Hi! Click one of our member below to chat on Phone