image

Energy as a Service Market Report Scope & Overview:
Energy as a Service (EaaS) Market Revenue Analysis

Get More Information on Energy as a Service Market - Request Sample Report

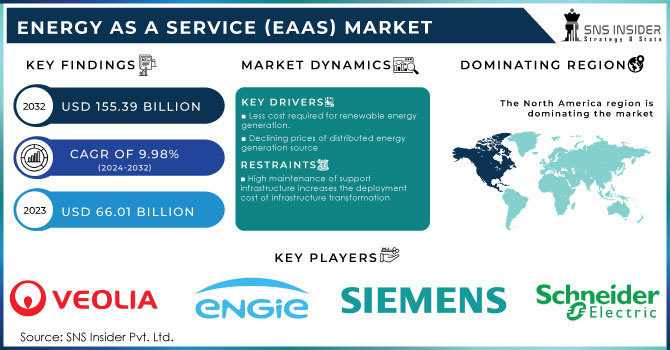
The Energy as a Service (EaaS) Market size was valued at 66.01 USD billion in 2023 and is expected to grow to 155.39 USD billion by 2032 and grow at a CAGR of 9.98% over the forecast period of 2024-2032.

Energy as a service (EaaS) is a type of service provider that offers customers to access energy and management services without any associated upfront costs through a contract with the organization. As a Software as a Service model, the consumer only pays for ongoing services without adding equipment and infrastructure charges. According to the customer’s requirement, these services are specifically customized, whether to reduce energy usage, be more sustainable or improve their bottom line.

Using EaaS it helps to reduce the burden of capital and performance on the client and also practices the sustainability. Energy as a service provides various types of services which include Energy Supply Services, Operational and Maintenance Services, Energy Efficiency and Optimization Services, and Others. Energy as a service is a form of renewable energy. This type of service is environment-friendly, and energy-efficient, and incurred a lower cost. 

The main advantage of this service is the flexibility of choice regarding ownership and pricing according to the customer’s needs. According to the different power requirements of the customers, operators can customize the energy generation.

Modern energy as a service is important for the well-being of humans as well as the economic development of the country.  Access to modern energy is essential for the provision of clean water, sanitation, and healthcare and for the provision of reliable and efficient heating, cooking, food, transport, lighting, and telecommunication services

Market Dynamics

Drivers

  • Less cost required for renewable energy generation.

  • Increasing utilization of energy across the globe

  • Declining prices of distributed energy generation source

  • Increasing demand for reducing energy costs from consumers

  • Rise in smart grid installation

Restrain

  • High maintenance of support infrastructure increases the deployment cost of infrastructure transformation

  • High capital investment

The energy as a service model is based on real-time information and analysis of data about the consumption of energy by the consumer as well as electricity market conditions which require high maintenance of support infrastructure which increases the cost of deployment of infrastructure transformation which increases the investment with hindering the market growth during the forecast period.

Opportunities

  • Increasing government investments in providing renewable sources

  • Growing government initiatives to curb carbon footprint management

  • Increasing utilization of energy-efficient technologies

  • Adoption of EaaS model over traditional model by key players

Challenges

  • Uncertainty about agreement structure.

Impact of COVID-19

The COVID-19 pandemic had a severe negative impact on the energy as a service market. The industries which were totally dependent on renewable energy sources for their operation were shut down completely or forced to function partially which causes decreases sales and revenue of their market. Because of this, there was a decline in the growth of energy as a service market by reducing the demand for renewable energy.  In the post-COVID era, the energy-as-a-service model grow in importance to be a part of the smart energy community of its ability to reduce energy costs.

The energy investments in the initial stages of the pandemic have reduced significantly. Companies were already struggling to keep up with fixed costs and trying to survive the impact of COVID-19, any commitment to such huge capital investment is either put off, canceled, or delayed. Thus, the impact on the EaaS market was high in 2020. However, in 2021, annual global energy investment is set to rise bringing the total volume of investment back to pre-crisis levels.

Impact of Russia-Ukraine War:

The war between Russia and Ukraine in 2022 had a devastating impact on Ukraine's energy sector. The Russian attack caused a collapse in the industry, leading to a ripple effect that has been felt across the globe. The consequences of this conflict have been far-reaching, causing price volatility, supply shortages, security issues, and economic uncertainty. The International Energy Agency (IEA) has described this as the first truly global energy crisis, with impacts that will be felt for years to come. The effects of energy supply disruptions are cascading across everything from food prices to electricity to consumer sentiment.

Immediately following the invasion, energy prices skyrocketed worldwide, with a 20% increase for five months straight from February 28th to August 3rd. The surge in energy costs induced by the war in Ukraine is significantly hitting European firms' profits, increasing business risk, and even jeopardizing entire production sectors. This has put these firms at a competitive disadvantage compared to countries with lower energy costs. All these factors impacted the energy as a service market negatively.

Market segmentation

By Service Type

  • Energy Supply Services

  • Operational and Maintenance Services

  • Energy Efficiency and Optimization Services

  • Others

By End Users

  • Commercial

  • Industrial

Regional Analysis

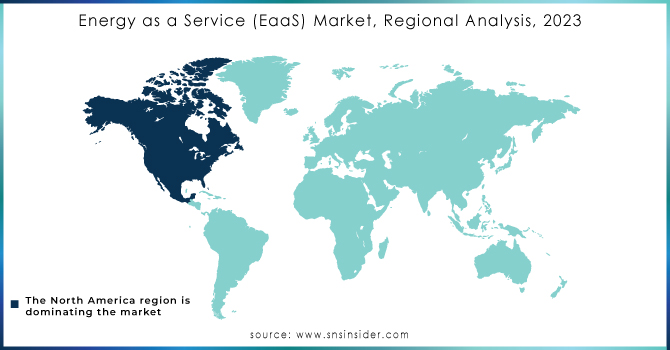
By region, The North America region dominated the market with the largest market share in 2022 and is estimated to show lucrative growth in the future. The rising demand for renewable energy increases the use of energy as a service in this region which propel the market significantly.  Increasing demand from smart building vendors to cut down the cost of electricity generation and increase customer satisfaction, energy as a service is used. The government of this region is also investing in the consumption-based energy model which further drives the market.

The electrical transmission infrastructure of this region is unprepared for modern threats and natural hazards. But, EaaS would provide flexibility to use electricity without affecting modern threats and natural hazards. In this region, there is also rapid implementation of the distributed energy system which propels the market significantly.

Asia Pacific is expected to show significant growth with the largest growth rate during the forecast period. Nowadays due to the increasing deterioration of environmental conditions shifting the concentration of people towards using renewable energy. The presence of key players and a large customer base in this region would help to drive the market in the future.
Energy-as-a-Service-EaaS-Market-Regional-Analysis-2023

Get Customized Report as per your Business Requirement - Request For Customized Report

REGIONAL COVERAGE:

  • North America

    • USA

    • Canada

    • Mexico

  • Europe

    • Germany

    • UK

    • France

    • Italy

    • Spain

    • The Netherlands

    • Rest of Europe

  • Asia-Pacific

    • Japan

    • south Korea

    • China

    • India

    • Australia

    • Rest of Asia-Pacific

  • The Middle East & Africa

    • Israel

    • UAE

    • South Africa

    • Rest of the Middle East & Africa

  • Latin America

    • Brazil

    • Argentina

    • Rest of Latin America

Key Players

The major players are Schneider Electric, Siemens, Engie, Honeywell International Inc., Veolia, EDF, Johnson ControlsBernhard, General Electric, Entegrity, Enel SpA, Ørsted A/S, NORESCO, LLC, Centrica plc, Wendel and other key players will be included in the final report.

Competitive Analysis:

  • Schneider Electric, a global leader in energy management and automation, has recently launched the EVlink Home Charger, a revolutionary product that makes at-home charging easier and more cost-effective. This new design incorporates anti-tripping functionality through its optional peak controller, allowing homeowners to run multiple devices on their home power system while charging their car simultaneously without any power supply failure.

Schneider Electric's EVlink range has recently welcomed the latest addition to its family - the charger. This launch couldn't have come at a better time, as the electric vehicle market has witnessed a remarkable surge in sales. In fact, 2022 has seen a 67% increase in electric vehicle sales compared to 2021, as Australian homeowners switch to electric vehicles to reduce carbon emissions.

Energy as a Service Market Report Scope:

Report Attributes Details
Market Size in 2023  US$ 66.01 Bn
Market Size by 2032  US$ 155.39 Bn
CAGR   CAGR of 9.98% From 2024 to 2032
Base Year  2023
Forecast Period  2024-2032
Historical Data  2020-2022
Report Scope & Coverage Market Size, Segments Analysis, Competitive  Landscape, Regional Analysis, DROC & SWOT Analysis, Forecast Outlook
Key Segments • By Service Type (Energy Supply Services, Operational and Maintenance Services, Energy Efficiency and Optimization Services, and Others)
• By End User (Commercial, Industrial)
Regional Analysis/Coverage North America (USA, Canada, Mexico), Europe
(Germany, UK, France, Italy, Spain, Netherlands,
Rest of Europe), Asia-Pacific (Japan, South Korea,
China, India, Australia, Rest of Asia-Pacific), The
Middle East & Africa (Israel, UAE, South Africa,
Rest of Middle East & Africa), Latin America (Brazil, Argentina, Rest of Latin America)
Company Profiles Schneider Electric; Siemens; Engie; Honeywell International Inc.; Veolia; EDF; Johnson Controls; Bernhard; General Electric; Entegrity; Enel SpA; Ørsted A/S; NORESCO, LLC; Centrica plc; Wendel
Key Drivers • Less cost required for renewable power generation.
• Increasing utilization of energy across the globe
Market Opportunities • Increasing government investments in providing renewable sources
• Growing government initiatives to curb carbon footprint


Frequently Asked Questions

The expected CAGR of the global Energy as a Service Market during the forecast period is 9.98%.

The market size of the Energy as a Service Market is USD 66.01 billion in 2023.

The major key players are Schneider Electric; Siemens; Engie; Honeywell International Inc.; Veolia; EDF; Johnson Controls; Bernhard; General Electric; Entegrity; Enel SpA; Ørsted A/S; NORESCO, LLC; Centrica plc; Wendel

North America region dominated the Renewable Energy Market.

The high deployment costs of transforming the current utility infrastructure and High capital investment are the restraining factors of the Energy as a Service Market.

Table of Contents

1. Introduction
1.1 Market Definition
1.2 Scope
1.3 Research Assumptions

2. Research Methodology

3. Market Dynamics
3.1 Drivers
3.2 Restraints
3.3 Opportunities
3.4 Challenges

4. Impact Analysis
4.1 COVID-19 Impact Analysis
4.2 Impact of Ukraine- Russia War

5. Value Chain Analysis

6. Porter’s 5 forces model

7. PEST Analysis

8. Energy as a Service Market Segmentation, By Service Type
8.1    Energy Supply Services
8.2    Operational and Maintenance Service
8.3    Energy Efficiency and Optimization Service
8.4    Others

9. Energy as a Service Market Segmentation, By End-users
9.1 Commercial
9.2 Industrial

10. Regional Analysis
10.1 Introduction
10.2 North America
10.2.1 North America Energy as a Service Market by Country
10.2.2North America Energy as a Service Market by Service Type
10.2.3 North America Energy as a Service Market by End-users
10.2.4 USA
10.2.4.1 USA Energy as a Service Market by Service Type
10.2.4.2 USA Energy as a Service Market by End-users
10.2.5 Canada
10.2.5.1 Canada Energy as a Service Market by Service Type
10.2.5.2 Canada Energy as a Service Market by End-users
10.2.6 Mexico
10.2.6.1 Mexico Energy as a Service Market by Service Type
10.2.6.2 Mexico Energy as a Service Market by End-users
10.3 Europe
10.3.1 Europe Energy as a Service Market by Country
1.3.3.2 Europe Energy as a Service Market by Service Type
10.3.3 Europe Energy as a Service Market by End-users
10.3.4Germany
10.3.4.1 Germany Energy as a Service Market by Service Type
10.3.4.2 Germany Energy as a Service Market by End-users
10.3.5 UK
10.3.5.1 UK Energy as a Service Market by Service Type
10.3.5.2 UK Energy as a Service Market by End-users
10.3.6 France
10.3.6.1 France Energy as a Service Market by Service Type
10.3.6.2 France Energy as a Service Market by End-users
10.3.7 Italy
10.3.7.1 Italy Energy as a Service Market by Service Type
10.3.7.2 Italy Energy as a Service Market by End-users
10.3.8 Spain
10.3.8.1 Spain Energy as a Service Market by Service Type
10.3.8.2 Spain Energy as a Service Market by End-users
10.3.9 The Netherlands
10.3.9.1 Netherlands Energy as a Service Market by Service Type
10.3.9.2 Netherlands Energy as a Service Market by End-users
10.3.10 Rest of Europe
10.3.10.1 Rest of Europe Energy as a Service Market by Service Type
10.3.10.2 Rest of Europe Energy as a Service Market by End-users
10.4 Asia-Pacific
10.4.1 Asia Pacific Energy as a Service Market by Country
10.4.2Asia Pacific Energy as a Service Market by Service Type
10.4.3 Asia Pacific Energy as a Service Market by End-users
10.4.4 Japan
10.4.4.1 Japan Energy as a Service Market by Service Type
10.4.4. 2Japan Energy as a Service Market by End-users
10.4.5. South Korea
10.4.5.1 South Korea Energy as a Service Market by Service Type
10.4.5.2. South Korea Energy as a Service Market by End-users
10.4.6 China
10.4.6.1 China Energy as a Service Market by Service Type
10.4.6.2. China Energy as a Service Market by End-users
10.4.7 India
10.4.7.1 India Energy as a Service Market by Service Type
10.4.7.2. India Energy as a Service Market by End-users
10.4.8 Australia
10.4.8.1 Australia Energy as a Service Market by Service Type
10.4.8.2. Australia Energy as a Service Market by End-users
10.4.9 Rest of Asia-Pacific
10.4.9.1 APAC Energy as a Service Market by Service Type
10.4.9.2. APAC Energy as a Service Market by End-users
10.5 The Middle East & Africa
10.5.1 The Middle East & Africa Energy as a Service Market by Country
10.5.2 The Middle East & Africa Energy as a Service Market by Service Type
10.5.3The Middle East & Africa Energy as a Service Market by End-users
10.5.4 Israel
10.5.7.1 Israel Energy as a Service Market by Service Type
10.5.7.2 Israel Energy as a Service Market by End-users
10.5.5 UAE
10.5.5.1 UAE Energy as a Service Market by Service Type
10.5.5.2 UAE Energy as a Service Market by End-users
10.5.6 South Africa
10.5.6.1 South Africa Energy as a Service Market by Service Type
10.5.6.2 South Africa Energy as a Service Market by End-users
10.5.7 Rest of Middle East & Africa
10.5.7.1 Rest of Middle East & Asia Energy as a Service Market by Service Type
10.5.7.2 Rest of Middle East & Asia Energy as a Service Market by End-users
10.6 Latin America
13.6.1  Latin America Energy as a Service Market by Country
10.6.2. Latin America Energy as a Service Market by Service Type
10.6.3 Latin America Energy as a Service Market by End-users
10.6.4 Brazil
10.6.4.1 Brazil Energy as a Service Market by Service Type
10.6.4.2 Brazil Energy as a Service Market by End-users
10.6.5 Argentina
10.6.5.1 Argentina Energy as a Service Market by Service Type
10.6.5.2 Argentina Energy as a Service Market by End-users
10.6.6Rest of Latin America
10.6.6.1 Rest of Latin America Energy as a Service Market by Service Type
10.6.6.2 Rest of Latin America Energy as a Service Market by End-users

11. Company Profile
11.1 Schneider Electric
11.1.1 Market Overview
11.1.2 Financials
11.1.3 Product/Services/Offerings
11.1.4 SWOT Analysis
11.1.5 The SNS View
11.2 Siemens
11.2.1 Market Overview
11.2.2 Financials
11.2.3 Product/Services/Offerings
11.2.4 SWOT Analysis
11.2.5 The SNS View
11.3 Honeywell International Inc.
11.3.1 Market Overview
11.3.2 Financials
11.3.3 Product/Services/Offerings
11.3.4 SWOT Analysis
11.3.5 The SNS View
11.4 Veolia
11.4.1 Market Overview
11.4.2 Financials
11.4.3 Product/Services/Offerings
11.4.4 SWOT Analysis
11.4.5 The SNS View
11.5 EDF
11.5.1 Market Overview
11.5.2 Financials
11.5.3 Product/Services/Offerings
11.5.4 SWOT Analysis
11.5.5 The SNS View
11.6 Johnson Controls
11.6.1 Market Overview
11.6.2 Financials
11.6.3 Product/Services/Offerings
11.6.4 SWOT Analysis
11.6.5 The SNS View
11.7 Bernhard
11.7.1 Market Overview
11.7.2 Financials
11.7.3 Product/Services/Offerings
11.7.4 SWOT Analysis
11.7.5 The SNS View
11.8 General Electric
11.8.1 Market Overview
11.8.2 Financials
11.8.3 Product/Services/Offerings
11.8.4 SWOT Analysis
11.8.5 The SNS View
11.9 Entegrity
11.9.1 Market Overview
11.9.2 Financials
11.9.3 Product/Services/Offerings
11.9.4 SWOT Analysis
11.9.5 The SNS View
11.10 Enel SpA
11.10.1 Market Overview
11.10.2 Financials
11.10.3 Product/Services/Offerings
11.10.4 SWOT Analysis
11.10.5 The SNS View
11.11 Ørsted A/S
11.11.1 Market Overview
11.11.2 Financials
11.11.3 Product/Services/Offerings
11.11.4 SWOT Analysis
11.11.5 The SNS View
11.12 NORESCO, LLC
11.12.1 Market Overview
11.12.2 Financials
11.12.3 Product/Services/Offerings
11.12.4 SWOT Analysis
11.12.5 The SNS View
11.13 Centrica plc
11.13.1 Market Overview
11.13.2 Financials
11.13.3 Product/Services/Offerings
11.13.4 SWOT Analysis
11.13.5 The SNS View
11.14 Wendel
11.14.1 Market Overview
11.14.2 Financials
11.14.3 Product/Services/Offerings
11.14.4 SWOT Analysis
11.14.5 The SNS View

12. Competitive Landscape
12.1 Competitive Benchmarking
12.2 Market Share Analysis
12.3 Recent Developments

13. USE Cases And Best Practices

14. Conclusion
 

An accurate research report requires proper strategizing as well as implementation. There are multiple factors involved in the completion of good and accurate research report and selecting the best methodology to compete the research is the toughest part. Since the research reports we provide play a crucial role in any company’s decision-making process, therefore we at SNS Insider always believe that we should choose the best method which gives us results closer to reality. This allows us to reach at a stage wherein we can provide our clients best and accurate investment to output ratio.

Each report that we prepare takes a timeframe of 350-400 business hours for production. Starting from the selection of titles through a couple of in-depth brain storming session to the final QC process before uploading our titles on our website we dedicate around 350 working hours. The titles are selected based on their current market cap and the foreseen CAGR and growth.


The 5 steps process:

Step 1: Secondary Research:

Secondary Research or Desk Research is as the name suggests is a research process wherein, we collect data through the readily available information. In this process we use various paid and unpaid databases which our team has access to and gather data through the same. This includes examining of listed companies’ annual reports, Journals, SEC filling etc. Apart from this our team has access to various associations across the globe across different industries. Lastly, we have exchange relationships with various university as well as individual libraries.

Secondary Research

Step 2: Primary Research

When we talk about primary research, it is a type of study in which the researchers collect relevant data samples directly, rather than relying on previously collected data.  This type of research is focused on gaining content specific facts that can be sued to solve specific problems. Since the collected data is fresh and first hand therefore it makes the study more accurate and genuine.

We at SNS Insider have divided Primary Research into 2 parts.

Part 1 wherein we interview the KOLs of major players as well as the upcoming ones across various geographic regions. This allows us to have their view over the market scenario and acts as an important tool to come closer to the accurate market numbers. As many as 45 paid and unpaid primary interviews are taken from both the demand and supply side of the industry to make sure we land at an accurate judgement and analysis of the market.

This step involves the triangulation of data wherein our team analyses the interview transcripts, online survey responses and observation of on filed participants. The below mentioned chart should give a better understanding of the part 1 of the primary interview.

Primary Research

Part 2: In this part of primary research the data collected via secondary research and the part 1 of the primary research is validated with the interviews from individual consultants and subject matter experts.

Consultants are those set of people who have at least 12 years of experience and expertise within the industry whereas Subject Matter Experts are those with at least 15 years of experience behind their back within the same space. The data with the help of two main processes i.e., FGDs (Focused Group Discussions) and IDs (Individual Discussions). This gives us a 3rd party nonbiased primary view of the market scenario making it a more dependable one while collation of the data pointers.

Step 3: Data Bank Validation

Once all the information is collected via primary and secondary sources, we run that information for data validation. At our intelligence centre our research heads track a lot of information related to the market which includes the quarterly reports, the daily stock prices, and other relevant information. Our data bank server gets updated every fortnight and that is how the information which we collected using our primary and secondary information is revalidated in real time.

Data Bank Validation

Step 4: QA/QC Process

After all the data collection and validation our team does a final level of quality check and quality assurance to get rid of any unwanted or undesired mistakes. This might include but not limited to getting rid of the any typos, duplication of numbers or missing of any important information. The people involved in this process include technical content writers, research heads and graphics people. Once this process is completed the title gets uploader on our platform for our clients to read it.

Step 5: Final QC/QA Process:

This is the last process and comes when the client has ordered the study. In this process a final QA/QC is done before the study is emailed to the client. Since we believe in giving our clients a good experience of our research studies, therefore, to make sure that we do not lack at our end in any way humanly possible we do a final round of quality check and then dispatch the study to the client.


  •            5000 (33% Discount)


  •            8950 (40% Discount)


  •            3050 (23% Discount)

Start a Conversation

Hi! Click one of our member below to chat on Phone