The Emission Monitoring Systems Market Size was valued at USD 3.35 Billion in 2023 and is expected to reach USD 7.56 Billion by 2032 and grow at a CAGR of 9.5% over the forecast period 2024-2032. The Market report includes key data points such as regulatory compliance adoption rates, industry-wise emissions reduction percentages (CO₂, NOx, SO₂), and global investment trends in emissions monitoring technology. It also covers the penetration rate of AI and IoT-based analytics, the shift to cloud-based Data Acquisition and Handling Systems (DAHS), and government subsidies supporting adoption. Additionally, carbon credit market trends, new product launches, patent filings, and sector-specific demand projections (e.g., power generation, oil & gas) provide deeper insights into market growth and technological advancements.
Get more information on Emission Monitoring System (EMS) Market - Request Sample Report
Stringent Environmental Regulations and Sustainability Initiatives Drive the Growth of the Emission Monitoring Systems Market
Governments worldwide are enforcing stricter emission control regulations to combat air pollution and climate change, driving demand for emission monitoring systems. Regulatory bodies such as the EPA (U.S.), the European Environment Agency, and China's Ministry of Ecology and Environment have mandated continuous emissions monitoring across industries like power generation, oil & gas, and manufacturing. Additionally, corporate sustainability goals and carbon neutrality commitments are accelerating investments in monitoring solutions. Industries are increasingly adopting Continuous Emission Monitoring Systems (CEMS) and Predictive Emission Monitoring Systems (PEMS) to ensure compliance, reducing fines and operational risks while improving environmental performance and sustainability.
Restraint:
High Initial Investment and Maintenance Costs Restrain the Growth of the Emission Monitoring Systems Market
Despite growing demand, the high capital expenditure required for installing emission monitoring systems remains a significant barrier to market growth. The cost of advanced Continuous Emission Monitoring Systems (CEMS), including sensors, analyzers, and data acquisition systems, can be substantial, especially for small and medium-sized enterprises (SMEs). Additionally, ongoing maintenance, calibration, and compliance with evolving regulations increase operational expenses. Companies must allocate significant budgets for system upgrades and staff training. These financial constraints, particularly in developing economies, slow down the widespread adoption of emission monitoring systems, limiting market expansion despite regulatory pressure.
Opportunities:
Advancements in AI and IoT-Based Emission Monitoring Solutions Create Growth Opportunities in the Market
The integration of Artificial Intelligence (AI) and the Internet of Things (IoT) is transforming emission monitoring by enhancing data accuracy, predictive analytics, and real-time compliance tracking. AI-driven algorithms analyze emissions data, identify trends, and predict potential compliance breaches, allowing industries to take proactive measures. IoT-enabled sensors facilitate remote monitoring and automation, reducing manual intervention and operational costs. These technologies also support cloud-based Data Acquisition and Handling Systems (DAHS), enabling seamless regulatory reporting. As digital transformation accelerates, industries are increasingly investing in smart emission monitoring solutions, presenting significant growth opportunities for market players offering AI and IoT-driven systems.
Challenge:
Data Security Concerns and Cyber Threats Pose Challenges to the Emission Monitoring Systems Market
With the increasing adoption of cloud-based and IoT-enabled emission monitoring systems, data security and cyber threats have emerged as critical challenges. These systems collect and transmit vast amounts of sensitive environmental data, making them vulnerable to cyberattacks and unauthorized access. A security breach could compromise compliance reports, leading to regulatory penalties and reputational damage for industries. Ensuring end-to-end encryption, robust cybersecurity protocols, and regular system updates is essential for mitigating risks. However, many companies, particularly in cost-sensitive industries, struggle to invest in advanced cybersecurity measures, creating vulnerabilities that can hinder the adoption of digital emission monitoring solutions.
By Type
The Continuous Emission Monitoring System (CEMS) segment dominated the Emission Monitoring Systems Market in 2023, accounting for 77% of the revenue share. This dominance is attributed to the widespread adoption of CEMS across industries such as power generation, oil & gas, and manufacturing, driven by stringent environmental regulations and the need for real-time emissions data. Several companies have launched advanced CEMS products, integrating cutting-edge sensor technologies for improved accuracy and efficiency.
For instance, some companies have introduced enhanced multi-pollutant monitoring systems that can simultaneously measure CO₂, NOx, SO₂, and particulate matter, providing comprehensive compliance data.
The Predictive Emission Monitoring System (PEMS) segment is projected to grow at the highest CAGR of 10.9% during the forecast period. PEMS offers the advantage of predicting emissions based on process data, making it an attractive option for industries looking to optimize their operations and ensure continuous compliance with fluctuating emissions regulations. Recent product innovations in PEMS include the integration of AI and machine learning, allowing for better predictive accuracy and real-time adjustments.
By Component
The Hardware segment led the Emission Monitoring Systems Market in 2023, commanding a dominant 54% revenue share. This is due to the essential role hardware plays in the efficiency and accuracy of emission monitoring systems, including components like sensors, analyzers, and data acquisition units. As industries prioritize compliance with increasingly stringent environmental regulations, the demand for high-performance hardware, capable of continuously monitoring pollutants such as CO₂, SO₂, and NOx, has surged.
The Services segment is projected to grow at the highest CAGR of 10.75% during the forecasted period. This growth is driven by the increasing demand for support services such as installation, deployment, training, and maintenance of emission monitoring systems. As industries adopt more advanced monitoring solutions, the need for technical expertise in setup and ongoing system optimization has risen. Recent product and service development trends include service packages that offer end-to-end support, from installation to real-time troubleshooting and system upgrades.
By End-Use
The Oil & Gas segment held the largest revenue share of 26% in the Emission Monitoring Systems Market in 2023. The sector is highly regulated due to its significant environmental impact, particularly in terms of CO₂ and methane emissions. As environmental standards become more stringent, companies are increasingly adopting advanced emission monitoring systems to comply with regulations and reduce their carbon footprint. Innovations in the Oil & Gas segment include enhanced Continuous Emission Monitoring Systems (CEMS) designed to monitor a wider range of pollutants in real-time, as well as predictive technologies that enable early detection of potential compliance issues.
The Power Generation segment is expected to grow at the highest CAGR of 12.42% during the forecast period. This growth is driven by the increasing global demand for clean energy and stricter regulations aimed at reducing greenhouse gas emissions from power plants. The adoption of advanced emission monitoring solutions, such as Predictive Emission Monitoring Systems (PEMS) and smart sensors, enables power generation companies to optimize plant performance while ensuring compliance with emission standards
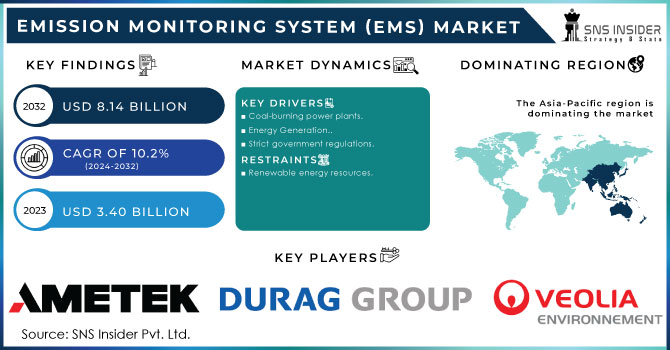
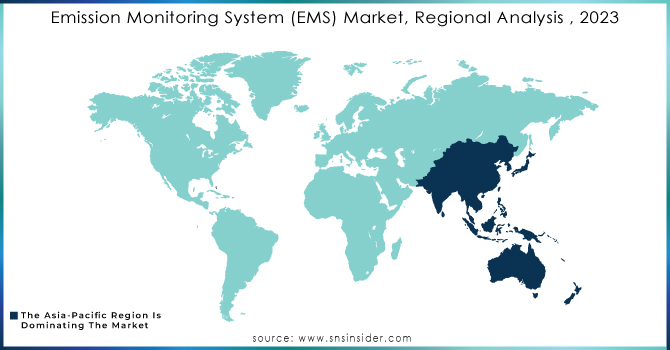
North America led the Emission Monitoring Systems Market in 2023, holding a dominant market share of approximately 35%. This dominance can be attributed to stringent environmental regulations and policies in countries like the United States and Canada. Regulatory bodies such as the U.S. Environmental Protection Agency (EPA) and the Canadian Ministry of the Environment enforce strict emission standards, driving demand for emission monitoring systems across various industries, including power generation, oil & gas, and manufacturing.
The Asia Pacific region is the fastest-growing market for emission monitoring systems, with an estimated CAGR of 14.5% during the forecast period. This growth is primarily driven by rapid industrialization, urbanization, and increasing environmental awareness in countries like China, India, and Japan. With industries in these regions expanding rapidly, there is an increased focus on regulatory compliance and emissions reduction to combat severe air pollution and its impact on public health.
For example, China’s government has imposed stringent emissions standards on power plants and manufacturing sectors, pushing for the adoption of advanced emission monitoring technologies. Similarly, India’s rising energy demand and industrial growth have led to the implementation of cleaner technologies and monitoring systems to meet both domestic and international environmental standards.
Get Customized Report as per your Business Requirement - Request For Customized Report
Some of the major players in the Emission Monitoring Systems Market are:
ABB Ltd. (ABB CEMS, ABB ACF5000 Gas Analyzer)
AMETEK Inc (Ametek 9200 Series CEMS, Ametek ProLine PEMS)
Emerson Electric Company (Emerson Rosemount CT5100 CEMS, Emerson Gas Analyzer System)
General Electric Company (GE EPM CEMS, GE 1734 Gas Analyzer)
Enviro Technology Services Plc. (ET CEMS-2000, ET Gas Analyzer Series)
Horiba Ltd. (Horiba ENDA-5000 CEMS, Horiba PG-300 Gas Analyzer)
Fuji Electric Co., Ltd. (Fuji ZPA CEMS, Fuji Electric Gas Analyzer ZFK)
Rockwell Automation, Inc. (Rockwell CEMS Solutions, Rockwell SCADA for Emissions Monitoring)
Siemens AG (Siemens SIPROCESS GA700, Siemens ULTRAMAT 23 Gas Analyzer)
Thermo Fisher Scientific Inc. (Thermo Fisher 42iQ CEMS, Thermo Scientific EMS-10)
Parker Hannifin (Parker CEMS Analyzers, Parker Procal 2000 Gas Analyzer)
SICK (SICK MCS100E CEMS, SICK GMS800 Gas Analyzer)
CMC Solutions (CMC SmartCEMS, CMC Predictive CEMS)
Opsis (Opsis DOAS CEMS, Opsis LD500 Laser Gas Analyzer)
Ecotech (Ecotech Serinus CEMS, Ecotech Aurora 1000 Gas Analyzer)
In December 2024, ABB announced that its CEM-DAS became the first data acquisition and handling system to successfully pass the new international emissions monitoring standard test, EN 17255. This achievement enabled ABB to offer a complete package of continuous gas analysis and DAHS systems that are fully compliant with international standards.
In November 2023, AMETEK released its 2023 Sustainability Report, highlighting a 26% reduction in Scope 1 and 2 emissions intensity since 2019, progressing towards its target of a 40% reduction by 2035. The report also noted an 11% decrease in electricity intensity and a 10% reduction in total water withdrawal intensity over the same period.
| Report Attributes | Details |
|---|---|
| Market Size in 2023 | US$ 3.35 Billion |
| Market Size by 2032 | US$ 7.56 Billion |
| CAGR | CAGR of 9.5 % From 2024 to 2032 |
| Base Year | 2023 |
| Forecast Period | 2024-2032 |
| Historical Data | 2020-2022 |
| Report Scope & Coverage | Market Size, Segments Analysis, Competitive Landscape, Regional Analysis, DROC & SWOT Analysis, Forecast Outlook |
| Key Segments | • By Type (Continuous Emission Monitoring System (CEMS), Predictive Emission Monitoring System (PEMS)) • By Component (Hardware, Software, Services [Installation & Deployment, Training, Support & Maintenance]) • By End-Use (Oil & Gas, Metals & Mining, Power Generation, Chemical & Fertilizer, Pulp & Paper, Pharmaceutical, Others) |
| Regional Analysis/Coverage | North America (US, Canada, Mexico), Europe (Eastern Europe [Poland, Romania, Hungary, Turkey, Rest of Eastern Europe] Western Europe] Germany, France, UK, Italy, Spain, Netherlands, Switzerland, Austria, Rest of Western Europe]), Asia Pacific (China, India, Japan, South Korea, Vietnam, Singapore, Australia, Rest of Asia Pacific), Middle East & Africa (Middle East [UAE, Egypt, Saudi Arabia, Qatar, Rest of Middle East], Africa [Nigeria, South Africa, Rest of Africa], Latin America (Brazil, Argentina, Colombia, Rest of Latin America) |
| Company Profiles | ABB Ltd., Ametek, Inc., Emerson Electric Company, General Electric Company, Enviro Technology Services Plc., Horiba Ltd., Fuji Electric Co., Ltd., Rockwell Automation, Inc., Siemens AG, Thermo Fisher Scientific Inc., Parker Hannifin, SICK, CMC Solutions, Opsis, Ecotech |
Ans: The Emission Monitoring Systems Market is expected to grow at a CAGR of 9.5% during 2024-2032.
Ans: The Emission Monitoring Systems Market size was USD 3.35 billion in 2023 and is expected to Reach USD 7.56 billion by 2032.
Ans: The major growth factor of the Emission Monitoring Systems Market is the increasing stringency of environmental regulations and the rising need for industries to ensure compliance with emission standards.
Ans: Continuous Emission Monitoring System (CEMS) segment dominated the Emission Monitoring Systems Market.
Ans: North America dominated the Emission Monitoring Systems Market in 2023.
Table Of Contents
1. Introduction
1.1 Market Definition
1.2 Scope (Inclusion and Exclusions)
1.3 Research Assumptions
2. Executive Summary
2.1 Market Overview
2.2 Regional Synopsis
2.3 Competitive Summary
3. Research Methodology
3.1 Top-Down Approach
3.2 Bottom-up Approach
3.3. Data Validation
3.4 Primary Interviews
4. Market Dynamics Impact Analysis
4.1 Market Driving Factors Analysis
4.1.1 Drivers
4.1.2 Restraints
4.1.3 Opportunities
4.1.4 Challenges
4.2 PESTLE Analysis
4.3 Porter’s Five Forces Model
5. Statistical Insights and Trends Reporting
5.1 Emissions Reduction Statistics (2023)
5.2 Market Penetration by Industry
5.3 Product Launches and Innovation
5.4 Supply Chain Metrics
6. Competitive Landscape
6.1 List of Major Companies, By Region
6.2 Market Share Analysis, By Region
6.3 Product Benchmarking
6.3.1 Product specifications and features
6.3.2 Pricing
6.4 Strategic Initiatives
6.4.1 Marketing and promotional activities
6.4.2 Distribution and Supply Chain Strategies
6.4.3 Expansion plans and new product launches
6.4.4 Strategic partnerships and collaborations
6.5 Technological Advancements
6.6 Market Positioning and Branding
7. Emission Monitoring Systems Market Segmentation, By Type
7.1 Chapter Overview
7.2 Continuous Emission Monitoring System (CEMS)
7.2.1 Continuous Emission Monitoring System (CEMS) Market Trends Analysis (2020-2032)
7.2.2 Continuous Emission Monitoring System (CEMS) Market Size Estimates and Forecasts to 2032 (USD Billion)
7.3 Predictive Emission Monitoring System (PEMS)
7.3.1 Predictive Emission Monitoring System (PEMS) Market Trends Analysis (2020-2032)
7.3.2 Predictive Emission Monitoring System (PEMS) Market Size Estimates and Forecasts to 2032 (USD Billion)
8. Emission Monitoring Systems Market Segmentation, By Component
8.1 Chapter Overview
8.2 Hardware
8.2.1 Hardware Market Trends Analysis (2020-2032)
8.2.2 Hardware Market Size Estimates and Forecasts to 2032 (USD Billion)
8.3 Software
8.3.1 Software Market Trends Analysis (2020-2032)
8.3.2 Software Market Size Estimates and Forecasts to 2032 (USD Billion)
8.4 Services
8.4.1 Services Market Trends Analysis (2020-2032)
8.4.2 Services Market Size Estimates and Forecasts to 2032 (USD Billion)
8.4.3 Installation & Deployment
8.4.3.1 Installation & Deployment Market Trends Analysis (2020-2032)
8.4.3.2 Installation & Deployment Market Size Estimates and Forecasts to 2032 (USD Billion)
8.4.4 Training
8.4.4.1 Training Market Trends Analysis (2020-2032)
8.4.4.2 Training Market Size Estimates and Forecasts to 2032 (USD Billion)
8.4.5 Support & Maintenance
8.4.5.1 Support & Maintenance Market Trends Analysis (2020-2032)
8.4.5.2 Support & Maintenance Market Size Estimates and Forecasts to 2032 (USD Billion)
9. Emission Monitoring Systems Market Segmentation, By End-Use
9.1 Chapter Overview
9.2 Oil & Gas
9.2.1 Oil & Gas Market Trends Analysis (2020-2032)
9.2.2 Oil & Gas Market Size Estimates and Forecasts to 2032 (USD Billion)
9.3 Metals & Mining
9.3.1 Metals & Mining Market Trends Analysis (2020-2032)
9.3.2 Metals & Mining Market Size Estimates and Forecasts to 2032 (USD Billion)
9.4 Power Generation
9.4.1 Power Generation Market Trends Analysis (2020-2032)
9.4.2 Power Generation Market Size Estimates and Forecasts to 2032 (USD Billion)
9.5 Chemical & Fertilizer
9.5.1 Chemical & Fertilizer Market Trends Analysis (2020-2032)
9.5.2 Chemical & Fertilizer Market Size Estimates and Forecasts to 2032 (USD Billion)
9.6 Pulp & Paper
9.6.1 Pulp & Paper Market Trends Analysis (2020-2032)
9.6.2 Pulp & Paper Market Size Estimates and Forecasts to 2032 (USD Billion)
9.7 Pharmaceutical
9.7.1 Pharmaceutical Market Trends Analysis (2020-2032)
9.7.2 Pharmaceutical Market Size Estimates and Forecasts to 2032 (USD Billion)
9.8 Others
9.8.1 Others Market Trends Analysis (2020-2032)
9.8.2 Others Market Size Estimates and Forecasts to 2032 (USD Billion)
10. Regional Analysis
10.1 Chapter Overview
10.2 North America
10.2.1 Trends Analysis
10.2.2 North America Emission Monitoring Systems Market Estimates and Forecasts, by Country (2020-2032) (USD Billion)
10.2.3 North America Emission Monitoring Systems Market Estimates and Forecasts, By Type (2020-2032) (USD Billion)
10.2.4 North America Emission Monitoring Systems Market Estimates and Forecasts, By Component (2020-2032) (USD Billion)
10.2.5 North America Emission Monitoring Systems Market Estimates and Forecasts, By End-Use (2020-2032) (USD Billion)
10.2.6 USA
10.2.6.1 USA Emission Monitoring Systems Market Estimates and Forecasts, By Type (2020-2032) (USD Billion)
10.2.6.2 USA Emission Monitoring Systems Market Estimates and Forecasts, By Component (2020-2032) (USD Billion)
10.2.6.3 USA Emission Monitoring Systems Market Estimates and Forecasts, By End-Use (2020-2032) (USD Billion)
10.2.7 Canada
10.2.7.1 Canada Emission Monitoring Systems Market Estimates and Forecasts, By Type (2020-2032) (USD Billion)
10.2.7.2 Canada Emission Monitoring Systems Market Estimates and Forecasts, By Component (2020-2032) (USD Billion)
10.2.7.3 Canada Emission Monitoring Systems Market Estimates and Forecasts, By End-Use (2020-2032) (USD Billion)
10.2.8 Mexico
10.2.8.1 Mexico Emission Monitoring Systems Market Estimates and Forecasts, By Type (2020-2032) (USD Billion)
10.2.8.2 Mexico Emission Monitoring Systems Market Estimates and Forecasts, By Component (2020-2032) (USD Billion)
10.2.8.3 Mexico Emission Monitoring Systems Market Estimates and Forecasts, By End-Use (2020-2032) (USD Billion)
10.3 Europe
10.3.1 Eastern Europe
10.3.1.1 Trends Analysis
10.3.1.2 Eastern Europe Emission Monitoring Systems Market Estimates and Forecasts, by Country (2020-2032) (USD Billion)
10.3.1.3 Eastern Europe Emission Monitoring Systems Market Estimates and Forecasts, By Type (2020-2032) (USD Billion)
10.3.1.4 Eastern Europe Emission Monitoring Systems Market Estimates and Forecasts, By Component (2020-2032) (USD Billion)
10.3.1.5 Eastern Europe Emission Monitoring Systems Market Estimates and Forecasts, By End-Use (2020-2032) (USD Billion)
10.3.1.6 Poland
10.3.1.6.1 Poland Emission Monitoring Systems Market Estimates and Forecasts, By Type (2020-2032) (USD Billion)
10.3.1.6.2 Poland Emission Monitoring Systems Market Estimates and Forecasts, By Component (2020-2032) (USD Billion)
10.3.1.6.3 Poland Emission Monitoring Systems Market Estimates and Forecasts, By End-Use (2020-2032) (USD Billion)
10.3.1.7 Romania
10.3.1.7.1 Romania Emission Monitoring Systems Market Estimates and Forecasts, By Type (2020-2032) (USD Billion)
10.3.1.7.2 Romania Emission Monitoring Systems Market Estimates and Forecasts, By Component (2020-2032) (USD Billion)
10.3.1.7.3 Romania Emission Monitoring Systems Market Estimates and Forecasts, By End-Use (2020-2032) (USD Billion)
10.3.1.8 Hungary
10.3.1.8.1 Hungary Emission Monitoring Systems Market Estimates and Forecasts, By Type (2020-2032) (USD Billion)
10.3.1.8.2 Hungary Emission Monitoring Systems Market Estimates and Forecasts, By Component (2020-2032) (USD Billion)
10.3.1.8.3 Hungary Emission Monitoring Systems Market Estimates and Forecasts, By End-Use (2020-2032) (USD Billion)
10.3.1.9 Turkey
10.3.1.9.1 Turkey Emission Monitoring Systems Market Estimates and Forecasts, By Type (2020-2032) (USD Billion)
10.3.1.9.2 Turkey Emission Monitoring Systems Market Estimates and Forecasts, By Component (2020-2032) (USD Billion)
10.3.1.9.3 Turkey Emission Monitoring Systems Market Estimates and Forecasts, By End-Use (2020-2032) (USD Billion)
10.3.1.10 Rest of Eastern Europe
10.3.1.10.1 Rest of Eastern Europe Emission Monitoring Systems Market Estimates and Forecasts, By Type (2020-2032) (USD Billion)
10.3.1.10.2 Rest of Eastern Europe Emission Monitoring Systems Market Estimates and Forecasts, By Component (2020-2032) (USD Billion)
10.3.1.10.3 Rest of Eastern Europe Emission Monitoring Systems Market Estimates and Forecasts, By End-Use (2020-2032) (USD Billion)
10.3.2 Western Europe
10.3.2.1 Trends Analysis
10.3.2.2 Western Europe Emission Monitoring Systems Market Estimates and Forecasts, by Country (2020-2032) (USD Billion)
10.3.2.3 Western Europe Emission Monitoring Systems Market Estimates and Forecasts, By Type (2020-2032) (USD Billion)
10.3.2.4 Western Europe Emission Monitoring Systems Market Estimates and Forecasts, By Component (2020-2032) (USD Billion)
10.3.2.5 Western Europe Emission Monitoring Systems Market Estimates and Forecasts, By End-Use (2020-2032) (USD Billion)
10.3.2.6 Germany
10.3.2.6.1 Germany Emission Monitoring Systems Market Estimates and Forecasts, By Type (2020-2032) (USD Billion)
10.3.2.6.2 Germany Emission Monitoring Systems Market Estimates and Forecasts, By Component (2020-2032) (USD Billion)
10.3.2.6.3 Germany Emission Monitoring Systems Market Estimates and Forecasts, By End-Use (2020-2032) (USD Billion)
10.3.2.7 France
10.3.2.7.1 France Emission Monitoring Systems Market Estimates and Forecasts, By Type (2020-2032) (USD Billion)
10.3.2.7.2 France Emission Monitoring Systems Market Estimates and Forecasts, By Component (2020-2032) (USD Billion)
10.3.2.7.3 France Emission Monitoring Systems Market Estimates and Forecasts, By End-Use (2020-2032) (USD Billion)
10.3.2.8 UK
10.3.2.8.1 UK Emission Monitoring Systems Market Estimates and Forecasts, By Type (2020-2032) (USD Billion)
10.3.2.8.2 UK Emission Monitoring Systems Market Estimates and Forecasts, By Component (2020-2032) (USD Billion)
10.3.2.8.3 UK Emission Monitoring Systems Market Estimates and Forecasts, By End-Use (2020-2032) (USD Billion)
10.3.2.9 Italy
10.3.2.9.1 Italy Emission Monitoring Systems Market Estimates and Forecasts, By Type (2020-2032) (USD Billion)
10.3.2.9.2 Italy Emission Monitoring Systems Market Estimates and Forecasts, By Component (2020-2032) (USD Billion)
10.3.2.9.3 Italy Emission Monitoring Systems Market Estimates and Forecasts, By End-Use (2020-2032) (USD Billion)
10.3.2.10 Spain
10.3.2.10.1 Spain Emission Monitoring Systems Market Estimates and Forecasts, By Type (2020-2032) (USD Billion)
10.3.2.10.2 Spain Emission Monitoring Systems Market Estimates and Forecasts, By Component (2020-2032) (USD Billion)
10.3.2.10.3 Spain Emission Monitoring Systems Market Estimates and Forecasts, By End-Use (2020-2032) (USD Billion)
10.3.2.11 Netherlands
10.3.2.11.1 Netherlands Emission Monitoring Systems Market Estimates and Forecasts, By Type (2020-2032) (USD Billion)
10.3.2.11.2 Netherlands Emission Monitoring Systems Market Estimates and Forecasts, By Component (2020-2032) (USD Billion)
10.3.2.11.3 Netherlands Emission Monitoring Systems Market Estimates and Forecasts, By End-Use (2020-2032) (USD Billion)
10.3.2.12 Switzerland
10.3.2.12.1 Switzerland Emission Monitoring Systems Market Estimates and Forecasts, By Type (2020-2032) (USD Billion)
10.3.2.12.2 Switzerland Emission Monitoring Systems Market Estimates and Forecasts, By Component (2020-2032) (USD Billion)
10.3.2.12.3 Switzerland Emission Monitoring Systems Market Estimates and Forecasts, By End-Use (2020-2032) (USD Billion)
10.3.2.13 Austria
10.3.2.13.1 Austria Emission Monitoring Systems Market Estimates and Forecasts, By Type (2020-2032) (USD Billion)
10.3.2.13.2 Austria Emission Monitoring Systems Market Estimates and Forecasts, By Component (2020-2032) (USD Billion)
10.3.2.13.3 Austria Emission Monitoring Systems Market Estimates and Forecasts, By End-Use (2020-2032) (USD Billion)
10.3.2.14 Rest of Western Europe
10.3.2.14.1 Rest of Western Europe Emission Monitoring Systems Market Estimates and Forecasts, By Type (2020-2032) (USD Billion)
10.3.2.14.2 Rest of Western Europe Emission Monitoring Systems Market Estimates and Forecasts, By Component (2020-2032) (USD Billion)
10.3.2.14.3 Rest of Western Europe Emission Monitoring Systems Market Estimates and Forecasts, By End-Use (2020-2032) (USD Billion)
10.4 Asia Pacific
10.4.1 Trends Analysis
10.4.2 Asia Pacific Emission Monitoring Systems Market Estimates and Forecasts, by Country (2020-2032) (USD Billion)
10.4.3 Asia Pacific Emission Monitoring Systems Market Estimates and Forecasts, By Type (2020-2032) (USD Billion)
10.4.4 Asia Pacific Emission Monitoring Systems Market Estimates and Forecasts, By Component (2020-2032) (USD Billion)
10.4.5 Asia Pacific Emission Monitoring Systems Market Estimates and Forecasts, By End-Use (2020-2032) (USD Billion)
10.4.6 China
10.4.6.1 China Emission Monitoring Systems Market Estimates and Forecasts, By Type (2020-2032) (USD Billion)
10.4.6.2 China Emission Monitoring Systems Market Estimates and Forecasts, By Component (2020-2032) (USD Billion)
10.4.6.3 China Emission Monitoring Systems Market Estimates and Forecasts, By End-Use (2020-2032) (USD Billion)
10.4.7 India
10.4.7.1 India Emission Monitoring Systems Market Estimates and Forecasts, By Type (2020-2032) (USD Billion)
10.4.7.2 India Emission Monitoring Systems Market Estimates and Forecasts, By Component (2020-2032) (USD Billion)
10.4.7.3 India Emission Monitoring Systems Market Estimates and Forecasts, By End-Use (2020-2032) (USD Billion)
10.4.8 Japan
10.4.8.1 Japan Emission Monitoring Systems Market Estimates and Forecasts, By Type (2020-2032) (USD Billion)
10.4.8.2 Japan Emission Monitoring Systems Market Estimates and Forecasts, By Component (2020-2032) (USD Billion)
10.4.8.3 Japan Emission Monitoring Systems Market Estimates and Forecasts, By End-Use (2020-2032) (USD Billion)
10.4.9 South Korea
10.4.9.1 South Korea Emission Monitoring Systems Market Estimates and Forecasts, By Type (2020-2032) (USD Billion)
10.4.9.2 South Korea Emission Monitoring Systems Market Estimates and Forecasts, By Component (2020-2032) (USD Billion)
10.4.9.3 South Korea Emission Monitoring Systems Market Estimates and Forecasts, By End-Use (2020-2032) (USD Billion)
10.4.10 Vietnam
10.4.10.1 Vietnam Emission Monitoring Systems Market Estimates and Forecasts, By Type (2020-2032) (USD Billion)
10.4.10.2 Vietnam Emission Monitoring Systems Market Estimates and Forecasts, By Component (2020-2032) (USD Billion)
10.4.10.3 Vietnam Emission Monitoring Systems Market Estimates and Forecasts, By End-Use (2020-2032) (USD Billion)
10.4.11 Singapore
10.4.11.1 Singapore Emission Monitoring Systems Market Estimates and Forecasts, By Type (2020-2032) (USD Billion)
10.4.11.2 Singapore Emission Monitoring Systems Market Estimates and Forecasts, By Component (2020-2032) (USD Billion)
10.4.11.3 Singapore Emission Monitoring Systems Market Estimates and Forecasts, By End-Use (2020-2032) (USD Billion)
10.4.12 Australia
10.4.12.1 Australia Emission Monitoring Systems Market Estimates and Forecasts, By Type (2020-2032) (USD Billion)
10.4.12.2 Australia Emission Monitoring Systems Market Estimates and Forecasts, By Component (2020-2032) (USD Billion)
10.4.12.3 Australia Emission Monitoring Systems Market Estimates and Forecasts, By End-Use (2020-2032) (USD Billion)
10.4.13 Rest of Asia Pacific
10.4.13.1 Rest of Asia Pacific Emission Monitoring Systems Market Estimates and Forecasts, By Type (2020-2032) (USD Billion)
10.4.13.2 Rest of Asia Pacific Emission Monitoring Systems Market Estimates and Forecasts, By Component (2020-2032) (USD Billion)
10.4.13.3 Rest of Asia Pacific Emission Monitoring Systems Market Estimates and Forecasts, By End-Use (2020-2032) (USD Billion)
10.5 Middle East and Africa
10.5.1 Middle East
10.5.1.1 Trends Analysis
10.5.1.2 Middle East Emission Monitoring Systems Market Estimates and Forecasts, by Country (2020-2032) (USD Billion)
10.5.1.3 Middle East Emission Monitoring Systems Market Estimates and Forecasts, By Type (2020-2032) (USD Billion)
10.5.1.4 Middle East Emission Monitoring Systems Market Estimates and Forecasts, By Component (2020-2032) (USD Billion)
10.5.1.5 Middle East Emission Monitoring Systems Market Estimates and Forecasts, By End-Use (2020-2032) (USD Billion)
10.5.1.6 UAE
10.5.1.6.1 UAE Emission Monitoring Systems Market Estimates and Forecasts, By Type (2020-2032) (USD Billion)
10.5.1.6.2 UAE Emission Monitoring Systems Market Estimates and Forecasts, By Component (2020-2032) (USD Billion)
10.5.1.6.3 UAE Emission Monitoring Systems Market Estimates and Forecasts, By End-Use (2020-2032) (USD Billion)
10.5.1.7 Egypt
10.5.1.7.1 Egypt Emission Monitoring Systems Market Estimates and Forecasts, By Type (2020-2032) (USD Billion)
10.5.1.7.2 Egypt Emission Monitoring Systems Market Estimates and Forecasts, By Component (2020-2032) (USD Billion)
10.5.1.7.3 Egypt Emission Monitoring Systems Market Estimates and Forecasts, By End-Use (2020-2032) (USD Billion)
10.5.1.8 Saudi Arabia
10.5.1.8.1 Saudi Arabia Emission Monitoring Systems Market Estimates and Forecasts, By Type (2020-2032) (USD Billion)
10.5.1.8.2 Saudi Arabia Emission Monitoring Systems Market Estimates and Forecasts, By Component (2020-2032) (USD Billion)
10.5.1.8.3 Saudi Arabia Emission Monitoring Systems Market Estimates and Forecasts, By End-Use (2020-2032) (USD Billion)
10.5.1.9 Qatar
10.5.1.9.1 Qatar Emission Monitoring Systems Market Estimates and Forecasts, By Type (2020-2032) (USD Billion)
10.5.1.9.2 Qatar Emission Monitoring Systems Market Estimates and Forecasts, By Component (2020-2032) (USD Billion)
10.5.1.9.3 Qatar Emission Monitoring Systems Market Estimates and Forecasts, By End-Use (2020-2032) (USD Billion)
10.5.1.10 Rest of Middle East
10.5.1.10.1 Rest of Middle East Emission Monitoring Systems Market Estimates and Forecasts, By Type (2020-2032) (USD Billion)
10.5.1.10.2 Rest of Middle East Emission Monitoring Systems Market Estimates and Forecasts, By Component (2020-2032) (USD Billion)
10.5.1.10.3 Rest of Middle East Emission Monitoring Systems Market Estimates and Forecasts, By End-Use (2020-2032) (USD Billion)
10.5.2 Africa
10.5.2.1 Trends Analysis
10.5.2.2 Africa Emission Monitoring Systems Market Estimates and Forecasts, by Country (2020-2032) (USD Billion)
10.5.2.3 Africa Emission Monitoring Systems Market Estimates and Forecasts, By Type (2020-2032) (USD Billion)
10.5.2.4 Africa Emission Monitoring Systems Market Estimates and Forecasts, By Component (2020-2032) (USD Billion)
10.5.2.5 Africa Emission Monitoring Systems Market Estimates and Forecasts, By End-Use (2020-2032) (USD Billion)
10.5.2.6 South Africa
10.5.2.6.1 South Africa Emission Monitoring Systems Market Estimates and Forecasts, By Type (2020-2032) (USD Billion)
10.5.2.6.2 South Africa Emission Monitoring Systems Market Estimates and Forecasts, By Component (2020-2032) (USD Billion)
10.5.2.6.3 South Africa Emission Monitoring Systems Market Estimates and Forecasts, By End-Use (2020-2032) (USD Billion)
10.5.2.7 Nigeria
10.5.2.7.1 Nigeria Emission Monitoring Systems Market Estimates and Forecasts, By Type (2020-2032) (USD Billion)
10.5.2.7.2 Nigeria Emission Monitoring Systems Market Estimates and Forecasts, By Component (2020-2032) (USD Billion)
10.5.2.7.3 Nigeria Emission Monitoring Systems Market Estimates and Forecasts, By End-Use (2020-2032) (USD Billion)
10.5.2.8 Rest of Africa
10.5.2.8.1 Rest of Africa Emission Monitoring Systems Market Estimates and Forecasts, By Type (2020-2032) (USD Billion)
10.5.2.8.2 Rest of Africa Emission Monitoring Systems Market Estimates and Forecasts, By Component (2020-2032) (USD Billion)
10.5.2.8.3 Rest of Africa Emission Monitoring Systems Market Estimates and Forecasts, By End-Use (2020-2032) (USD Billion)
10.6 Latin America
10.6.1 Trends Analysis
10.6.2 Latin America Emission Monitoring Systems Market Estimates and Forecasts, by Country (2020-2032) (USD Billion)
10.6.3 Latin America Emission Monitoring Systems Market Estimates and Forecasts, By Type (2020-2032) (USD Billion)
10.6.4 Latin America Emission Monitoring Systems Market Estimates and Forecasts, By Component (2020-2032) (USD Billion)
10.6.5 Latin America Emission Monitoring Systems Market Estimates and Forecasts, By End-Use (2020-2032) (USD Billion)
10.6.6 Brazil
10.6.6.1 Brazil Emission Monitoring Systems Market Estimates and Forecasts, By Type (2020-2032) (USD Billion)
10.6.6.2 Brazil Emission Monitoring Systems Market Estimates and Forecasts, By Component (2020-2032) (USD Billion)
10.6.6.3 Brazil Emission Monitoring Systems Market Estimates and Forecasts, By End-Use (2020-2032) (USD Billion)
10.6.7 Argentina
10.6.7.1 Argentina Emission Monitoring Systems Market Estimates and Forecasts, By Type (2020-2032) (USD Billion)
10.6.7.2 Argentina Emission Monitoring Systems Market Estimates and Forecasts, By Component (2020-2032) (USD Billion)
10.6.7.3 Argentina Emission Monitoring Systems Market Estimates and Forecasts, By End-Use (2020-2032) (USD Billion)
10.6.8 Colombia
10.6.8.1 Colombia Emission Monitoring Systems Market Estimates and Forecasts, By Type (2020-2032) (USD Billion)
10.6.8.2 Colombia Emission Monitoring Systems Market Estimates and Forecasts, By Component (2020-2032) (USD Billion)
10.6.8.3 Colombia Emission Monitoring Systems Market Estimates and Forecasts, By End-Use (2020-2032) (USD Billion)
10.6.9 Rest of Latin America
10.6.9.1 Rest of Latin America Emission Monitoring Systems Market Estimates and Forecasts, By Type (2020-2032) (USD Billion)
10.6.9.2 Rest of Latin America Emission Monitoring Systems Market Estimates and Forecasts, By Component (2020-2032) (USD Billion)
10.6.9.3 Rest of Latin America Emission Monitoring Systems Market Estimates and Forecasts, By End-Use (2020-2032) (USD Billion)
11. Company Profiles
11.1 ABB Ltd.
11.1.1 Company Overview
11.1.2 Financial
11.1.3 Products/ Services Offered
11.1.4 SWOT Analysis
11.2 Ametek, Inc.
11.2.1 Company Overview
11.2.2 Financial
11.2.3 Products/ Services Offered
11.2.4 SWOT Analysis
11.3 Emerson Electric Company
11.3.1 Company Overview
11.3.2 Financial
11.3.3 Products/ Services Offered
11.3.4 SWOT Analysis
11.4 General Electric Company
11.4.1 Company Overview
11.4.2 Financial
11.4.3 Products/ Services Offered
11.4.4 SWOT Analysis
11.5 Enviro Technology Services Plc.
11.5.1 Company Overview
11.5.2 Financial
11.5.3 Products/ Services Offered
11.5.4 SWOT Analysis
11.6 Siemens AG
11.6.1 Company Overview
11.6.2 Financial
11.6.3 Products/ Services Offered
11.6.4 SWOT Analysis
11.7 Horiba Ltd.
11.7.1 Company Overview
11.7.2 Financial
11.7.3 Products/ Services Offered
11.7.4 SWOT Analysis
11.8 Fuji Electric Co., Ltd.
11.8.1 Company Overview
11.8.2 Financial
11.8.3 Products/ Services Offered
11.8.4 SWOT Analysis
11.9 Rockwell Automation, Inc.
11.9.1 Company Overview
11.9.2 Financial
11.9.3 Products/ Services Offered
11.9.4 SWOT Analysis
11.10 Thermo Fisher Scientific Inc.
11.10.1 Company Overview
11.10.2 Financial
11.10.3 Products/ Services Offered
11.10.4 SWOT Analysis
12. Use Cases and Best Practices
13. Conclusion
An accurate research report requires proper strategizing as well as implementation. There are multiple factors involved in the completion of good and accurate research report and selecting the best methodology to compete the research is the toughest part. Since the research reports we provide play a crucial role in any company’s decision-making process, therefore we at SNS Insider always believe that we should choose the best method which gives us results closer to reality. This allows us to reach at a stage wherein we can provide our clients best and accurate investment to output ratio.
Each report that we prepare takes a timeframe of 350-400 business hours for production. Starting from the selection of titles through a couple of in-depth brain storming session to the final QC process before uploading our titles on our website we dedicate around 350 working hours. The titles are selected based on their current market cap and the foreseen CAGR and growth.
The 5 steps process:
Step 1: Secondary Research:
Secondary Research or Desk Research is as the name suggests is a research process wherein, we collect data through the readily available information. In this process we use various paid and unpaid databases which our team has access to and gather data through the same. This includes examining of listed companies’ annual reports, Journals, SEC filling etc. Apart from this our team has access to various associations across the globe across different industries. Lastly, we have exchange relationships with various university as well as individual libraries.

Step 2: Primary Research
When we talk about primary research, it is a type of study in which the researchers collect relevant data samples directly, rather than relying on previously collected data. This type of research is focused on gaining content specific facts that can be sued to solve specific problems. Since the collected data is fresh and first hand therefore it makes the study more accurate and genuine.
We at SNS Insider have divided Primary Research into 2 parts.
Part 1 wherein we interview the KOLs of major players as well as the upcoming ones across various geographic regions. This allows us to have their view over the market scenario and acts as an important tool to come closer to the accurate market numbers. As many as 45 paid and unpaid primary interviews are taken from both the demand and supply side of the industry to make sure we land at an accurate judgement and analysis of the market.
This step involves the triangulation of data wherein our team analyses the interview transcripts, online survey responses and observation of on filed participants. The below mentioned chart should give a better understanding of the part 1 of the primary interview.

Part 2: In this part of primary research the data collected via secondary research and the part 1 of the primary research is validated with the interviews from individual consultants and subject matter experts.
Consultants are those set of people who have at least 12 years of experience and expertise within the industry whereas Subject Matter Experts are those with at least 15 years of experience behind their back within the same space. The data with the help of two main processes i.e., FGDs (Focused Group Discussions) and IDs (Individual Discussions). This gives us a 3rd party nonbiased primary view of the market scenario making it a more dependable one while collation of the data pointers.
Step 3: Data Bank Validation
Once all the information is collected via primary and secondary sources, we run that information for data validation. At our intelligence centre our research heads track a lot of information related to the market which includes the quarterly reports, the daily stock prices, and other relevant information. Our data bank server gets updated every fortnight and that is how the information which we collected using our primary and secondary information is revalidated in real time.

Step 4: QA/QC Process
After all the data collection and validation our team does a final level of quality check and quality assurance to get rid of any unwanted or undesired mistakes. This might include but not limited to getting rid of the any typos, duplication of numbers or missing of any important information. The people involved in this process include technical content writers, research heads and graphics people. Once this process is completed the title gets uploader on our platform for our clients to read it.
Step 5: Final QC/QA Process:
This is the last process and comes when the client has ordered the study. In this process a final QA/QC is done before the study is emailed to the client. Since we believe in giving our clients a good experience of our research studies, therefore, to make sure that we do not lack at our end in any way humanly possible we do a final round of quality check and then dispatch the study to the client.
Key Segments:
Continuous Emission Monitoring System (CEMS)
Predictive Emission Monitoring System (PEMS)
By Component
Hardware
Software
Services
Installation & Deployment
Training
Support & Maintenance
By End-Use
Oil & Gas
Metals & Mining
Power Generation
Chemical & Fertilizer
Pulp & Paper
Pharmaceutical
Others
Request for Segment Customization as per your Business Requirement: Segment Customization Request
Regional Coverage:
North America
US
Canada
Mexico
Europe
Eastern Europe
Poland
Romania
Hungary
Turkey
Rest of Eastern Europe
Western Europe
Germany
France
UK
Italy
Spain
Netherlands
Switzerland
Austria
Rest of Western Europe
Asia Pacific
China
India
Japan
South Korea
Vietnam
Singapore
Australia
Rest of Asia Pacific
Middle East & Africa
Middle East
UAE
Egypt
Saudi Arabia
Qatar
Rest of Middle East
Africa
Nigeria
South Africa
Rest of Africa
Latin America
Brazil
Argentina
Colombia
Rest of Latin America
Request for Country Level Research Report: Country Level Customization Request
Available Customization
With the given market data, SNS Insider offers customization as per the company’s specific needs. The following customization options are available for the report:
Detailed Volume Analysis
Criss-Cross segment analysis (e.g. Product X Application)
Competitive Product Benchmarking
Geographic Analysis
Additional countries in any of the regions
Customized Data Representation
Detailed analysis and profiling of additional market players
The Semiconductor Inspection Microscope Market size was valued at USD 6.24 billion in 2023 and is expected to Reach USD 10.38 billion by 2032 and grow at a CAGR of 5.82% over the forecast period of 2024-2032.
The Pressure Washer Market Size was valued at USD 2.3 Billion in 2023 and is expected to grow at a CAGR of 3.48% to reach USD 3.13 Billion by 2032.
The Level Sensor Market Size was valued at USD 4.79 billion in 2023 and is expected to reach $9.18 billion by 2032 and grow at a CAGR of 7.50% by 2024-2032
The Quantum Cascade Laser Market was valued at USD 416.85 million in 2023 and is expected to reach USD 617.93 million by 2032, growing at a CAGR of 4.50% over the forecast period 2024-2032.
The Semiconductor Equipment Market Size was valued at USD 116.59 Billion in 2023 and is expected to reach USD 254.00 Billion by 2032 and grow at a CAGR of 9.05% over the forecast period 2024-2032.
The Multilayer Ceramic Capacitor Market Size was valued at USD 13.17 Billion in 2023 and is expected to grow at a CAGR of 5.72% During 2024-2032.

Hi! Click one of our member below to chat on Phone
© 2025 All Rights Reserved by SNS Insider Pvt Ltd


