image

Embedded Non-Volatile Memory Market Size & Trends:

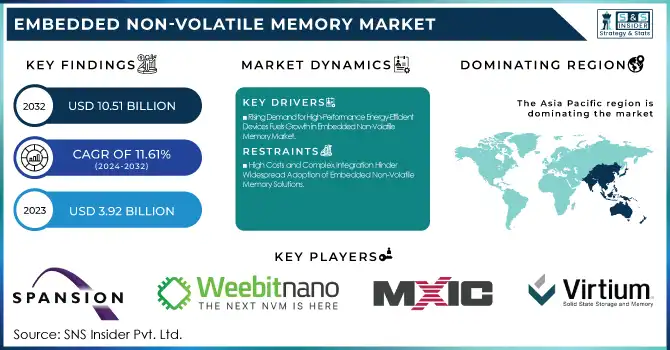
The Embedded Non-Volatile Memory Market Size was valued at USD 3.92 billion in 2023 and is expected to reach USD 10.51 billion by 2032, growing at a CAGR of 11.61% over the forecast period 2024-2032. Technology adoption is growing rapidly and is driven by advancements in ReRAM, MRAM, and other emerging memory technologies with high-speed and low-power applications. Supply chain and manufacturing processes are evolving with smaller wafer sizes and advanced fab techniques to increase scalability and reduce cost.

Embedded Non-Volatile Memory Market Revenue Analysis

To Get more information on Embedded Non-Volatile Memory Market - Request Free Sample Report

Power consumption and efficiency still play an important role, especially in the case of IoT and wearable devices that rely on small, low-power memory. Besides, increasing customizations and design flexibility is also prompting vendors to develop application-specific eNVM architecture, especially for automotive electronics, industrial automation, and telecommunications, to achieve optimum performance and integration.

Embedded Non-Volatile Memory Market Dynamics

Key Drivers: 

  • Rising Demand for High-Performance Energy-Efficient Devices Fuels Growth in Embedded Non-Volatile Memory Market

The growth of high-performance, energy-efficient consumer electronics and automotive applications is the main factor driving the embedded non-volatile memory (eNVM) market. Smarter and more interconnected, you want your devices to be able to connect to the world without delays and high-power consumption to limit their usefulness as a business. This trend is especially visible in electric vehicles, IoT devices, and wearable technology, which need efficient aggregation and retrieval of data. Moreover, the growing trends of semiconductor technology along with the increasing deployment of 5G networks are also expected to drive the growth of the eNVM market owing to their high-speed communication and data processing ability.

Restrain: 

  • High Costs and Complex Integration Hinder Widespread Adoption of Embedded Non-Volatile Memory Solutions

The eNVM market is challenged with market restraints like high manufacturing costs and complicated integration processes. With advancements in semiconductor fabrication, both the scale and the cost to develop high-density eNVM solutions (eFlash, FRAM, etc.) are rising. The cost is a big hurdle for smaller manufacturers, and it is the main reason why eNVM is not becoming commonplace for many cost-sensitive applications. Moreover, embedding eNVM into next-generation system-on-chip (SoC) designs is a complex process, and also significantly impacts upgrade tools and experience. This makes development longer and costlier, extending the time-to-market of new products. Additionally, the growth of the market is further restrained due to compatibility issues with already existing technologies and the requirement for continuous innovations to meet the changing performance standards.

Opportunity:

  • Technological Advancements and IoT Expansion Unlock Growth Opportunities for Embedded Non-Volatile Memory Market

The eNVM opportunities are mainly associated with technological innovations along with the rise in mastering AI and machine learning-based applications. IoT ecosystems are gaining huge momentum, which paves significant growth opportunities for eE2PROM, projected to grow fastest CAGR during 2024–2032. In addition, the trend of miniaturization requires compact, high-density memory solutions that fuel research into new materials and architectures like FRAM and other emerging technologies The changing scenario opens the door for manufacturers to enrich products and grow beyond boundaries.

Challenges:

  • Intense Competition and Rapid Technological Evolution Pose Challenges for Embedded Non-Volatile Memory Market

Rapid changes and extreme competition in the eNVM business can also create problems. High barriers to entry, as established players typically saturate the market and offer the same product at lower costs and through more innovation. The fast rate of evolution in technology means that you have to keep researching and developing, and this can eat up a lot of resources. In addition, MRAM and ReRAM, as alternative memory technology architectures, are becoming more competitive with the existing eNVM solutions, e.g. eFlash and eE2PROM. There are also issues with security of data integrity and protection within connected devices, requiring additional features for eNVM security.

Embedded Non-Volatile Memory Market Segment Analysis

By Product

eFlash held the largest share of the total embedded non-volatile memory (eNVM) market at 38.6% in 2023, mainly due to high speed, reliability, and extensive penetration in automotive and consumer electronics applications. This supported advanced driver-assistance systems (ADAS) and IoT devices, helping to maintain its leadership position.

The eE2PROM is anticipated to grow at the highest CAGR between 2024-2032 owing to the high adoption of small-size and low power-consuming memory devices in wearable devices and smart home applications. This flexibility with low power consumption makes it the perfect match for the new IoT ecosystem and a major growth driver.

By Wafer Size

In 2023, wafers sized >100 mm dominated the embedded non-volatile memory market with a substantial share of 56.5%, due to its high storage capacity and efficiency in advanced semiconductor applications. That's larger wafers, used in automotive electronics and high-performance computing to house complicated integrated circuits.

Wafers <100 mm are also expected to grow at the highest CAGR from 2024 to 2032. The miniaturization trend in multi-sensor integrated IoT and wearable technology, which plays to small, low-power devices that benefit from small wafers, is driving this growth.

By Application

The BFSI sector accounted for the highest embedded non-volatile memory market share of 24.8% in 2023 owing to the high demand for safe data storage and high-performance processing for digital banking and financial transactions. This dominance was driven by the demand for reliable memory solutions in payment gateways, authentication systems, and financial analytics.

In 2024, the telecommunications segment is projected to be the fastest growing fading segment over the 2024-2032 period in terms of overall CAGR, driven by the growth of widespread 5G networks and demand for communication devices capable of transmitting data at high speed, leading to a high demand for robust and high capacity eNVM solutions required for data processing and connectivity.

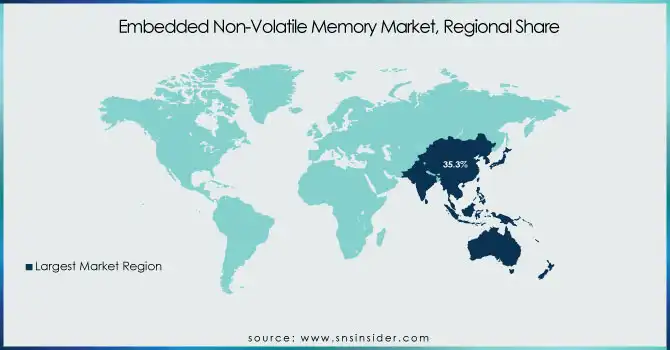
Embedded Non-Volatile Memory Market Regional Outlook

The Asia Pacific region led the eNVM market in 2023 with a 35.3% share owing to the presence of a large number of semiconductor manufacturers and demand from consumer electronics and automotive industries. Countries such as China, South Korea, and Japan are the world's leading hubs for various electronics industries, with Samsung Electronics, TSMC, and Sony among firms adopting advanced eNVM solutions in smartphones, smart appliances, and automotive electronics. In the example of memory, the region has the advantages including Samsung using eFlash for its high-end smartphones, and TSMC using eNVM technology in advanced system chip (SoC) designs. Further market growth is supported by a fast roll-out of electric vehicles and connected consumer appliances in China and Japan.

North America is expected to grow at the fastest CAGR from 2024 to 2032, due to the growing developments of 5G, AI, and autonomous cars. Intel, Micron Technology, and IBM are important regional players developing advanced eNVM for high-performance computing and automotive applications. The inclusion of eNVM in next-gen processors at Intel and advances in non-volatile memory technologies for data centers at Micron are the embodiment of the concentration on high-speed processing and storage of data. Complementing this, the diffusion of smart infrastructure and the rising adoption of connected devices will also fuel North American rapid growth.

Embedded Non-Volatile Memory Market Regional Share

Get Customized Report as per Your Business Requirement - Enquiry Now

Key Players

Some of the major players in the Embedded Non-Volatile Memory Market are:

  • Spansion (MirrorBit NOR GL, HyperFlash Memory)

  • Weebit Nano (ReRAM Technology, Embedded ReRAM Module)

  • Macronix (OctaBus Flash Memory, ArmorFlash)

  • Virtium (StorFly SSDs, TuffDrive eUSB 3.0 Modules)

  • Phison (PS5018-E18 PCIe 4.0 NVMe Controller, E26 SSD Controller)

  • Micron Technology (Authentic Flash, Xccela Flash)

  • Cypress Semiconductor (Semper NOR Flash, HyperFlash NOR Memory)

  • Winbond Electronics (SpiFlash NOR Flash, TrustME Secure Flash)

  • Adesto Technologies (DataFlash, EcoXiP)

  • NXP Semiconductors (FlexSPI NOR Flash, i.MX RT Crossover Processors)

  • Renesas Electronics (RL78 Family with Code Flash, RX Family with Embedded Flash)

  • Infineon Technologies (Embedded Flash (eFlash), SEMPER Secure NOR Flash)

  • Samsung Electronics (eMRAM, eFlash)

  • Intel Corporation (StrataFlash Memory, Embedded NOR Flash)

  • Toshiba Memory Corporation (BENAND, Serial Interface NAND)

Recent Trends

  • In January 2025, Weebit Nano secured a major licensing deal with onsemi to integrate its ReRAM technology into onsemi's Treo platform, targeting automotive and industrial applications. This partnership marks a significant commercial milestone, enhancing low-power embedded memory solutions.

  • In February 2024, Renesas unveiled a new embedded MRAM macro achieving over 200MHz random-read access and 10.4 MB/s write throughput for high-performance MCUs.

Embedded Non-Volatile Memory Market Report Scope:

Report Attributes Details
Market Size in 2023 USD 3.92 Billion
Market Size by 2032 USD 10.51 Billion
CAGR CAGR of 11.61% From 2024 to 2032
Base Year 2023
Forecast Period 2024-2032
Historical Data 2020-2022
Report Scope & Coverage Market Size, Segments Analysis, Competitive  Landscape, Regional Analysis, DROC & SWOT Analysis, Forecast Outlook
Key Segments • By Product (eFlash, eE2PROM, FRAM, Others)
• By Wafer Size (<100 mm, >100 mm)
• By Application (BFSI, Consumer Electronics, Government, Telecommunications, Information Technology, Others)
Regional Analysis/Coverage North America (US, Canada, Mexico), Europe (Eastern Europe [Poland, Romania, Hungary, Turkey, Rest of Eastern Europe] Western Europe] Germany, France, UK, Italy, Spain, Netherlands, Switzerland, Austria, Rest of Western Europe]), Asia Pacific (China, India, Japan, South Korea, Vietnam, Singapore, Australia, Rest of Asia Pacific), Middle East & Africa (Middle East [UAE, Egypt, Saudi Arabia, Qatar, Rest of Middle East], Africa [Nigeria, South Africa, Rest of Africa], Latin America (Brazil, Argentina, Colombia, Rest of Latin America)
Company Profiles Spansion, Weebit Nano, Macronix, Virtium, Phison, Micron Technology, Cypress Semiconductor, Winbond Electronics, Adesto Technologies, NXP Semiconductors, Renesas Electronics, Infineon Technologies, Samsung Electronics, Intel Corporation, Toshiba Memory Corporation.

Frequently Asked Questions

Ans: The Embedded Non-Volatile Memory Market is expected to grow at a CAGR of 11.61% during 2024-2032.

Ans: Embedded Non-Volatile Memory Market size was USD 3.92 billion in 2023 and is expected to Reach USD 10.51 billion by 2032.

Ans: The major growth factor of the Embedded Non-Volatile Memory (eNVM) market is the increasing demand for high-performance, energy-efficient memory solutions in automotive electronics, IoT devices, and advanced consumer electronics.

Ans: The eFlash segment dominated the Embedded Non-Volatile Memory Market in 2023.

Ans: Asia Pacific dominated the Embedded Non-Volatile Memory Market in 2023.

Table of Content

1. Introduction

1.1 Market Definition

1.2 Scope (Inclusion and Exclusions)

1.3 Research Assumptions

2. Executive Summary

2.1 Market Overview

2.2 Regional Synopsis

2.3 Competitive Summary

3. Research Methodology

3.1 Top-Down Approach

3.2 Bottom-up Approach

3.3. Data Validation

3.4 Primary Interviews

4. Market Dynamics Impact Analysis

4.1 Market Driving Factors Analysis

4.1.1 Drivers

4.1.2 Restraints

4.1.3 Opportunities

4.1.4 Challenges

4.2 PESTLE Analysis

4.3 Porter’s Five Forces Model

5. Statistical Insights and Trends Reporting

5.1 Technology Adoption Rate

5.2 Supply Chain and Manufacturing Insights

      5.3 Power Consumption and Efficiency

      5.4 Customization and Design Flexibility

6. Competitive Landscape

6.1 List of Major Companies, By Region

6.2 Market Share Analysis, By Region

6.3 Product Benchmarking

6.3.1 Product specifications and features

6.3.2 Pricing

6.4 Strategic Initiatives

6.4.1 Marketing and Promotional Activities

6.4.2 Distribution and Supply Chain Strategies

6.4.3 Expansion plans and new product launches

6.4.4 Strategic partnerships and collaborations

6.5 Technological Advancements

6.6 Market Positioning and Branding

7. Embedded Non-Volatile Memory Market Segmentation, By Product

7.1 Chapter Overview

7.2 eFlash

7.2.1 eFlash Market Trends Analysis (2020-2032)

7.2.2 eFlash Market Size Estimates and Forecasts to 2032 (USD Billion)

7.3 eE2PROM

7.3.1 eE2PROM Market Trends Analysis (2020-2032)

7.3.2 eE2PROM Market Size Estimates and Forecasts to 2032 (USD Billion)

7.4 FRAM

7.4.1 FRAM Market Trends Analysis (2020-2032)

7.4.2 FRAM Market Size Estimates and Forecasts to 2032 (USD Billion)

7.5 Others

7.5.1 Others Market Trends Analysis (2020-2032)

7.5.2 Others Market Size Estimates and Forecasts to 2032 (USD Billion)

8. Embedded Non-Volatile Memory Market Segmentation, By Wafer Size

8.1 Chapter Overview

8.2 <100 mm

8.2.1 <100 mm Market Trends Analysis (2020-2032)

8.2.2 <100 mm Market Size Estimates and Forecasts to 2032 (USD Billion)

8.3 >100 mm

8.3.1 >100 mm Market Trends Analysis (2020-2032)

8.3.2 >100 mm Market Size Estimates and Forecasts to 2032 (USD Billion)

9. Embedded Non-Volatile Memory Market Segmentation, By Application

9.1 Chapter Overview

9.2 BFSI

9.2.1 BFSI Market Trends Analysis (2020-2032)

9.2.2 BFSI Market Size Estimates and Forecasts to 2032 (USD Billion)

9.3 Consumer Electronics

              9.3.1 Consumer Electronics Market Trends Analysis (2020-2032)

9.3.2 Consumer Electronics Market Size Estimates and Forecasts to 2032 (USD Billion)

9.4 Government

              9.4.1 Government Market Trends Analysis (2020-2032)

9.4.2 Government Market Size Estimates and Forecasts to 2032 (USD Billion)

9.5 Telecommunications

              9.5.1 Telecommunications Market Trends Analysis (2020-2032)

9.5.2 Telecommunications Market Size Estimates and Forecasts to 2032 (USD Billion)

9.6 Information Technology

              9.6.1 Information Technology Market Trends Analysis (2020-2032)

9.6.2 Information Technology Market Size Estimates and Forecasts to 2032 (USD Billion)

9.7 Others

              9.7.1 Others Market Trends Analysis (2020-2032)

9.7.2 Others Market Size Estimates and Forecasts to 2032 (USD Billion)

10. Regional Analysis

10.1 Chapter Overview

10.2 North America

10.2.1 Trends Analysis

10.2.2 North America Embedded Non-Volatile Memory Market Estimates and Forecasts, by Country (2020-2032) (USD Billion)

10.2.3 North America Embedded Non-Volatile Memory Market Estimates and Forecasts, By Product (2020-2032) (USD Billion) 

10.2.4 North America Embedded Non-Volatile Memory Market Estimates and Forecasts, By Wafer Size (2020-2032) (USD Billion)

10.2.5 North America Embedded Non-Volatile Memory Market Estimates and Forecasts, By Application (2020-2032) (USD Billion)

10.2.6 USA

10.2.6.1 USA Embedded Non-Volatile Memory Market Estimates and Forecasts, By Product (2020-2032) (USD Billion)

10.2.6.2 USA Embedded Non-Volatile Memory Market Estimates and Forecasts, By Wafer Size (2020-2032) (USD Billion)

10.2.6.3 USA Embedded Non-Volatile Memory Market Estimates and Forecasts, By Application (2020-2032) (USD Billion)

10.2.7 Canada

10.2.7.1 Canada Embedded Non-Volatile Memory Market Estimates and Forecasts, By Product (2020-2032) (USD Billion)

10.2.7.2 Canada Embedded Non-Volatile Memory Market Estimates and Forecasts, By Wafer Size (2020-2032) (USD Billion)

10.2.7.3 Canada Embedded Non-Volatile Memory Market Estimates and Forecasts, By Application (2020-2032) (USD Billion)

10.2.8 Mexico

10.2.8.1 Mexico Embedded Non-Volatile Memory Market Estimates and Forecasts, By Product (2020-2032) (USD Billion)

10.2.8.2 Mexico Embedded Non-Volatile Memory Market Estimates and Forecasts, By Wafer Size (2020-2032) (USD Billion)

10.2.8.3 Mexico Embedded Non-Volatile Memory Market Estimates and Forecasts, By Application (2020-2032) (USD Billion)

10.3 Europe

10.3.1 Eastern Europe

10.3.1.1 Trends Analysis

10.3.1.2 Eastern Europe Embedded Non-Volatile Memory Market Estimates and Forecasts, by Country (2020-2032) (USD Billion)

10.3.1.3 Eastern Europe Embedded Non-Volatile Memory Market Estimates and Forecasts, By Product (2020-2032) (USD Billion) 

10.3.1.4 Eastern Europe Embedded Non-Volatile Memory Market Estimates and Forecasts, By Wafer Size (2020-2032) (USD Billion)

10.3.1.5 Eastern Europe Embedded Non-Volatile Memory Market Estimates and Forecasts, By Application (2020-2032) (USD Billion)

10.3.1.6 Poland

10.3.1.6.1 Poland Embedded Non-Volatile Memory Market Estimates and Forecasts, By Product (2020-2032) (USD Billion)

10.3.1.6.2 Poland Embedded Non-Volatile Memory Market Estimates and Forecasts, By Wafer Size (2020-2032) (USD Billion)

10.3.1.6.3 Poland Embedded Non-Volatile Memory Market Estimates and Forecasts, By Application (2020-2032) (USD Billion)

10.3.1.7 Romania

10.3.1.7.1 Romania Embedded Non-Volatile Memory Market Estimates and Forecasts, By Product (2020-2032) (USD Billion)

10.3.1.7.2 Romania Embedded Non-Volatile Memory Market Estimates and Forecasts, By Wafer Size (2020-2032) (USD Billion)

10.3.1.7.3 Romania Embedded Non-Volatile Memory Market Estimates and Forecasts, By Application (2020-2032) (USD Billion)

10.3.1.8 Hungary

10.3.1.8.1 Hungary Embedded Non-Volatile Memory Market Estimates and Forecasts, By Product (2020-2032) (USD Billion)

10.3.1.8.2 Hungary Embedded Non-Volatile Memory Market Estimates and Forecasts, By Wafer Size (2020-2032) (USD Billion)

10.3.1.8.3 Hungary Embedded Non-Volatile Memory Market Estimates and Forecasts, By Application (2020-2032) (USD Billion)

10.3.1.9 Turkey

10.3.1.9.1 Turkey Embedded Non-Volatile Memory Market Estimates and Forecasts, By Product (2020-2032) (USD Billion)

10.3.1.9.2 Turkey Embedded Non-Volatile Memory Market Estimates and Forecasts, By Wafer Size (2020-2032) (USD Billion)

10.3.1.9.3 Turkey Embedded Non-Volatile Memory Market Estimates and Forecasts, By Application (2020-2032) (USD Billion)

10.3.1.10 Rest of Eastern Europe

10.3.1.10.1 Rest of Eastern Europe Embedded Non-Volatile Memory Market Estimates and Forecasts, By Product (2020-2032) (USD Billion)

10.3.1.10.2 Rest of Eastern Europe Embedded Non-Volatile Memory Market Estimates and Forecasts, By Wafer Size (2020-2032) (USD Billion)

10.3.1.10.3 Rest of Eastern Europe Embedded Non-Volatile Memory Market Estimates and Forecasts, By Application (2020-2032) (USD Billion)

10.3.2 Western Europe

10.3.2.1 Trends Analysis

10.3.2.2 Western Europe Embedded Non-Volatile Memory Market Estimates and Forecasts, by Country (2020-2032) (USD Billion)

10.3.2.3 Western Europe Embedded Non-Volatile Memory Market Estimates and Forecasts, By Product (2020-2032) (USD Billion) 

10.3.2.4 Western Europe Embedded Non-Volatile Memory Market Estimates and Forecasts, By Wafer Size (2020-2032) (USD Billion)

10.3.2.5 Western Europe Embedded Non-Volatile Memory Market Estimates and Forecasts, By Application (2020-2032) (USD Billion)

10.3.2.6 Germany

10.3.2.6.1 Germany Embedded Non-Volatile Memory Market Estimates and Forecasts, By Product (2020-2032) (USD Billion)

10.3.2.6.2 Germany Embedded Non-Volatile Memory Market Estimates and Forecasts, By Wafer Size (2020-2032) (USD Billion)

10.3.2.6.3 Germany Embedded Non-Volatile Memory Market Estimates and Forecasts, By Application (2020-2032) (USD Billion)

10.3.2.7 France

10.3.2.7.1 France Embedded Non-Volatile Memory Market Estimates and Forecasts, By Product (2020-2032) (USD Billion)

10.3.2.7.2 France Embedded Non-Volatile Memory Market Estimates and Forecasts, By Wafer Size (2020-2032) (USD Billion)

10.3.2.7.3 France Embedded Non-Volatile Memory Market Estimates and Forecasts, By Application (2020-2032) (USD Billion)

10.3.2.8 UK

10.3.2.8.1 UK Embedded Non-Volatile Memory Market Estimates and Forecasts, By Product (2020-2032) (USD Billion)

10.3.2.8.2 UK Embedded Non-Volatile Memory Market Estimates and Forecasts, By Wafer Size (2020-2032) (USD Billion)

10.3.2.8.3 UK Embedded Non-Volatile Memory Market Estimates and Forecasts, By Application (2020-2032) (USD Billion)

10.3.2.9 Italy

10.3.2.9.1 Italy Embedded Non-Volatile Memory Market Estimates and Forecasts, By Product (2020-2032) (USD Billion)

10.3.2.9.2 Italy Embedded Non-Volatile Memory Market Estimates and Forecasts, By Wafer Size (2020-2032) (USD Billion)

10.3.2.9.3 Italy Embedded Non-Volatile Memory Market Estimates and Forecasts, By Application (2020-2032) (USD Billion)

10.3.2.10 Spain

10.3.2.10.1 Spain Embedded Non-Volatile Memory Market Estimates and Forecasts, By Product (2020-2032) (USD Billion)

10.3.2.10.2 Spain Embedded Non-Volatile Memory Market Estimates and Forecasts, By Wafer Size (2020-2032) (USD Billion)

10.3.2.10.3 Spain Embedded Non-Volatile Memory Market Estimates and Forecasts, By Application (2020-2032) (USD Billion)

10.3.2.11 Netherlands

10.3.2.11.1 Netherlands Embedded Non-Volatile Memory Market Estimates and Forecasts, By Product (2020-2032) (USD Billion)

10.3.2.11.2 Netherlands Embedded Non-Volatile Memory Market Estimates and Forecasts, By Wafer Size (2020-2032) (USD Billion)

10.3.2.11.3 Netherlands Embedded Non-Volatile Memory Market Estimates and Forecasts, By Application (2020-2032) (USD Billion)

10.3.2.12 Switzerland

10.3.2.12.1 Switzerland Embedded Non-Volatile Memory Market Estimates and Forecasts, By Product (2020-2032) (USD Billion)

10.3.2.12.2 Switzerland Embedded Non-Volatile Memory Market Estimates and Forecasts, By Wafer Size (2020-2032) (USD Billion)

10.3.2.12.3 Switzerland Embedded Non-Volatile Memory Market Estimates and Forecasts, By Application (2020-2032) (USD Billion)

10.3.2.13 Austria

10.3.2.13.1 Austria Embedded Non-Volatile Memory Market Estimates and Forecasts, By Product (2020-2032) (USD Billion)

10.3.2.13.2 Austria Embedded Non-Volatile Memory Market Estimates and Forecasts, By Wafer Size (2020-2032) (USD Billion)

10.3.2.13.3 Austria Embedded Non-Volatile Memory Market Estimates and Forecasts, By Application (2020-2032) (USD Billion)

10.3.2.14 Rest of Western Europe

10.3.2.14.1 Rest of Western Europe Embedded Non-Volatile Memory Market Estimates and Forecasts, By Product (2020-2032) (USD Billion)

10.3.2.14.2 Rest of Western Europe Embedded Non-Volatile Memory Market Estimates and Forecasts, By Wafer Size (2020-2032) (USD Billion)

10.3.2.14.3 Rest of Western Europe Embedded Non-Volatile Memory Market Estimates and Forecasts, By Application (2020-2032) (USD Billion)

10.4 Asia Pacific

10.4.1 Trends Analysis

10.4.2 Asia Pacific Embedded Non-Volatile Memory Market Estimates and Forecasts, by Country (2020-2032) (USD Billion)

10.4.3 Asia Pacific Embedded Non-Volatile Memory Market Estimates and Forecasts, By Product (2020-2032) (USD Billion) 

10.4.4 Asia Pacific Embedded Non-Volatile Memory Market Estimates and Forecasts, By Wafer Size (2020-2032) (USD Billion)

10.4.5 Asia Pacific Embedded Non-Volatile Memory Market Estimates and Forecasts, By Application (2020-2032) (USD Billion)

10.4.6 China

10.4.6.1 China Embedded Non-Volatile Memory Market Estimates and Forecasts, By Product (2020-2032) (USD Billion)

10.4.6.2 China Embedded Non-Volatile Memory Market Estimates and Forecasts, By Wafer Size (2020-2032) (USD Billion)

10.4.6.3 China Embedded Non-Volatile Memory Market Estimates and Forecasts, By Application (2020-2032) (USD Billion)

10.4.7 India

10.4.7.1 India Embedded Non-Volatile Memory Market Estimates and Forecasts, By Product (2020-2032) (USD Billion)

10.4.7.2 India Embedded Non-Volatile Memory Market Estimates and Forecasts, By Wafer Size (2020-2032) (USD Billion)

10.4.7.3 India Embedded Non-Volatile Memory Market Estimates and Forecasts, By Application (2020-2032) (USD Billion)

10.4.8 Japan

10.4.8.1 Japan Embedded Non-Volatile Memory Market Estimates and Forecasts, By Product (2020-2032) (USD Billion)

10.4.8.2 Japan Embedded Non-Volatile Memory Market Estimates and Forecasts, By Wafer Size (2020-2032) (USD Billion)

10.4.8.3 Japan Embedded Non-Volatile Memory Market Estimates and Forecasts, By Application (2020-2032) (USD Billion)

10.4.9 South Korea

10.4.9.1 South Korea Embedded Non-Volatile Memory Market Estimates and Forecasts, By Product (2020-2032) (USD Billion)

10.4.9.2 South Korea Embedded Non-Volatile Memory Market Estimates and Forecasts, By Wafer Size (2020-2032) (USD Billion)

10.4.9.3 South Korea Embedded Non-Volatile Memory Market Estimates and Forecasts, By Application (2020-2032) (USD Billion)

10.4.10 Vietnam

10.4.10.1 Vietnam Embedded Non-Volatile Memory Market Estimates and Forecasts, By Product (2020-2032) (USD Billion)

10.4.10.2 Vietnam Embedded Non-Volatile Memory Market Estimates and Forecasts, By Wafer Size (2020-2032) (USD Billion)

10.4.10.3 Vietnam Embedded Non-Volatile Memory Market Estimates and Forecasts, By Application (2020-2032) (USD Billion)

10.4.11 Singapore

10.4.11.1 Singapore Embedded Non-Volatile Memory Market Estimates and Forecasts, By Product (2020-2032) (USD Billion)

10.4.11.2 Singapore Embedded Non-Volatile Memory Market Estimates and Forecasts, By Wafer Size (2020-2032) (USD Billion)

10.4.11.3 Singapore Embedded Non-Volatile Memory Market Estimates and Forecasts, By Application (2020-2032) (USD Billion)

10.4.12 Australia

10.4.12.1 Australia Embedded Non-Volatile Memory Market Estimates and Forecasts, By Product (2020-2032) (USD Billion)

10.4.12.2 Australia Embedded Non-Volatile Memory Market Estimates and Forecasts, By Wafer Size (2020-2032) (USD Billion)

10.4.12.3 Australia Embedded Non-Volatile Memory Market Estimates and Forecasts, By Application (2020-2032) (USD Billion)

10.4.13 Rest of Asia Pacific

10.4.13.1 Rest of Asia Pacific Embedded Non-Volatile Memory Market Estimates and Forecasts, By Product (2020-2032) (USD Billion)

10.4.13.2 Rest of Asia Pacific Embedded Non-Volatile Memory Market Estimates and Forecasts, By Wafer Size (2020-2032) (USD Billion)

10.4.13.3 Rest of Asia Pacific Embedded Non-Volatile Memory Market Estimates and Forecasts, By Application (2020-2032) (USD Billion)

10.5 Middle East and Africa

10.5.1 Middle East

10.5.1.1 Trends Analysis

10.5.1.2 Middle East Embedded Non-Volatile Memory Market Estimates and Forecasts, by Country (2020-2032) (USD Billion)

10.5.1.3 Middle East Embedded Non-Volatile Memory Market Estimates and Forecasts, By Product (2020-2032) (USD Billion) 

10.5.1.4 Middle East Embedded Non-Volatile Memory Market Estimates and Forecasts, By Wafer Size (2020-2032) (USD Billion)

10.5.1.5 Middle East Embedded Non-Volatile Memory Market Estimates and Forecasts, By Application (2020-2032) (USD Billion)

10.5.1.6 UAE

10.5.1.6.1 UAE Embedded Non-Volatile Memory Market Estimates and Forecasts, By Product (2020-2032) (USD Billion)

10.5.1.6.2 UAE Embedded Non-Volatile Memory Market Estimates and Forecasts, By Wafer Size (2020-2032) (USD Billion)

10.5.1.6.3 UAE Embedded Non-Volatile Memory Market Estimates and Forecasts, By Application (2020-2032) (USD Billion)

10.5.1.7 Egypt

10.5.1.7.1 Egypt Embedded Non-Volatile Memory Market Estimates and Forecasts, By Product (2020-2032) (USD Billion)

10.5.1.7.2 Egypt Embedded Non-Volatile Memory Market Estimates and Forecasts, By Wafer Size (2020-2032) (USD Billion)

10.5.1.7.3 Egypt Embedded Non-Volatile Memory Market Estimates and Forecasts, By Application (2020-2032) (USD Billion)

10.5.1.8 Saudi Arabia

10.5.1.8.1 Saudi Arabia Embedded Non-Volatile Memory Market Estimates and Forecasts, By Product (2020-2032) (USD Billion)

10.5.1.8.2 Saudi Arabia Embedded Non-Volatile Memory Market Estimates and Forecasts, By Wafer Size (2020-2032) (USD Billion)

10.5.1.8.3 Saudi Arabia Embedded Non-Volatile Memory Market Estimates and Forecasts, By Application (2020-2032) (USD Billion)

10.5.1.9 Qatar

10.5.1.9.1 Qatar Embedded Non-Volatile Memory Market Estimates and Forecasts, By Product (2020-2032) (USD Billion)

10.5.1.9.2 Qatar Embedded Non-Volatile Memory Market Estimates and Forecasts, By Wafer Size (2020-2032) (USD Billion)

10.5.1.9.3 Qatar Embedded Non-Volatile Memory Market Estimates and Forecasts, By Application (2020-2032) (USD Billion)

10.5.1.10 Rest of Middle East

10.5.1.10.1 Rest of Middle East Embedded Non-Volatile Memory Market Estimates and Forecasts, By Product (2020-2032) (USD Billion)

10.5.1.10.2 Rest of Middle East Embedded Non-Volatile Memory Market Estimates and Forecasts, By Wafer Size (2020-2032) (USD Billion)

10.5.1.10.3 Rest of Middle East Embedded Non-Volatile Memory Market Estimates and Forecasts, By Application (2020-2032) (USD Billion)

10.5.2 Africa

10.5.2.1 Trends Analysis

10.5.2.2 Africa Embedded Non-Volatile Memory Market Estimates and Forecasts, by Country (2020-2032) (USD Billion)

10.5.2.3 Africa Embedded Non-Volatile Memory Market Estimates and Forecasts, By Product (2020-2032) (USD Billion) 

10.5.2.4 Africa Embedded Non-Volatile Memory Market Estimates and Forecasts, By Wafer Size (2020-2032) (USD Billion)

10.5.2.5 Africa Embedded Non-Volatile Memory Market Estimates and Forecasts, By Application (2020-2032) (USD Billion)

10.5.2.6 South Africa

10.5.2.6.1 South Africa Embedded Non-Volatile Memory Market Estimates and Forecasts, By Product (2020-2032) (USD Billion)

10.5.2.6.2 South Africa Embedded Non-Volatile Memory Market Estimates and Forecasts, By Wafer Size (2020-2032) (USD Billion)

10.5.2.6.3 South Africa Embedded Non-Volatile Memory Market Estimates and Forecasts, By Application (2020-2032) (USD Billion)

10.5.2.7 Nigeria

10.5.2.7.1 Nigeria Embedded Non-Volatile Memory Market Estimates and Forecasts, By Product (2020-2032) (USD Billion)

10.5.2.7.2 Nigeria Embedded Non-Volatile Memory Market Estimates and Forecasts, By Wafer Size (2020-2032) (USD Billion)

10.5.2.7.3 Nigeria Embedded Non-Volatile Memory Market Estimates and Forecasts, By Application (2020-2032) (USD Billion)

10.5.2.8 Rest of Africa

10.5.2.8.1 Rest of Africa Embedded Non-Volatile Memory Market Estimates and Forecasts, By Product (2020-2032) (USD Billion)

10.5.2.8.2 Rest of Africa Embedded Non-Volatile Memory Market Estimates and Forecasts, By Wafer Size (2020-2032) (USD Billion)

10.5.2.8.3 Rest of Africa Embedded Non-Volatile Memory Market Estimates and Forecasts, By Application (2020-2032) (USD Billion)

10.6 Latin America

10.6.1 Trends Analysis

10.6.2 Latin America Embedded Non-Volatile Memory Market Estimates and Forecasts, by Country (2020-2032) (USD Billion)

10.6.3 Latin America Embedded Non-Volatile Memory Market Estimates and Forecasts, By Product (2020-2032) (USD Billion) 

10.6.4 Latin America Embedded Non-Volatile Memory Market Estimates and Forecasts, By Wafer Size (2020-2032) (USD Billion)

10.6.5 Latin America Embedded Non-Volatile Memory Market Estimates and Forecasts, By Application (2020-2032) (USD Billion)

10.6.6 Brazil

10.6.6.1 Brazil Embedded Non-Volatile Memory Market Estimates and Forecasts, By Product (2020-2032) (USD Billion)

10.6.6.2 Brazil Embedded Non-Volatile Memory Market Estimates and Forecasts, By Wafer Size (2020-2032) (USD Billion)

10.6.6.3 Brazil Embedded Non-Volatile Memory Market Estimates and Forecasts, By Application (2020-2032) (USD Billion)

10.6.7 Argentina

10.6.7.1 Argentina Embedded Non-Volatile Memory Market Estimates and Forecasts, By Product (2020-2032) (USD Billion)

10.6.7.2 Argentina Embedded Non-Volatile Memory Market Estimates and Forecasts, By Wafer Size (2020-2032) (USD Billion)

10.6.7.3 Argentina Embedded Non-Volatile Memory Market Estimates and Forecasts, By Application (2020-2032) (USD Billion)

10.6.8 Colombia

10.6.8.1 Colombia Embedded Non-Volatile Memory Market Estimates and Forecasts, By Product (2020-2032) (USD Billion)

10.6.8.2 Colombia Embedded Non-Volatile Memory Market Estimates and Forecasts, By Wafer Size (2020-2032) (USD Billion)

10.6.8.3 Colombia Embedded Non-Volatile Memory Market Estimates and Forecasts, By Application (2020-2032) (USD Billion)

10.6.9 Rest of Latin America

10.6.9.1 Rest of Latin America Embedded Non-Volatile Memory Market Estimates and Forecasts, By Product (2020-2032) (USD Billion)

10.6.9.2 Rest of Latin America Embedded Non-Volatile Memory Market Estimates and Forecasts, By Wafer Size (2020-2032) (USD Billion)

10.6.9.3 Rest of Latin America Embedded Non-Volatile Memory Market Estimates and Forecasts, By Application (2020-2032) (USD Billion)

11. Company Profiles

11.1 Spansion.

11.1.1 Company Overview

11.1.2 Financial

11.1.3 Products/ Services Offered

11.1.4 SWOT Analysis

11.2 Weebit Nano

11.2.1 Company Overview

11.2.2 Financial

11.2.3 Products/ Services Offered

11.2.4 SWOT Analysis

11.3 Macronix

11.3.1 Company Overview

11.3.2 Financial

11.3.3 Products/ Services Offered

11.3.4 SWOT Analysis

11.4 Virtium

11.4.1 Company Overview

11.4.2 Financial

11.4.3 Products/ Services Offered

11.4.4 SWOT Analysis

11.5 Phison

11.5.1 Company Overview

11.5.2 Financial

11.5.3 Products/ Services Offered

11.5.4 SWOT Analysis

11.6 Micron Technology

11.6.1 Company Overview

11.6.2 Financial

11.6.3 Products/ Services Offered

11.6.4 SWOT Analysis

11.7 Cypress Semiconductor.

11.7.1 Company Overview

11.7.2 Financial

11.7.3 Products/ Services Offered

11.7.4 SWOT Analysis

11.8 Winbond Electronics.

11.8.1 Company Overview

11.8.2 Financial

11.8.3 Products/ Services Offered

11.8.4 SWOT Analysis

11.9 Adesto Technologies

11.9.1 Company Overview

11.9.2 Financial

11.9.3 Products/ Services Offered

11.9.4 SWOT Analysis

11.10 NXP Semiconductors

11.10.1 Company Overview

11.10.2 Financial

11.10.3 Products/ Services Offered

11.10.4 SWOT Analysis

12. Use Cases and Best Practices

13. Conclusion

An accurate research report requires proper strategizing as well as implementation. There are multiple factors involved in the completion of good and accurate research report and selecting the best methodology to compete the research is the toughest part. Since the research reports we provide play a crucial role in any company’s decision-making process, therefore we at SNS Insider always believe that we should choose the best method which gives us results closer to reality. This allows us to reach at a stage wherein we can provide our clients best and accurate investment to output ratio.

Each report that we prepare takes a timeframe of 350-400 business hours for production. Starting from the selection of titles through a couple of in-depth brain storming session to the final QC process before uploading our titles on our website we dedicate around 350 working hours. The titles are selected based on their current market cap and the foreseen CAGR and growth.


The 5 steps process:

Step 1: Secondary Research:

Secondary Research or Desk Research is as the name suggests is a research process wherein, we collect data through the readily available information. In this process we use various paid and unpaid databases which our team has access to and gather data through the same. This includes examining of listed companies’ annual reports, Journals, SEC filling etc. Apart from this our team has access to various associations across the globe across different industries. Lastly, we have exchange relationships with various university as well as individual libraries.

Secondary Research

Step 2: Primary Research

When we talk about primary research, it is a type of study in which the researchers collect relevant data samples directly, rather than relying on previously collected data.  This type of research is focused on gaining content specific facts that can be sued to solve specific problems. Since the collected data is fresh and first hand therefore it makes the study more accurate and genuine.

We at SNS Insider have divided Primary Research into 2 parts.

Part 1 wherein we interview the KOLs of major players as well as the upcoming ones across various geographic regions. This allows us to have their view over the market scenario and acts as an important tool to come closer to the accurate market numbers. As many as 45 paid and unpaid primary interviews are taken from both the demand and supply side of the industry to make sure we land at an accurate judgement and analysis of the market.

This step involves the triangulation of data wherein our team analyses the interview transcripts, online survey responses and observation of on filed participants. The below mentioned chart should give a better understanding of the part 1 of the primary interview.

Primary Research

Part 2: In this part of primary research the data collected via secondary research and the part 1 of the primary research is validated with the interviews from individual consultants and subject matter experts.

Consultants are those set of people who have at least 12 years of experience and expertise within the industry whereas Subject Matter Experts are those with at least 15 years of experience behind their back within the same space. The data with the help of two main processes i.e., FGDs (Focused Group Discussions) and IDs (Individual Discussions). This gives us a 3rd party nonbiased primary view of the market scenario making it a more dependable one while collation of the data pointers.

Step 3: Data Bank Validation

Once all the information is collected via primary and secondary sources, we run that information for data validation. At our intelligence centre our research heads track a lot of information related to the market which includes the quarterly reports, the daily stock prices, and other relevant information. Our data bank server gets updated every fortnight and that is how the information which we collected using our primary and secondary information is revalidated in real time.

Data Bank Validation

Step 4: QA/QC Process

After all the data collection and validation our team does a final level of quality check and quality assurance to get rid of any unwanted or undesired mistakes. This might include but not limited to getting rid of the any typos, duplication of numbers or missing of any important information. The people involved in this process include technical content writers, research heads and graphics people. Once this process is completed the title gets uploader on our platform for our clients to read it.

Step 5: Final QC/QA Process:

This is the last process and comes when the client has ordered the study. In this process a final QA/QC is done before the study is emailed to the client. Since we believe in giving our clients a good experience of our research studies, therefore, to make sure that we do not lack at our end in any way humanly possible we do a final round of quality check and then dispatch the study to the client.

Key Industry Segments:

By Product

  • eFlash

  • eE2PROM

  • FRAM

  • Others

By Wafer Size

  • <100 mm

  • >100 mm

By Application

  • BFSI

  • Consumer Electronics

  • Government

  • Telecommunications

  • Information Technology

  • Others

Request for Segment Customization as per your Business Requirement: Segment Customization Request

Regional Coverage:

North America

  • US

  • Canada

  • Mexico

Europe

  • Eastern Europe

    • Poland

    • Romania

    • Hungary

    • Turkey

    • Rest of Eastern Europe

  • Western Europe

    • Germany

    • France

    • UK

    • Italy

    • Spain

    • Netherlands

    • Switzerland

    • Austria

    • Rest of Western Europe

Asia Pacific

  • China

  • India

  • Japan

  • South Korea

  • Vietnam

  • Singapore

  • Australia

  • Rest of Asia Pacific

Middle East & Africa

  • Middle East

    • UAE

    • Egypt

    • Saudi Arabia

    • Qatar

    • Rest of Middle East

  • Africa

    • Nigeria

    • South Africa

    • Rest of Africa

Latin America

  • Brazil

  • Argentina

  • Colombia

  • Rest of Latin America

Request for Country Level Research Report: Country Level Customization Request

Available Customization

With the given market data, SNS Insider offers customization as per the company’s specific needs. The following customization options are available for the report:

  • Detailed Volume Analysis

  • Criss-Cross segment analysis (e.g. Product X Application)

  • Competitive Product Benchmarking

  • Geographic Analysis

  • Additional countries in any of the regions

  • Customized Data Representation

  • Detailed analysis and profiling of additional market players


  •            5000 (33% Discount)


  •            8950 (40% Discount)


  •            3050 (23% Discount)

Start a Conversation

Hi! Click one of our member below to chat on Phone